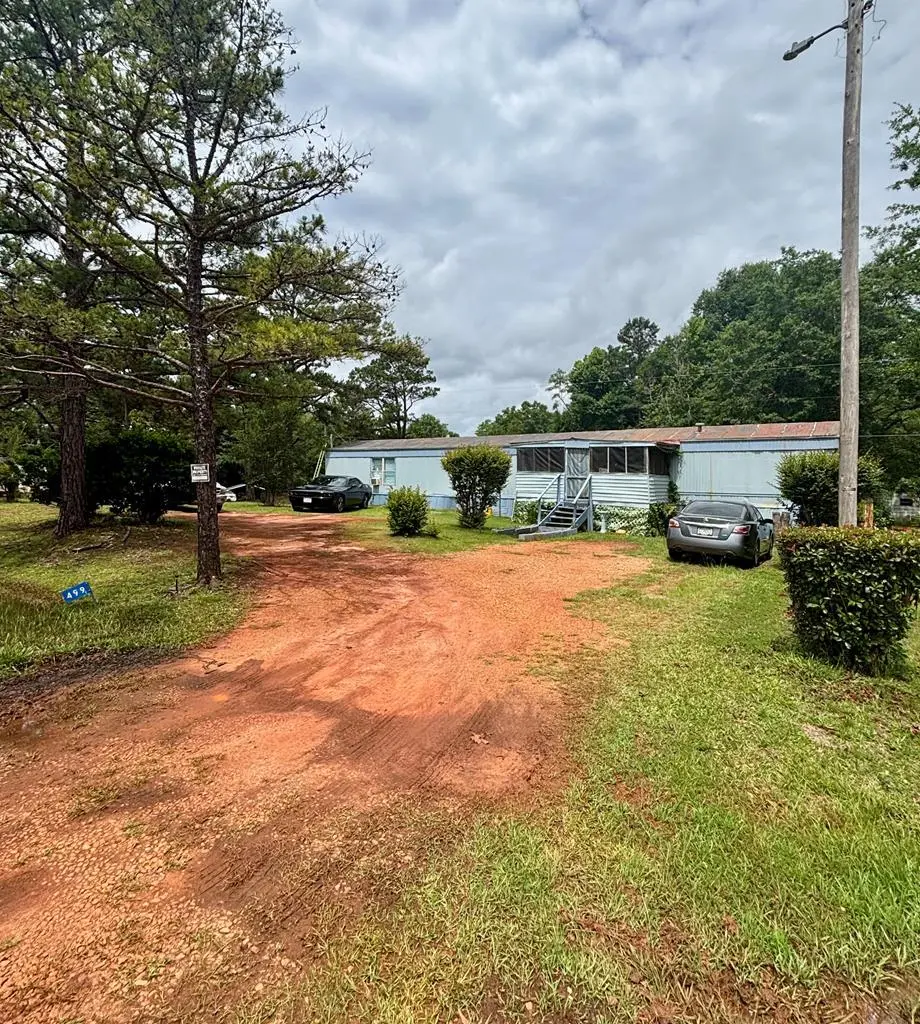
499 Valley Rd · Lumpkin, GA
Flood risk 1/10 · Minimal
- FEMA flood zone
- X (unshaded)
- Chance of flooding over 30 yrs
- 0.0%
- Est. flood insurance / yr
- $507 – $1,088
Fire risk 4/10 · Minor
- Est. fire insurance / yr
- $963 – $1,789
Heat risk 7/10 · Major
- Hot days now (above 107°F)
- 7 days/yr
- Hot days in 30 yrs
- 18 days/yr
Wind risk 8/10 · Major
- Chance of severe wind over 30 yrs
- 80.0%
Air-quality risk 3/10 · Minor
- Unhealthy air days now
- 3 days/yr
- Unhealthy air days in 30 yrs
- 3 days/yr
Risk factors via First Street. Map © Google.
Why this score? — see what drove the D grade
The composite is a weighted blend of 9 inputs, each scored 0–100. Each bar is that input's sub-score; the figure is the points it added to the 100-point composite (weight × sub-score).
- Cash flow +13.2/30.0
- ARV discount +7.5/15.0
- Appreciation +5.0/10.0
- DSCR +4.0/10.0
- 1% rule +3.7/10.0
- Schools +2.7/10.0
- Rent growth +2.5/5.0
- Livability +2.5/5.0
- Condition / age +2.5/5.0
$125,000
🖨 Deal sheet (PDF) 📄 Offer letter ✓ Due diligence
Listing remarks
Beautifully maintained manufactured home situated on approximately 1.57 acres in Lumpkin, GA! This 3-bedroom, 2-bath home offers peaceful country living with spacious outdoor space and a comfortable layout perfect for everyday living. Enjoy the privacy of a rural setting while still being conveniently located near local amenities. Whether you're a first-time homebuyer, downsizing, or looking for an investment opportunity, this property offers excellent value at $125,000. Property is being sold as-is. Schedule your private showing today!
Key facts
- 1.57 acre lot
- Listed 24 days
Property features AI
Finance
- Other: Located at 499 Valley Rd, Lumpkin, GA; Directions available from I-185 S to Valley Rd
Exterior
- Home design: Single-family residence; Residential property
- Construction: Aluminum siding
- Exterior features: 1.57-acre lot; No subdivision
Interior
- Bathrooms: Two full bathrooms
- Interior features: 2 full bathrooms
Neighborhood map
What this means for you Summary
Snapshot
- This is a 3-bed/2.0-bath manufactured listed at $125k.
Deal economics
- At list price, monthly cash flow is $-3 ($-39/yr) — negative.
- To cash-flow at today's rent, offer at most $125k (0.4% below list).
- To meet the 1% rule (rent ≥ 1% of price), the offer needs to be $109k (12.9% below list).
- Recommended offer: $109k (12.9% below list) — sets the bar for 1% rule.
Location & tenants
- Location reads 49/100 on livability (#587 in GA) — a working-class tenant base; expect higher turnover. Strengths: cost of living A+; Watch: housing D, crime F, amenities F.
- Stewart County (rural): math 35% / reading 26% proficiency, ranked #141 of 187 in GA (top 75%) — families likely to look elsewhere, expect single-tenant / working-renter base with shorter leases; 87% free/reduced lunch — lower-income household profile, screen leases tightly.
- Zoned schools: Stewart County Elementary School (math 8% / reading 12%, grade F, #1,092 of 1,228 statewide, top 91%, 192 students, 100% FRL); Stewart County Middle School (math 17% / reading 27%, grade F, #333 of 470 statewide, top 72%, 96 students, 100% FRL); Stewart County High School (math 10% / reading 30%, grade F, #232 of 424 statewide, top 56%, 119 students, 100% FRL).
- Zoned-school proficiency averages 17% at this address vs 30% district-wide (-13 pts) — the specific schools serving this property underperform the Stewart County average; the district grade overstates school quality for this exact location.
- Market conditions: 19 active listings in the ZIP; 2 units permitted in Stewart County in 2024 (0 in 5+ unit buildings).
Forward outlook
- In year one you build about $5k of equity ($864 loan paydown + $4k appreciation (3.0% local appreciation)).
- Stewart County population projected at +10% by 2050 — modest demand growth; plan on rents tracking national, not racing it.
- At projected returns (3.0% appreciation + 3.0% rent growth), your $35k cash investment doubles in ~7 years — after that, you're playing with house money.
- By year 8, paydown + projected appreciation supports a ~$34k cash-out refi (75% LTV) — recoverable capital for the next deal without selling this one.
Negotiation context
- It's been on market 24 days — a 2% lower offer ($123k) is reasonable based on typical stale-listing flexibility.
Risks & watch-outs
- Climate carrying-cost: severe wind risk, 80% chance of damaging wind over 30y; extreme-heat days projected 7→18/yr by 2055 (HVAC capex compounding) — expect insurance premiums to compound above CPI over the hold.
Questions for the listing agent
- What do current leases actually rent for vs. the listed asking? Can we see a recent rent roll and the last 12 months of T-12 income?
- Is there a deadline driving the sale (1031 exchange, divorce, estate, relocation)? That informs how much negotiation room exists.
- Schools are F-rated, which usually means shorter tenancies and higher turnover. Who's the typical renter profile here, and what's been the actual vacancy rate?
- Crime grade is F in this area — have there been break-ins, vandalism, or insurance claims at this property in the last 3 years? What carrier currently insures it and at what premium?
- The area grade is low — what's the realistic commute time and amenity access for the typical tenant pool here? Any planned neighborhood developments (good or bad) we should know about?
- What's the average days-on-market for RENTAL listings here right now (not sales)? A rising rental-DOM trend means longer vacancies and softer asking-rent achievability than the comps imply.
- What's the recent tenant-quality profile in this submarket — average credit score on applications, eviction rate, late-payment / NSF rate, and stable-employment percentage? A property-management company in the area should have these aggregated.
- How much new for-sale + rental construction is in the pipeline within 1–3 miles? Heavy new supply typically softens prices + rents 12–24 months out; constrained supply supports both.
Investment metrics
- 1% rule
- 0.87% ✗
- Cap rate
- 6.26%
- Cash-on-cash
- -0.11%
- DSCR
- 1.00
- GRM
- 9.6
CMA / ARV
No comps found within radius.
Projected returns pro-forma
3.0% appreciation · 3.0% rent growth · sell at horizon
- IRR
- 7.4%
- Equity multiple
- 1.42×
- Total profit
- $14,867
- Equity at exit
- $56,205
- IRR
- 10.1%
- Equity multiple
- 2.52×
- Total profit
- $53,259
- Equity at exit
- $86,619
Cash invested: $35,000 (down + closing). Projections, not guarantees.
Landlord ↔ Tenant lean methodology
- Overall (STATE)
- 90 Strongly Landlord-Friendly
- State Georgia
- 90 Strongly Landlord-Friendly · R+3
- County
- — inherits STATE
- City
- — inherits STATE
ZIP-level market 31815
- Active inventory
- 19
- Price-to-rent
- 9.6×
Monthly cashflow live
- Estimated rent
- $1,089 medium interval (Pro) →
- Mortgage (P&I)
- −$656
- Tax est. 1.5%
- −$156 /mo · $1,875/yr
- Insurance
- −$52
- HOA
- −$0
- Vacancy / Maint / Mgmt
- −$229
- Net cashflow
- $-3
Break-even live
Sensitivity live
| Price | -10% $83 | -5% $40 | +0% $-3 | +5% $-46 | +10% $-90 |
|---|---|---|---|---|---|
| Rent | -10% $-89 | -5% $-46 | +0% $-3 | +5% $40 | +10% $83 |
| Rate | -1.0pp $60 | -0.5pp $29 | base $-3 | +0.5pp $-36 | +1.0pp $-69 |
UW: 25.0% down · 7.5% · 30yr · 1.5% tax · 5.0% vac · 8.0% maint · 8.0% mgmt
Financing live
Cash to close
- Down payment
- $31,250
- Closing costs
- $3,750
- Reserves months
- —
- Total cash needed
- —
Loan-product check · same deal, 3 products live
Conventional
25% down · 7.5% · 30yr
- Down + closing
- —
- Monthly P&I
- —
- Monthly cashflow
- —
- DSCR
- —
- Eligible?
- —
Personal DTI + credit; lowest rate.
DSCR
20% down · 8.5% · 30yr
- Down + closing
- —
- Monthly P&I
- —
- Monthly cashflow
- —
- DSCR
- —
- Eligible?
- —
No personal income docs; deal must DSCR.
Hard money
10% down · 12.0% · 12mo
- Down + closing
- —
- Monthly P&I
- —
- Monthly cashflow
- —
- DSCR
- —
- Eligible?
- —
Short-term bridge; refi at stabilization.
Listing history 16 events
-
2026-06-22days on market $125,000 Active 24 DOM
-
2026-06-18days on market $125,000 Active 21 DOM
-
2026-06-17days on market $125,000 Active 20 DOM
-
2026-06-16days on market $125,000 Active 19 DOM
-
2026-06-15days on market $125,000 Active 18 DOM
-
2026-06-14days on market $125,000 Active 16 DOM
-
2026-06-13days on market $125,000 Active 15 DOM
-
2026-06-10days on market $125,000 Active 13 DOM
-
2026-06-09days on market $125,000 Active 12 DOM
-
2026-06-08days on market $125,000 Active 11 DOM
-
2026-06-07days on market $125,000 Active 10 DOM
-
2026-06-02days on market $125,000 Active 5 DOM
-
2026-06-01days on market $125,000 Active 4 DOM
-
2026-05-31days on market $125,000 Active 3 DOM
-
2026-05-30days on market $125,000 Active 2 DOM
-
2026-05-28$125,000 Active
ⓘ Source: listings_history table (triggers on properties + properties_extension) + one-shot
backfill from property_details.listing_events for pre-trigger history.
Climate risk First Street
- Flood 1/10 Low FEMA zone X (unshaded) · 0% chance over 30 yrs
- Wildfire 4/10 Moderate
- Heat 7/10 Severe 7 d/yr ≥107°F today · 18 d/yr by 30 yrs out
- Wind 8/10 Severe 80% chance of damaging wind over 30 yrs
- Air quality 3/10 Moderate 3 unhealthy d/yr today · 3 by 30 yrs out
Nearby sold comps map
Loading sold comps map…
Walkable amenities ~0.75 mi
Loading nearby amenities…
Taxation est. · year 1
- Rental income
- $13,072
- − Mortgage interest
- −$7,002
- − Property taxes
- −$1,875
- − Insurance
- −$625
- − Repairs & maintenance
- −$1,046
- − Management
- −$1,046
- − Depreciation
- −$3,636
- Taxable loss
- −$2,158
- Est. tax savings @ 24.0%
- +$518
- After-tax cash flow
- $479/yr
For passive investors: Depreciation is non-cash, so a rental often shows a tax loss while cash-flowing — sheltering income. Rental losses are passive: they offset passive income freely, and up to $25,000/yr can offset ordinary (W-2) income if you actively participate and your MAGI is under $100k (phasing out to $0 by $150k); unused losses carry forward. On sale, claimed depreciation is recaptured at up to 25%, and gains may owe capital-gains tax (a 1031 exchange can defer both). Figures are a year-1 estimate at your 24.0% rate — not tax advice; consult a CPA.
Schools (NCES district)
- District
- Stewart County
- NCES district ID
- 1304590
- Math proficiency
- 35% ▲ 9.00%
- Reading proficiency
- 26% ▲ 8.00%
- Median HH income
- $26,971
- Composite
- 27.25/100
- National rank
- #12434
- State rank
- #141 of 187 in GA
Livability — Lumpkin
- Score
- 49/100
- State rank
- #587
- US rank
- #25966
Category grades
Schools grade is shown separately in the Schools card above.
Census & demographics
- Population (ZIP)
- 2,989
Population outlook (Stewart County) Hauer SSP2
- Today (2025)
- 5,873 people
- By 2030
- 6,241 · +6.3%
- By 2040
- 6,569 · +11.9%
- By 2050
- 6,461 · +10.0%
- By 2075
- 5,819 · -0.9%
- By 2100
- 5,086 · -13.4%
Race, ethnicity, and origin ACS 2023
- Neighborhood character
- Diverse neighborhood (Simpson 0.61)
- Race & ethnicity
- Black 55% White 22% Hispanic / Latino 18% Asian 3% Two or more races 2%
- Hispanic origin (detail)
- Mexican 3% Cuban 1%
- Common ancestry
- Slovak 2%
- Foreign-born
- 22% · Canada, China, Vietnam
- Languages at home
- 75% English-only · Spanish 18% Other Indo-European 2% Chinese 1%
Political lean MEDSL · Stewart
- 2024 margin
- D (+16.3) · D 58.0% · R 41.8%
- 2008→2024 swing
- -8.5pp toward R · 2008: 24.8pp · 2024: 16.3pp
- All cycles
- 2024: D+16.3 2020: D+19.1 2016: D+20.2 2012: D+27.6 2008: D+24.8
Not yet ingested
- Civics
- —
Market trends
- HPI YoY
- —
- Current HPI
- —
- Rent YoY
- —
- Metro
- —
- State GDP YoY
- ▲ 2.66%
- F500 in state
- 28
Industry mix (Fortune 500 HQ in GA)
| Industry | F500 HQs | Revenue |
|---|---|---|
| Paper / Packaging | 2 | $29B |
|
||
| Retail | 1 | $160B |
|
||
| Transportation / Logistics | 1 | $91B |
|
||
| Airlines | 1 | $62B |
|
||
| Consumer Goods | 1 | $47B |
|
||
| Utilities | 1 | $25B |
|
||
Price history
1 event — show timeline
- 2026-05-28 Listed $125,000 CBOR
Property tax history
+1.6%/yrLatest (2025): $211 · +7.4% YoY. Source: county tax records.
Cash-flow waterfall
monthlySold comps — $/sqft
last 12 mo · ≤1 miLoading sold comps…