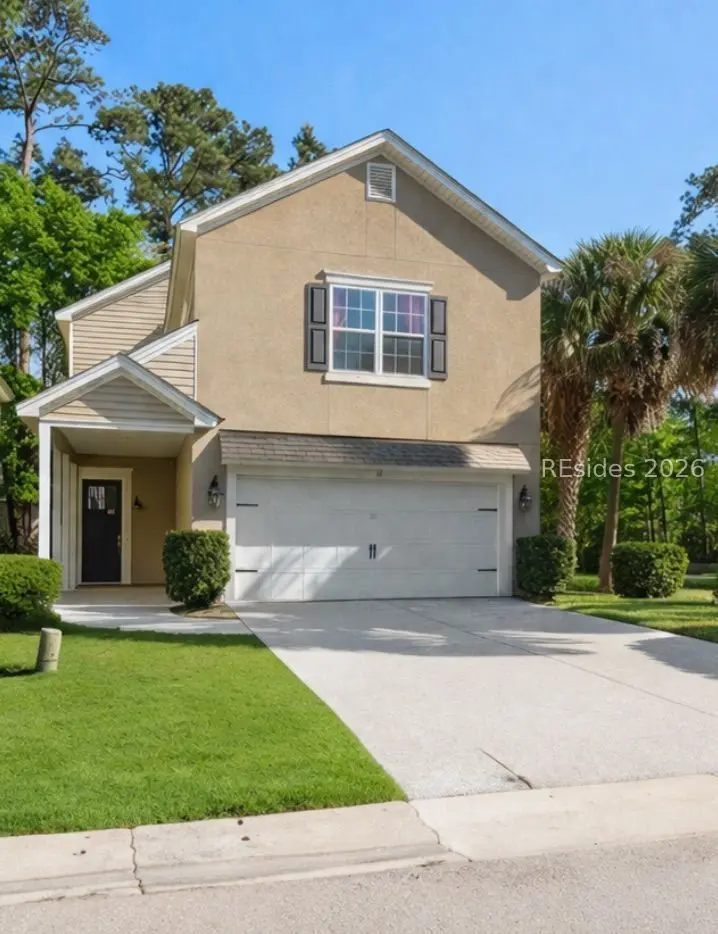
10 Hanahan Ln · Hilton Head Island, SC
Flood risk 3/10 · Minor
- FEMA flood zone
- X (unshaded)
- Chance of flooding over 30 yrs
- 0.12%
- Est. flood insurance / yr
- $507 – $1,088
Fire risk 3/10 · Minor
- Est. fire insurance / yr
- $783 – $1,453
Heat risk 10/10 · Severe
- Hot days now (above 106°F)
- 7 days/yr
- Hot days in 30 yrs
- 19 days/yr
Wind risk 9/10 · Severe
- Chance of severe wind over 30 yrs
- 99.0%
Air-quality risk 2/10 · Minimal
- Unhealthy air days now
- 2 days/yr
- Unhealthy air days in 30 yrs
- 2 days/yr
Risk factors via First Street. Map © Google.
Why this score? — see what drove the D- grade
The composite is a weighted blend of 9 inputs, each scored 0–100. Each bar is that input's sub-score; the figure is the points it added to the 100-point composite (weight × sub-score).
- ARV discount +13.2/15.0
- Cash flow +8.9/30.0
- Schools +4.1/10.0
- Livability +3.2/5.0
- DSCR +2.5/10.0
- Rent growth +2.5/5.0
- Condition / age +2.5/5.0
- 1% rule +1.5/10.0
- Appreciation +0.0/10.0
$528,999
🖨 Deal sheet (PDF) 📄 Offer letter ✓ Due diligence
Listing remarks MLS
Welcome tο 10 Hаnahаn Ꮮane, a ѕtаndout opportunity in the heаrt οf Hilton Head Island. This beautifully positioned home offers the perfect blend of Lowcountry charm and modern convenience, ideal as a primary residence, vacation retreat, or investment property. Set in a desirable location, this home provides easy access to Hilton Head's world-class beaches, golf courses, dining, and shopping, while still offering a sense of privacy and tranquility. Inside, you'll find a thoughtfully designed layout with inviting living spaces, abundant natural light, and seamless flow-perfect for both everyday living and entertaining. Whether you're enjoying quiet mornings on the porch, hosting friends and family, or taking advantage of everything Hilton Head has to offer just minutes away, 10 Hannah Lane delivers a lifestyle that is hard to match. Don't miss your chance to own a piece of one of the most sought-after coastal markets in the Southeast.
Key facts
- Modern convenience
- Desirable location
- 5,662 sq ft lot
Tags
Neighborhood map
What this means for you Summary
Snapshot
- This is a 3-bed/4.0-bath single-family listed at $529k.
Deal economics
- At list price, monthly cash flow is $-427 ($-5k/yr) — negative.
- To cash-flow at today's rent, offer at most $454k (14.3% below list).
- To meet the 1% rule (rent ≥ 1% of price), the offer needs to be $343k (35.2% below list).
- Recommended offer: $343k (35.2% below list) — sets the bar for 1% rule.
- Cap rate 5.3% vs local median 2.9% in Hilton Head Island — top-decile yield for the area; either an underpriced asset or a hidden risk that comps aren't pricing in. Stress-test before assuming the spread holds.
Location & tenants
- Location reads 64/100 on livability (#157 in SC) — a middle-class / working-renter tenant base. Strengths: employment A+, crime A-; Watch: amenities F, commute F, cost of living F.
- Beaufort 01 (town): math 42% / reading 51% proficiency, ranked #17 of 80 in SC (top 21%) — families likely to look elsewhere, expect single-tenant / working-renter base with shorter leases.
- Zoned schools: Hilton Head Island Elementary (math 50% / reading 49%, grade D, #168 of 597 statewide, top 31%, 709 students, 56% FRL); Hilton Head Island Middle (math 33% / reading 42%, grade F, #90 of 229 statewide, top 42%, 856 students, 52% FRL); Hilton Head Island High (math 70% / reading 82%, grade A-, #34 of 196 statewide, top 17%, 1,345 students, 40% FRL) — zoned schools at 49% FRL track the district average.
- Market conditions: Rents soft (-0.2%/yr); 400 active listings in the ZIP; 2 comparable units currently listed for rent nearby; solid renter incomes; 1,824 units permitted in Beaufort County in 2024 (618 in 5+ unit buildings).
- This rent runs 42% of the median local income ($98k/yr) — at the standard rent-burdened threshold; future hikes will face affordability resistance.
Forward outlook
- Local home prices are declining (-3.0%/yr); year-one equity from $4k of loan paydown is wiped out by about $16k of value loss. Plan a longer hold.
- Beaufort County population projected at +30% by 2050 — long-run rental-demand tailwind backs the buy-and-hold thesis.
Negotiation context
- It's been on market 80 days — a 6% lower offer ($497k) is reasonable based on typical stale-listing flexibility.
- 8 sale attempts since 18y ago with the ask held roughly flat each time — persistent listings suggest the price (not the market) is what's stuck; bring a comps-based counter.
- Current owner paid $253k; list at $529k implies a 109% gain — meaningful room to come down on a strong offer.
Risks & watch-outs
- Climate carrying-cost: severe wind risk, 99% chance of damaging wind over 30y; extreme-heat days projected 7→19/yr by 2055 (HVAC capex compounding) — expect insurance premiums to compound above CPI over the hold.
Questions for the listing agent
- What do current leases actually rent for vs. the listed asking? Can we see a recent rent roll and the last 12 months of T-12 income?
- It's been on market 80 days. Have you received any prior offers? Is the seller open to a 35% concession, seller financing, or rate buy-down credit?
- Why hasn't it sold? Are there any deal-killer items the seller is aware of (foundation, flood, title, zoning, code violations)?
- Is there a deadline driving the sale (1031 exchange, divorce, estate, relocation)? That informs how much negotiation room exists.
- Schools are B-rated — typically a magnet for longer-tenancy family renters. What's the average tenant stay here, and is there a school-zone premium baked into asking?
- The area grade is low — what's the realistic commute time and amenity access for the typical tenant pool here? Any planned neighborhood developments (good or bad) we should know about?
- What's the average days-on-market for RENTAL listings here right now (not sales)? A rising rental-DOM trend means longer vacancies and softer asking-rent achievability than the comps imply.
- What's the recent tenant-quality profile in this submarket — average credit score on applications, eviction rate, late-payment / NSF rate, and stable-employment percentage? A property-management company in the area should have these aggregated.
- How much new for-sale + rental construction is in the pipeline within 1–3 miles? Heavy new supply typically softens prices + rents 12–24 months out; constrained supply supports both.
Investment metrics
- 1% rule
- 0.65% ✗
- Cap rate
- 5.32%
- Cash-on-cash
- -3.46%
- DSCR
- 0.85
- GRM
- 12.9
CMA / ARV
- ARV (median comp)
- $605,484
- List price
- $528,999
- Delta
- -12.63%
- Verdict
- UNDERPRICED
- Comps
- 20 within 1.0 mi
Show comp detail 12 sales within ~0.75 mi
| Address | Dist | Beds/Ba | Sqft | Sold | Price | $/sf | Match |
|---|---|---|---|---|---|---|---|
| 101 Carolina Isles Dr | 0.06mi | 3/2.5 | 2,078 (+7%) | 5mo | $599,000 | $288 | 76 |
| 15 Hanahan Ln | 0.04mi | 4/2.5 (+1) | 1,742 (-11%) | 6mo | $490,000 | $281 | 64 |
| 38 Monticello Dr | 0.13mi | 3/2.0 | 1,800 (-8%) | 12mo | $460,000 | $256 | 63 |
| 18 Hanahan Ln | 0.04mi | 4/2.5 (+1) | 1,714 (-12%) | 11mo | $650,000 | $379 | 58 |
| 312 Ceasar Pl | 0.29mi | 3/2.5 | 1,744 (-11%) | 7mo | $467,000 | $268 | 57 |
| 35 Winding Trail Ln | 0.53mi | 3/2.0 | 2,030 (+4%) | 10mo | $765,000 | $377 | 52 |
| 138 Ceasar Pl | 0.39mi | 3/2.5 | 1,732 (-11%) | 9mo | $485,000 | $280 | 49 |
| 72 Cypress Marsh Dr | 0.66mi | 3/3.5 | 1,800 (-8%) | 9mo | $890,000 | $494 | 47 |
| 1 Twisted Oak Ct | 0.54mi | 3/2.0 | 1,816 (-7%) | 11mo | $875,000 | $482 | 46 |
| 90 Ceasar Pl | 0.37mi | 3/2.5 | 1,680 (-14%) | 9mo | $517,500 | $308 | 46 |
| 112 Headlands Dr | 0.69mi | 3/2.0 | 1,823 (-6%) | 7mo | $835,000 | $458 | 43 |
| 37 Cypress Marsh Dr | 0.48mi | 3/2.0 | 2,176 (+12%) | 11mo | $830,000 | $381 | 41 |
Match score weights: distance 35% · size 25% · config 20% · recency 20%. Top-matched comps best support the ARV.
Projected returns pro-forma
-3.0% appreciation · 0.0% rent growth · sell at horizon
- IRR
- -25.0%
- Equity multiple
- 0.17×
- Total profit
- $-123,220
- Equity at exit
- $78,875
- IRR
- -31.0%
- Equity multiple
- -0.23×
- Total profit
- $-182,207
- Equity at exit
- $45,738
Cash invested: $148,120 (down + closing). Projections, not guarantees.
Landlord ↔ Tenant lean methodology
- Overall (STATE)
- 90 Strongly Landlord-Friendly
- State South Carolina
- 90 Strongly Landlord-Friendly · R+6
- County
- — inherits STATE
- City
- — inherits STATE
ZIP-level market 29926
- Home prices YoY
- -26.7%
- Rents YoY
- -0.2%
- Active inventory
- 400
- Price-to-rent
- 12.9×
Monthly cashflow live
- Estimated rent
- $3,426 medium interval (Pro) →
- Mortgage (P&I)
- −$2,774
- Tax from tax record
- −$139 /mo · $1,669/yr
- Insurance
- −$220
- HOA
- −$0
- Vacancy / Maint / Mgmt
- −$720
- Net cashflow
- $-427
Break-even live
Sensitivity live
| Price | -10% $-127 | -5% $-277 | +0% $-427 | +5% $-577 | +10% $-726 |
|---|---|---|---|---|---|
| Rent | -10% $-698 | -5% $-562 | +0% $-427 | +5% $-292 | +10% $-156 |
| Rate | -1.0pp $-160 | -0.5pp $-292 | base $-427 | +0.5pp $-564 | +1.0pp $-703 |
UW: 25.0% down · 7.5% · 30yr · 1.5% tax · 5.0% vac · 8.0% maint · 8.0% mgmt
Financing live
Cash to close
- Down payment
- $132,250
- Closing costs
- $15,870
- Reserves months
- —
- Total cash needed
- —
Loan-product check · same deal, 3 products live
Conventional
25% down · 7.5% · 30yr
- Down + closing
- —
- Monthly P&I
- —
- Monthly cashflow
- —
- DSCR
- —
- Eligible?
- —
Personal DTI + credit; lowest rate.
DSCR
20% down · 8.5% · 30yr
- Down + closing
- —
- Monthly P&I
- —
- Monthly cashflow
- —
- DSCR
- —
- Eligible?
- —
No personal income docs; deal must DSCR.
Hard money
10% down · 12.0% · 12mo
- Down + closing
- —
- Monthly P&I
- —
- Monthly cashflow
- —
- DSCR
- —
- Eligible?
- —
Short-term bridge; refi at stabilization.
Rent comps 2 comps
| Address | Beds | Baths | Sqft | Rent | $/sqft | DOM | Units | Dist |
|---|---|---|---|---|---|---|---|---|
| 268 Ceasar Pl Hilton Head Island, SC | 4.0 | 2.5 | 2078 | $3,600 | $1.73 | 23d | 1 | 0.34mi |
| 12 Bermuda Pointe Cir Unit 12 Hilton Head Island, SC | 3.0 | 3.0 | 2400 | $2,300 | $0.96 | 45d | 1 | 0.75mi |
Listing history 30 events
-
2026-06-21days on market $528,999 Active 80 DOM
-
2026-06-18days on market $528,999 Active 77 DOM
-
2026-06-17days on market $528,999 Active 76 DOM
-
2026-06-16days on market $528,999 Active 75 DOM
-
2026-06-15days on market $528,999 Active 74 DOM
-
2026-06-14days on market $528,999 Active 72 DOM
-
2026-06-13days on market $528,999 Active 71 DOM
-
2026-06-10days on market $528,999 Active 69 DOM
-
2026-06-09days on market $528,999 Active 68 DOM
-
2026-06-08days on market $528,999 Active 67 DOM
-
2026-06-07days on market $528,999 Active 66 DOM
-
2026-06-05days on market $528,999 Active 63 DOM
-
2026-06-03days on market $528,999 Active 62 DOM
-
2026-06-02days on market $528,999 Active 61 DOM
-
2026-06-01days on market $528,999 Active 60 DOM
-
2026-05-31days on market $528,999 Active 59 DOM
-
2026-04-02$529,000 Active 962-char remark
Show marketing remark (637 chars)
10 Hanahan Lane on Hilton Head Island, a spacious, custom-built home showcasing classic Lowcountry details like a tabby shell driveway/patio, 12' ceilings, 8' doors, crown molding, and wood floors throughout. The main living area features a gas log fireplace, while the kitchen offers a large island, pantry, and built-in desk; perfect for everyday living and entertaining. Enjoy a main-level guest bath and no-step entry from the finished, insulated garage. Upstairs includes tiled baths and laundry, Jack-and-Jill and en suite bedrooms, plus a luxurious primary suite with a walk-in closet, double vanity, water closet, and jetted tub.
-
2026-04-02$529,000 Active 637-char remark
Show marketing remark (637 chars)
10 Hanahan Lane on Hilton Head Island, a spacious, custom-built home showcasing classic Lowcountry details like a tabby shell driveway/patio, 12' ceilings, 8' doors, crown molding, and wood floors throughout. The main living area features a gas log fireplace, while the kitchen offers a large island, pantry, and built-in desk; perfect for everyday living and entertaining. Enjoy a main-level guest bath and no-step entry from the finished, insulated garage. Upstairs includes tiled baths and laundry, Jack-and-Jill and en suite bedrooms, plus a luxurious primary suite with a walk-in closet, double vanity, water closet, and jetted tub.
-
2025-08-05$569,900 Active
-
2025-08-05$569,900 Active
-
2014-07-10soldstatus $253,000
-
2014-07-03soldstatus $253,000
-
2013-10-21$269,900
-
2013-03-14soldstatus $15,000
-
2013-03-11soldstatus $15,000
-
2011-08-16$20,000
-
2010-05-05soldstatus $1,000
-
2009-09-01$20,000
-
2008-11-25$79,000
-
2008-02-20soldstatus $294,500
ⓘ Source: listings_history table (triggers on properties + properties_extension) + one-shot
backfill from property_details.listing_events for pre-trigger history.
Tax reassessment forecast SC · Resets to sale price
- Current annual tax
- $1,669 · $139/mo
- Projected year-2 tax
- $3,015 · $251/mo
- Expected delta
- +$1,346/yr (+$112/mo · 80.6%)
ⓘ Screening estimate from a state-policy table — verify with the county assessor before closing.
Climate risk First Street
- Flood 3/10 Moderate FEMA zone X (unshaded) · 12% chance over 30 yrs
- Wildfire 3/10 Moderate
- Heat 10/10 Extreme 7 d/yr ≥106°F today · 19 d/yr by 30 yrs out
- Wind 9/10 Extreme 99% chance of damaging wind over 30 yrs
- Air quality 2/10 Low 2 unhealthy d/yr today · 2 by 30 yrs out
Nearby sold comps map
Loading sold comps map…
Walkable amenities ~0.75 mi
Loading nearby amenities…
Taxation est. · year 1
- Rental income
- $41,115
- − Mortgage interest
- −$29,632
- − Property taxes
- −$1,669
- − Insurance
- −$2,645
- − Repairs & maintenance
- −$3,289
- − Management
- −$3,289
- − Depreciation
- −$15,389
- Taxable loss
- −$14,799
- Est. tax savings @ 24.0%
- +$3,552
- After-tax cash flow
- $-1,571/yr
For passive investors: Depreciation is non-cash, so a rental often shows a tax loss while cash-flowing — sheltering income. Rental losses are passive: they offset passive income freely, and up to $25,000/yr can offset ordinary (W-2) income if you actively participate and your MAGI is under $100k (phasing out to $0 by $150k); unused losses carry forward. On sale, claimed depreciation is recaptured at up to 25%, and gains may owe capital-gains tax (a 1031 exchange can defer both). Figures are a year-1 estimate at your 24.0% rate — not tax advice; consult a CPA.
Schools (NCES district)
- District
- Beaufort 01
- NCES district ID
- 4501110
- Math proficiency
- 42% ▼ -8.00%
- Reading proficiency
- 51% ▲ 2.00%
- Median HH income
- $57,430
- Composite
- 40.56/100
- National rank
- #3699
- State rank
- #17 of 80 in SC
Livability — Hilton Head Island
- Score
- 64/100
- State rank
- #157
- US rank
- #14648
Category grades
Schools grade is shown separately in the Schools card above.
Census & demographics
- Census place
- Hilton Head Island, SC
- County
- Beaufort County · 163,770 people
- City population
- 40,243
- Metro
- Hilton Head Island-Bluffton, SC
- Population (ZIP)
- 24,458
- Household income
- $97,948
- Rent vs Own
- Severe rent burden
- 562.0
Population outlook (Beaufort County) Hauer SSP2
- Today (2025)
- 211,915 people
- By 2030
- 227,272 · +7.2%
- By 2040
- 253,861 · +19.8%
- By 2050
- 275,126 · +29.8%
- By 2075
- 311,022 · +46.8%
- By 2100
- 321,286 · +51.6%
Race, ethnicity, and origin ACS 2023
- Neighborhood character
- Predominantly White (70%)
- Race & ethnicity
- White 70% Hispanic / Latino 19% Two or more races 9% Black 8%
- Hispanic origin (detail)
- Mexican 13%
- Common ancestry
- Romanian 3% Slovak 3% Lithuanian 2%
- Foreign-born
- 14% · Canada, Jamaica
- Languages at home
- 82% English-only · Spanish 16% French/Haitian/Cajun 1% Other Indo-European 1%
Political lean MEDSL · Beaufort
- 2024 margin
- R (+14.5) · D 42.1% · R 56.6% · Other 1.2%
- 2008→2024 swing
- -3.7pp toward R · 2008: -10.8pp · 2024: -14.5pp
- All cycles
- 2024: R+14.5 2020: R+10.0 2016: R+14.3 2012: R+17.5 2008: R+10.8
Not yet ingested
- Civics
- —
Market trends
- HPI YoY
- ▼ -98.89%
- Current HPI
- 271.4783
- Rent YoY
- ▼ -0.16%
- Metro
- Hilton Head Island-Bluffton, SC
- State GDP YoY
- ▲ 4.51%
- F500 in state
- 2
Industry mix (Fortune 500 HQ in SC)
| Industry | F500 HQs | Revenue |
|---|---|---|
| Packaging | 1 | $7B |
|
||
Price history
+79.6% since first listed14 events — show timeline
- 2026-04-02 Listed $529,000 RSMLS
- 2026-04-02 Listed $529,000 LRMLS
- 2025-08-05 Listed $569,900 RSMLS
- 2025-08-05 Listed $569,900 LRMLS
- 2014-07-10 Sold (Public Records) $253,000 Public Records
- 2014-07-03 Sold (MLS) $253,000 RSMLS
- 2013-10-21 Listed $269,900 RSMLS
- 2013-03-14 Sold (Public Records) $15,000 Public Records
- 2013-03-11 Sold (MLS) $15,000 RSMLS
- 2011-08-16 Listed $20,000 RSMLS
- 2010-05-05 Sold (Public Records) $1,000 Public Records
- 2009-09-01 Listed $20,000 RSMLS
- 2008-11-25 Listed $79,000 RSMLS
- 2008-02-20 Sold (Public Records) $294,500 Public Records
Property tax history
+16.8%/yrLatest (2025): $1,669 · -13.1% YoY. Source: county tax records.
Cash-flow waterfall
monthlySold comps — $/sqft
last 12 mo · ≤1 miLoading sold comps…