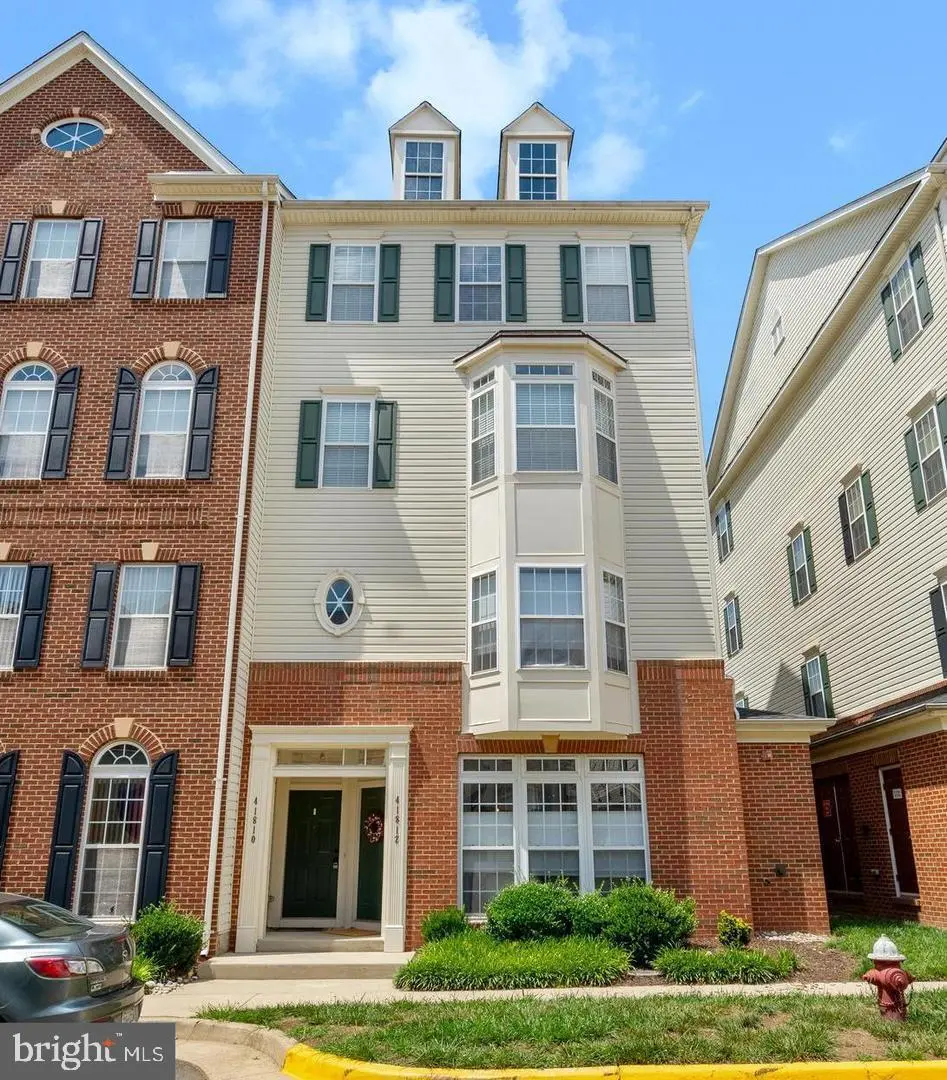
41812 Inspiration Ter · Stone Ridge, VA
Flood risk 1/10 · Minimal
- FEMA flood zone
- X (unshaded)
- Chance of flooding over 30 yrs
- 0.0%
- Est. flood insurance / yr
- $507 – $1,088
Fire risk 3/10 · Minor
- Est. fire insurance / yr
- $666 – $1,236
Heat risk 7/10 · Major
- Hot days now (above 103°F)
- 7 days/yr
- Hot days in 30 yrs
- 17 days/yr
Wind risk 4/10 · Minor
- Chance of severe wind over 30 yrs
- 9.0%
Air-quality risk 2/10 · Minimal
- Unhealthy air days now
- 1 days/yr
- Unhealthy air days in 30 yrs
- 1 days/yr
Risk factors via First Street. Map © Google.
Why this score? — see what drove the D grade
The composite is a weighted blend of 9 inputs, each scored 0–100. Each bar is that input's sub-score; the figure is the points it added to the 100-point composite (weight × sub-score).
- ARV discount +10.4/15.0
- Appreciation +7.5/10.0
- Schools +6.7/10.0
- Cash flow +6.5/30.0
- Livability +3.6/5.0
- Rent growth +2.5/5.0
- Condition / age +2.5/5.0
- 1% rule +1.6/10.0
- DSCR +0.7/10.0
$479,995
🖨 Deal sheet 📄 Offer letter ✓ Due diligence
Listing remarks
Welcome home to this beautifully maintained main-level condo in the highly sought-after Kirkpatrick Farms community! The open-concept floor plan features gorgeous hardwood flooring throughout the main level and a stunning gourmet kitchen with quartz countertops, stainless steel appliances, a center island with breakfast bar seating, and ample cabinet space, perfect for both everyday living and entertaining. The spacious living and dining area offers a bright and inviting atmosphere, creating the ideal gathering space for family and friends. Upstairs, luxury vinyl plank flooring extends throughout the second level, including the luxurious primary suite, which boasts a large walk-in closet an
Key facts
- Quartz countertops
- Gourmet kitchen
- Main level condo
Tags
Property features AI
Finance
- HOA & community: Monthly condo fee of $319; HOA covers common area maintenance, management, pool(s), snow removal, and trash; Community amenities include basketball courts, clubhouse, common grounds, fitness center, jogging/walking path, outdoor pool, tennis courts, and playgrounds
Exterior
- Parking: Attached rear-entry garage (1 space)
- Utilities: Public water; Public sewer; Electric service for heating, cooling, and hot water
- Home design: End-of-row townhouse; Condominium ownership
- Construction: Vinyl siding; Other foundation type; Built (year per assessor)
- Exterior features: Community pool; Above-grade and below-grade structures noted
Interior
- Kitchen: Built-in microwave; Dishwasher; Disposal; Refrigerator; Icemaker; Stove
- Bedrooms: Three bedrooms on the upper level
- Bathrooms: Two full bathrooms (both on the upper level); One half bathroom on the main level
- Heating & cooling: Forced air heating (electric); Central air conditioning (electric); Electric hot water
- Interior features: Ceiling fans; Window treatments
- Laundry & utility: Laundry on the upper floor
Neighborhood map
What this means for you Summary
Snapshot
- This is a 3-bed/2.5-bath townhouse listed at $480k.
Deal economics
- At list price, monthly cash flow is $-821 ($-10k/yr) — negative.
- To cash-flow at today's rent, offer at most $335k (30.2% below list).
- To meet the 1% rule (rent ≥ 1% of price), the offer needs to be $319k (33.6% below list).
- Recommended offer: $319k (33.6% below list) — sets the bar for 1% rule.
- Cap rate 4.2% vs local median 2.6% in Stone Ridge — top-decile yield for the area; either an underpriced asset or a hidden risk that comps aren't pricing in. Stress-test before assuming the spread holds.
Location & tenants
- Location reads 72/100 on livability (#207 in VA) — a middle-class / working-renter tenant base. Strengths: crime A+, employment A+, housing A+; Watch: health & safety C-, amenities F, commute F.
- Loudoun County Public School District (suburban): math 64% / reading 79% proficiency, ranked #7 of 131 in VA (top 5%) — strong family-tenant draw, lease renewals of 3-5y typical; only 12% free/reduced lunch — higher-income household profile.
- Zoned schools: Lightridge High (math 74% / reading 92%, grade A, #33 of 319 statewide, top 11%, 1,771 students, 10% FRL) — zoned schools at 10% FRL track the district average.
- Market conditions: 174 active listings in the ZIP; 18 comparable units currently listed for rent nearby; rentals at typical pace (median 24d on market — plan ~3-4 weeks tenant-placement turnaround); high-income renter base; 3,317 units permitted in Loudoun County in 2024 (1,818 in 5+ unit buildings).
- This rent is only 17% of the median local income ($219k/yr) — well below the 30% rent-burden line; pricing power to push rent on renewal without tenant pushback.
Forward outlook
- In year one you build about $27k of equity ($3k loan paydown + $24k appreciation (5.0% local appreciation)).
- Loudoun County population projected at +65% by 2050 — long-run rental-demand tailwind backs the buy-and-hold thesis.
- By year 2, paydown + projected appreciation supports a ~$44k cash-out refi (75% LTV) — recoverable capital for the next deal without selling this one.
Negotiation context
- Only 14 days on market — expect competitive offers; lowballing is unlikely to land.
Risks & watch-outs
- Climate carrying-cost: extreme-heat days projected 7→17/yr by 2055 (HVAC capex compounding) — expect insurance premiums to compound above CPI over the hold.
Questions for the listing agent
- What do current leases actually rent for vs. the listed asking? Can we see a recent rent roll and the last 12 months of T-12 income?
- What does the HOA fee cover, when was the last increase, and are there any pending special assessments or reserve-fund shortfalls?
- Is there a deadline driving the sale (1031 exchange, divorce, estate, relocation)? That informs how much negotiation room exists.
- Schools are A-rated — typically a magnet for longer-tenancy family renters. What's the average tenant stay here, and is there a school-zone premium baked into asking?
- The area grade is low — what's the realistic commute time and amenity access for the typical tenant pool here? Any planned neighborhood developments (good or bad) we should know about?
- What's the average days-on-market for RENTAL listings here right now (not sales)? A rising rental-DOM trend means longer vacancies and softer asking-rent achievability than the comps imply.
- What's the recent tenant-quality profile in this submarket — average credit score on applications, eviction rate, late-payment / NSF rate, and stable-employment percentage? A property-management company in the area should have these aggregated.
- How much new for-sale + rental construction is in the pipeline within 1–3 miles? Heavy new supply typically softens prices + rents 12–24 months out; constrained supply supports both.
Investment metrics
- 1% rule
- 0.66% ✗
- Cap rate
- 4.24%
- Cash-on-cash
- -7.33%
- DSCR
- 0.67
- GRM
- 12.6
CMA / ARV
- ARV (on-the-fly)
- $512,512
- Comps found
- 12
Show comp detail 12 sales within ~0.75 mi
| Address | Dist | Beds/Ba | Sqft | Sold | Price | $/sf | Match |
|---|---|---|---|---|---|---|---|
| 41858 Inspiration Ter | 0.06mi | 3/— | 1,650 (-1%) | 3mo | $483,550 | $293 | 93 |
| 41882 Inspiration Ter | 0.09mi | 3/2.5 | 1,685 (+1%) | 3mo | $485,000 | $288 | 91 |
| 25408 Patriot Ter | 0.07mi | 3/2.5 | 1,650 (-1%) | 8mo | $495,000 | $300 | 89 |
| 41859 Inspiration Ter | 0.07mi | 3/2.5 | 1,650 (-1%) | 8mo | $430,000 | $261 | 88 |
| 25336 Sweetness Ter | 0.22mi | 3/2.5 | 1,762 (+6%) | 4mo | $575,000 | $326 | 77 |
| 25284 Gray Poplar Ter | 0.58mi | 3/2.5 | 1,610 (-3%) | 0mo | $495,320 | $308 | 67 |
| 25292 Gray Poplar Ter | 0.58mi | 3/2.5 | 1,610 (-3%) | 3mo | $495,000 | $307 | 65 |
| 25388 Peaceful Ter | 0.16mi | 3/3.0 | 1,838 (+10%) | 10mo | $605,000 | $329 | 65 |
| 25133 Hummocky Ter | 0.41mi | 4/3.5 (+1) | 1,538 (-8%) | 11mo | $565,000 | $367 | 50 |
| 42038 Angel Arch Ter | 0.60mi | 3/3.5 | 1,566 (-6%) | 11mo | $560,000 | $358 | 49 |
| 24953 Coats Sq | 0.69mi | 2/2.5 (-1) | 1,592 (-4%) | 10mo | $490,000 | $308 | 48 |
| 41866 Diabase Sq | 0.51mi | 4/2.0 (+1) | 1,430 (-14%) | 1mo | $550,000 | $385 | 45 |
Match score weights: distance 35% · size 25% · config 20% · recency 20%. Top-matched comps best support the ARV.
Projected returns pro-forma
4.98% appreciation · 3.0% rent growth · sell at horizon
- IRR
- 6.7%
- Equity multiple
- 1.43×
- Total profit
- $57,731
- Equity at exit
- $271,266
- IRR
- 8.8%
- Equity multiple
- 2.64×
- Total profit
- $220,252
- Equity at exit
- $467,558
Cash invested: $134,399 (down + closing). Projections, not guarantees.
Landlord ↔ Tenant lean methodology
- Overall (STATE)
- 55 Moderately Landlord-Leaning
- State Virginia
- 55 Moderately Landlord-Leaning · D+2
- County
- — inherits STATE
- City
- — inherits STATE
ZIP-level market 20105
- Home prices YoY
- 1.5%
- Active inventory
- 174
- Price-to-rent
- 12.6×
Monthly cashflow live
- Estimated rent
- $3,187 high interval (Pro) →
- Mortgage (P&I)
- −$2,517
- Tax from tax record
- −$302 /mo · $3,625/yr
- Insurance
- −$200
- HOA
- −$319
- Vacancy / Maint / Mgmt
- −$669
- Net cashflow
- $-821
Break-even live
UW: 25.0% down · 7.5% · 30yr · 1.5% tax · 5.0% vac · 8.0% maint · 8.0% mgmt
Financing live
Cash to close
- Down payment
- $119,999
- Closing costs
- $14,400
- Reserves months
- —
- Total cash needed
- —
Loan-product check · same deal, 3 products live
Conventional
25% down · 7.5% · 30yr
- Down + closing
- —
- Monthly P&I
- —
- Monthly cashflow
- —
- DSCR
- —
- Eligible?
- —
Personal DTI + credit; lowest rate.
DSCR
20% down · 8.5% · 30yr
- Down + closing
- —
- Monthly P&I
- —
- Monthly cashflow
- —
- DSCR
- —
- Eligible?
- —
No personal income docs; deal must DSCR.
Hard money
10% down · 12.0% · 12mo
- Down + closing
- —
- Monthly P&I
- —
- Monthly cashflow
- —
- DSCR
- —
- Eligible?
- —
Short-term bridge; refi at stabilization.
Rent comps 18 comps
| Address | Beds | Baths | Sqft | Rent | $/sqft | DOM | Units | Dist |
|---|---|---|---|---|---|---|---|---|
| 41877 Inspiration Ter Aldie, VA | 2.0 | 2.0 | 1650 | $3,250 | $1.97 | 43d | 1 | 0.12mi |
| 41717 McMonagle Sq Aldie, VA | 4.0 | 3.5 | 1960 | $3,250 | $1.66 | 43d | 1 | 0.42mi |
| 25704 Spring Race Ter Aldie, VA | 3.0 | 2.5 | 1925 | $3,200 | $1.66 | 17d | 1 | 0.86mi |
| 24800 Beardgrass Pl Aldie, VA | 2.0 | 1.0 | 1200 | $1,800 | $1.50 | 18d | 1 | 0.92mi |
| 24660 Woolly Mammoth Ter #402 Aldie, VA | 3.0 | 2.0 | 1682 | $3,000 | $1.78 | 24d | 1 | 1.22mi |
| 24636 Woolly Mammoth Ter #405 Aldie, VA | 3.0 | 2.0 | 1712 | $2,850 | $1.66 | 24d | 1 | 1.26mi |
| 24636 Woolly Mammoth Ter #405 Aldie, VA | 3.0 | 2.0 | 1789 | $2,850 | $1.59 | 12d | 1 | 1.26mi |
| 24673 Nettle Mill Sq Aldie, VA | 4.0 | 3.5 | 1566 | $2,900 | $1.85 | 43d | 1 | 1.28mi |
| 42236 Terrazzo Ter Aldie, VA | 2.0 | 2.5 | 1280 | $2,525 | $1.97 | 24d | 1 | 1.34mi |
| 25884 Racing Sun Dr Aldie, VA | 3.0 | 2.5 | 1600 | $3,100 | $1.94 | 10d | 1 | 1.34mi |
| 42219 Black Rock Ter Aldie, VA | 2.0 | 2.5 | 1266 | $2,750 | $2.17 | 43d | 1 | 1.35mi |
| 42309 Onyx Ter Aldie, VA | 2.0 | 2.5 | 1436 | $2,750 | $1.92 | 17d | 1 | 1.36mi |
| 24701 Byrne Meadow Sq #211 Aldie, VA | 2.0 | 2.0 | 1189 | $2,400 | $2.02 | 24d | 1 | 1.38mi |
| 41985 White Mills Ter Unit 57 Stone Ridge, VA | 3.0 | 2.5 | 2216 | $3,290 | $1.48 | 43d | 1 | 1.42mi |
| 42212 Water Iris Ter Unit 42212 Aldie, VA | 3.0 | 2.0 | 1584 | $2,700 | $1.70 | 43d | 1 | 1.43mi |
| 24558 Rosebay Ter Aldie, VA | 3.0 | 2.5 | 2000 | $2,975 | $1.49 | 24d | 1 | 1.43mi |
| 24628 Byrne Meadow Sq #301 Aldie, VA | 2.0 | 2.0 | 1117 | $2,295 | $2.05 | 5d | 1 | 1.46mi |
| 24620 Byrne Meadow Sq #300 Aldie, VA | 2.0 | 2.0 | 1190 | $2,350 | $1.97 | 12d | 1 | 1.47mi |
HOA detail
- Monthly dues
- $319 · $3,828/yr
Listing history 9 events
-
2026-06-18days on market $479,995 Active 14 DOM
-
2026-06-17days on market $479,995 Active 13 DOM
-
2026-06-16days on market $479,995 Active 12 DOM
-
2026-06-15pricedays on market $479,995 Active 11 DOM
-
2026-06-13days on market $489,995 Active 9 DOM
-
2026-06-09days on market $489,995 Active 5 DOM
-
2026-06-08days on market $489,995 Active 4 DOM
-
2026-06-07remarks 699-char remark
-
2026-06-07$489,995 Active 3 DOM
ⓘ Source: listings_history table (triggers on properties + properties_extension) + one-shot
backfill from property_details.listing_events for pre-trigger history.
Tax reassessment forecast VA · Resets to sale price
- Current annual tax
- $3,625 · $302/mo
- Projected year-2 tax
- $3,936 · $328/mo
- Expected delta
- +$311/yr (+$26/mo · 8.6%)
ⓘ Screening estimate from a state-policy table — verify with the county assessor before closing.
Climate risk First Street
- Flood 1/10 Low FEMA zone X (unshaded) · 0% chance over 30 yrs
- Wildfire 3/10 Moderate
- Heat 7/10 Severe 7 d/yr ≥103°F today · 17 d/yr by 30 yrs out
- Wind 4/10 Moderate 9% chance of damaging wind over 30 yrs
- Air quality 2/10 Low 1 unhealthy d/yr today · 1 by 30 yrs out
Nearby sold comps map
Loading sold comps map…
Walkable amenities ~0.75 mi
Loading nearby amenities…
Taxation est. · year 1
- Rental income
- $38,242
- − Mortgage interest
- −$26,887
- − Property taxes
- −$3,625
- − Insurance
- −$2,400
- − Repairs & maintenance
- −$3,059
- − Management
- −$3,059
- − HOA
- −$3,828
- − Depreciation
- −$13,963
- Taxable loss
- −$18,580
- Est. tax savings @ 24.0%
- +$4,459
- After-tax cash flow
- $-5,388/yr
For passive investors: Depreciation is non-cash, so a rental often shows a tax loss while cash-flowing — sheltering income. Rental losses are passive: they offset passive income freely, and up to $25,000/yr can offset ordinary (W-2) income if you actively participate and your MAGI is under $100k (phasing out to $0 by $150k); unused losses carry forward. On sale, claimed depreciation is recaptured at up to 25%, and gains may owe capital-gains tax (a 1031 exchange can defer both). Figures are a year-1 estimate at your 24.0% rate — not tax advice; consult a CPA.
Schools (NCES district)
- District
- Loudoun County Public School District
- NCES district ID
- 5102250
- Math proficiency
- 64% ▼ -22.00%
- Reading proficiency
- 79% ▼ -5.00%
- Median HH income
- $121,927
- Composite
- 67.43/100
- National rank
- #379
- State rank
- #7 of 131 in VA
Livability — Stone Ridge
- Score
- 72/100
- State rank
- #207
- US rank
- #6435
Category grades
Schools grade is shown separately in the Schools card above.
Census & demographics
- Census place
- Stone Ridge, VA
- County
- Loudoun County · 393,062 people
- Metro
- Washington-Arlington-Alexandria, DC-VA-MD-WV
- Population (ZIP)
- 37,639
- Household income
- $219,123
- Rent vs Own
- Severe rent burden
- 49.0
Population outlook (Loudoun County) Hauer SSP2
- Today (2025)
- 503,590 people
- By 2030
- 568,852 · +13.0%
- By 2040
- 701,480 · +39.3%
- By 2050
- 828,841 · +64.6%
- By 2075
- 1,105,645 · +119.6%
- By 2100
- 1,265,472 · +151.3%
Race, ethnicity, and origin ACS 2023
- Neighborhood character
- Diverse neighborhood (Simpson 0.69)
- Race & ethnicity
- White 45% Asian 31% Black 11% Two or more races 9% Hispanic / Latino 7%
- Hispanic origin (detail)
- Mexican 1%
- Common ancestry
- Romanian 3% Italian 2% Serbian 1%
- Foreign-born
- 30% · Canada, South Korea, China
- Languages at home
- 63% English-only · Other Indo-European 14% Other Asian/Pacific 9% Spanish 5%
Political lean MEDSL · Loudoun
- 2024 margin
- D (+16.3) · D 56.6% · R 40.4% · Other 3.0%
- 2008→2024 swing
- +8.0pp toward D · 2008: 8.2pp · 2024: 16.3pp
- All cycles
- 2024: D+16.3 2020: D+25.0 2016: D+16.8 2012: D+4.5 2008: D+8.2
Not yet ingested
- Civics
- —
Market trends
- HPI YoY
- ▲ 4.98%
- Current HPI
- 344.3873
- Rent YoY
- —
- Metro
- Washington-Arlington-Alexandria, DC-VA-MD-WV
- State GDP YoY
- ▲ 2.40%
- F500 in state
- 50
Industry mix (Fortune 500 HQ in VA)
| Industry | F500 HQs | Revenue |
|---|---|---|
| Aerospace / Defense | 4 | $236B |
|
||
| Technology / Defense | 3 | $32B |
|
||
| Financial Services | 2 | $176B |
|
||
| Utilities | 2 | $27B |
|
||
| Insurance | 2 | $25B |
|
||
| Technology | 2 | $15B |
|
||
Price history
+12.6% since first listed2 events — show timeline
- 2026-06-04 Listed $489,995 BRIGHT MLS
- 2023-08-10 Sold (Public Records) $435,000 Public Records
Property tax history
+1.9%/yrLatest (2025): $3,625 · +0.2% YoY. Source: county tax records.
Cash-flow waterfall
monthlySold comps — $/sqft
last 12 mo · ≤1 miLoading sold comps…