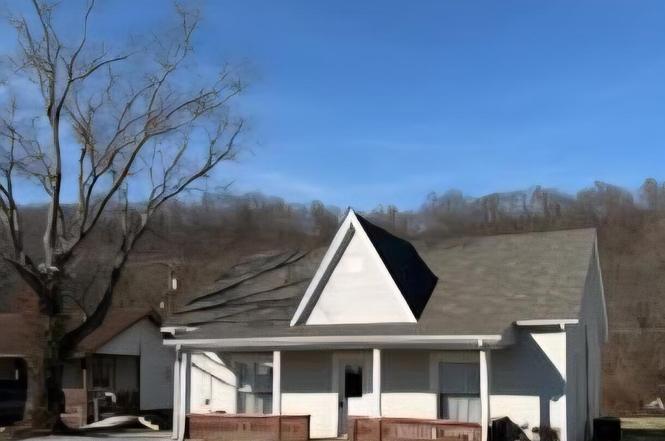
591 Kentucky 467 · Worthville, KY
Flood risk 2/10 · Minimal
- FEMA flood zone
- X (unshaded)
- Chance of flooding over 30 yrs
- 0.07%
- Est. flood insurance / yr
- $507 – $1,088
Fire risk 4/10 · Minor
- Est. fire insurance / yr
- $839 – $1,559
Heat risk 5/10 · Moderate
- Hot days now (above 104°F)
- 7 days/yr
- Hot days in 30 yrs
- 20 days/yr
Wind risk 2/10 · Minimal
- Chance of severe wind over 30 yrs
- 1.0%
Air-quality risk 2/10 · Minimal
- Unhealthy air days now
- 1 days/yr
- Unhealthy air days in 30 yrs
- 2 days/yr
Risk factors via First Street. Map © Google.
Why this score? — see what drove the D+ grade
The composite is a weighted blend of 9 inputs, each scored 0–100. Each bar is that input's sub-score; the figure is the points it added to the 100-point composite (weight × sub-score).
- Cash flow +15.0/30.0
- ARV discount +10.3/15.0
- DSCR +4.6/10.0
- Appreciation +3.6/10.0
- 1% rule +2.8/10.0
- Livability +2.6/5.0
- Rent growth +2.5/5.0
- Condition / age +2.5/5.0
- Schools +1.5/10.0
$155,000
🖨 Deal sheet (PDF) 📄 Offer letter ✓ Due diligence
Listing remarks
1477 sq ft house with recent updated roof, bathroom shower, HVAC, paint, flooring 5 yrs ago. Gravel purchased for a gravel patio. Stove, refrigerator, washer and dryer to remain.
Key facts
- Hvac
- Stove
- Gravel patio
Tags
Neighborhood map
What this means for you Summary
Snapshot
- This is a 3-bed/1.0-bath single-family listed at $155k.
Deal economics
- At list price, monthly cash flow is $47 ($564/yr) — positive.
- The deal already cash-flows at list — no discount required.
- To meet the 1% rule (rent ≥ 1% of price), the offer needs to be $121k (21.7% below list).
- Recommended offer: $121k (21.7% below list) — sets the bar for 1% rule.
Location & tenants
- Location reads 52/100 on livability (#496 in KY) — a working-class tenant base; expect higher turnover. Strengths: cost of living A+; Watch: schools F, amenities F, commute F.
- Carroll County (town): math 12% / reading 23% proficiency, ranked #163 of 165 in KY (top 99%) — low school quality limits family demand, transient renter base, plan for 1-2y turnover.
- Market conditions: 13 active listings in the ZIP; 3 units permitted in Carroll County in 2024 (0 in 5+ unit buildings).
Forward outlook
- Local home prices are declining (-2.7%/yr); year-one equity from $1k of loan paydown is wiped out by about $4k of value loss. Plan a longer hold.
- Carroll County population projected at -15% by 2050 — secular population decline; favor cash flow + early exit over multi-decade hold.
Negotiation context
- It's been on market 83 days — a 6% lower offer ($146k) is reasonable based on typical stale-listing flexibility.
- 2 sale attempts since 6y ago; this cycle's ask has dropped $14k (8%) from the opening price — seller is motivated, your offer sets the floor, not the list.
- Current owner paid $32k; list at $155k implies a 377% gain — meaningful room to come down on a strong offer.
Risks & watch-outs
- Watch-outs: built in 1900 — expect roof / HVAC / electrical / plumbing capex.
- Climate carrying-cost: extreme-heat days projected 7→20/yr by 2055 (HVAC capex compounding) — expect insurance premiums to compound above CPI over the hold.
Questions for the listing agent
- It's been on market 83 days. Have you received any prior offers? Is the seller open to a 22% concession, seller financing, or rate buy-down credit?
- Built in 1900 — when were the roof, HVAC, electrical panel, plumbing, and water heater last replaced?
- Why hasn't it sold? Are there any deal-killer items the seller is aware of (foundation, flood, title, zoning, code violations)?
- Is there a deadline driving the sale (1031 exchange, divorce, estate, relocation)? That informs how much negotiation room exists.
- Schools are F-rated, which usually means shorter tenancies and higher turnover. Who's the typical renter profile here, and what's been the actual vacancy rate?
- The area grade is low — what's the realistic commute time and amenity access for the typical tenant pool here? Any planned neighborhood developments (good or bad) we should know about?
- What's the average days-on-market for RENTAL listings here right now (not sales)? A rising rental-DOM trend means longer vacancies and softer asking-rent achievability than the comps imply.
- What's the recent tenant-quality profile in this submarket — average credit score on applications, eviction rate, late-payment / NSF rate, and stable-employment percentage? A property-management company in the area should have these aggregated.
- How much new for-sale + rental construction is in the pipeline within 1–3 miles? Heavy new supply typically softens prices + rents 12–24 months out; constrained supply supports both.
Investment metrics
- 1% rule
- 0.78% ✗
- Cap rate
- 6.66%
- Cash-on-cash
- 1.30%
- DSCR
- 1.06
- GRM
- 10.6
CMA / ARV
- ARV (on-the-fly)
- $165,432
- Comps found
- 3
Show comp detail 3 sales within ~0.75 mi
| Address | Dist | Beds/Ba | Sqft | Sold | Price | $/sf | Match |
|---|---|---|---|---|---|---|---|
| 72 Simmons St | 0.12mi | 3/2.0 | 1,550 (+6%) | 10mo | $175,000 | $113 | 73 |
| 15 Crescent Ct | 0.49mi | 3/2.0 | 1,350 (-8%) | 12mo | $245,000 | $181 | 50 |
| 26 Eagle Creek Rd | 0.40mi | 3/2.0 | 1,648 (+13%) | 19mo | $172,800 | $105 | 41 |
Match score weights: distance 35% · size 25% · config 20% · recency 20%. Top-matched comps best support the ARV.
Projected returns pro-forma
-2.74% appreciation · 3.0% rent growth · sell at horizon
- IRR
- -12.8%
- Equity multiple
- 0.53×
- Total profit
- $-20,533
- Equity at exit
- $24,888
- IRR
- -4.3%
- Equity multiple
- 0.70×
- Total profit
- $-12,917
- Equity at exit
- $16,474
Cash invested: $43,400 (down + closing). Projections, not guarantees.
Landlord ↔ Tenant lean methodology
- Overall (STATE)
- 83 Strongly Landlord-Friendly
- State Kentucky
- 83 Strongly Landlord-Friendly · R+16
- County
- — inherits STATE
- City
- — inherits STATE
ZIP-level market 41098
- Home prices YoY
- -1.5%
- Active inventory
- 13
- Price-to-rent
- 10.6×
Monthly cashflow live
- Estimated rent
- $1,213 medium interval (Pro) →
- Mortgage (P&I)
- −$813
- Tax from tax record
- −$34 /mo · $410/yr
- Insurance
- −$65
- HOA
- −$0
- Vacancy / Maint / Mgmt
- −$255
- Net cashflow
- $47
Break-even live
Sensitivity live
| Price | -10% $135 | -5% $91 | +0% $47 | +5% $3 | +10% $-41 |
|---|---|---|---|---|---|
| Rent | -10% $-49 | -5% $-1 | +0% $47 | +5% $95 | +10% $143 |
| Rate | -1.0pp $125 | -0.5pp $86 | base $47 | +0.5pp $7 | +1.0pp $-34 |
UW: 25.0% down · 7.5% · 30yr · 1.5% tax · 5.0% vac · 8.0% maint · 8.0% mgmt
Financing live
Cash to close
- Down payment
- $38,750
- Closing costs
- $4,650
- Reserves months
- —
- Total cash needed
- —
Loan-product check · same deal, 3 products live
Conventional
25% down · 7.5% · 30yr
- Down + closing
- —
- Monthly P&I
- —
- Monthly cashflow
- —
- DSCR
- —
- Eligible?
- —
Personal DTI + credit; lowest rate.
DSCR
20% down · 8.5% · 30yr
- Down + closing
- —
- Monthly P&I
- —
- Monthly cashflow
- —
- DSCR
- —
- Eligible?
- —
No personal income docs; deal must DSCR.
Hard money
10% down · 12.0% · 12mo
- Down + closing
- —
- Monthly P&I
- —
- Monthly cashflow
- —
- DSCR
- —
- Eligible?
- —
Short-term bridge; refi at stabilization.
Listing history 7 events
-
2026-03-20status Pending
-
2026-02-10price $155,000
-
2025-12-25$168,500 Active
-
2022-03-28soldstatus $32,500
-
2021-09-20soldstatus $32,000
-
2021-09-20soldstatus $32,000
-
2020-06-30$39,900
ⓘ Source: listings_history table (triggers on properties + properties_extension) + one-shot
backfill from property_details.listing_events for pre-trigger history.
Tax reassessment forecast KY · Resets to sale price
- Current annual tax
- $410 · $34/mo
- Projected year-2 tax
- $1,333 · $111/mo
- Expected delta
- +$923/yr (+$77/mo · 225.5%)
ⓘ Screening estimate from a state-policy table — verify with the county assessor before closing.
Climate risk First Street
- Flood 2/10 Low FEMA zone X (unshaded) · 7% chance over 30 yrs
- Wildfire 4/10 Moderate
- Heat 5/10 Major 7 d/yr ≥104°F today · 20 d/yr by 30 yrs out
- Wind 2/10 Low 100% chance of damaging wind over 30 yrs
- Air quality 2/10 Low 1 unhealthy d/yr today · 2 by 30 yrs out
Nearby sold comps map
Loading sold comps map…
Walkable amenities ~0.75 mi
Loading nearby amenities…
Taxation est. · year 1
- Rental income
- $14,560
- − Mortgage interest
- −$8,682
- − Property taxes
- −$410
- − Insurance
- −$775
- − Repairs & maintenance
- −$1,165
- − Management
- −$1,165
- − Depreciation
- −$4,509
- Taxable loss
- −$2,146
- Est. tax savings @ 24.0%
- +$515
- After-tax cash flow
- $1,079/yr
For passive investors: Depreciation is non-cash, so a rental often shows a tax loss while cash-flowing — sheltering income. Rental losses are passive: they offset passive income freely, and up to $25,000/yr can offset ordinary (W-2) income if you actively participate and your MAGI is under $100k (phasing out to $0 by $150k); unused losses carry forward. On sale, claimed depreciation is recaptured at up to 25%, and gains may owe capital-gains tax (a 1031 exchange can defer both). Figures are a year-1 estimate at your 24.0% rate — not tax advice; consult a CPA.
Schools (NCES district)
- District
- Carroll County
- NCES district ID
- 2100990
- Math proficiency
- 12% ▼ -14.00%
- Reading proficiency
- 23% ▼ -15.00%
- Median HH income
- $41,646
- Composite
- 15.0/100
- National rank
- #9361
- State rank
- #163 of 165 in KY
Livability — Worthville
- Score
- 52/100
- State rank
- #496
- US rank
- #25028
Category grades
Schools grade is shown separately in the Schools card above.
Census & demographics
- Census place
- Worthville, KY
- Population (ZIP)
- 1,138
Population outlook (Carroll County) Hauer SSP2
- Today (2025)
- 10,359 people
- By 2030
- 10,058 · -2.9%
- By 2040
- 9,465 · -8.6%
- By 2050
- 8,788 · -15.2%
- By 2075
- 7,079 · -31.7%
- By 2100
- 5,066 · -51.1%
Race, ethnicity, and origin ACS 2023
- Neighborhood character
- Predominantly White (91%)
- Race & ethnicity
- White 91% Two or more races 9%
- Common ancestry
- Iranian 5% Slovak 4% Italian 4%
Political lean MEDSL · Carroll
- 2024 margin
- Solid R (+51.0) · D 23.9% · R 74.9% · Other 1.2%
- 2008→2024 swing
- -42.7pp toward R · 2008: -8.2pp · 2024: -51.0pp
- All cycles
- 2024: R+51.0 2020: R+44.4 2016: R+38.5 2012: R+10.1 2008: R+8.2
Not yet ingested
- Civics
- —
Market trends
- HPI YoY
- ▼ -2.74%
- Current HPI
- 177.3618
- Rent YoY
- —
- Metro
- —
- State GDP YoY
- ▲ 1.81%
- F500 in state
- 4
Industry mix (Fortune 500 HQ in KY)
| Industry | F500 HQs | Revenue |
|---|---|---|
| Healthcare | 1 | $118B |
|
||
| Food / Beverage | 1 | $7B |
|
||
Price history
+288.5% since first listed7 events — show timeline
- 2026-03-20 Pending — Metro Search MLS
- 2026-02-10 Price Changed $155,000 Metro Search MLS
- 2025-12-25 Listed $168,500 Metro Search MLS
- 2022-03-28 Sold (Public Records) $32,500 Public Records
- 2021-09-20 Sold (Public Records) $32,000 Public Records
- 2021-09-20 Sold (MLS) $32,000 Metro Search MLS
- 2020-06-30 Listed $39,900 Metro Search MLS
Property tax history
+0.4%/yrLatest (2025): $410 · -0.5% YoY. Source: county tax records.
Cash-flow waterfall
monthlySold comps — $/sqft
last 12 mo · ≤1 miLoading sold comps…