 5-Plex
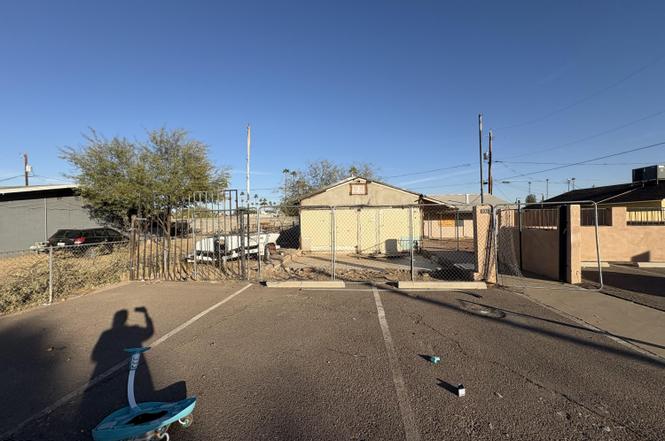
7025 N 66th Dr · Glendale, AZ
Flood risk 1/10 · Minimal
- FEMA flood zone
- X (shaded)
- Chance of flooding over 30 yrs
- 0.0%
- Est. flood insurance / yr
- $507 – $1,088
Fire risk 1/10 · Minimal
- Est. fire insurance / yr
- $610 – $1,132
Heat risk 9/10 · Severe
- Hot days now (above 112°F)
- 7 days/yr
- Hot days in 30 yrs
- 18 days/yr
Wind risk 1/10 · Minimal
- Chance of severe wind over 30 yrs
- —
Air-quality risk 2/10 · Minimal
- Unhealthy air days now
- 0 days/yr
- Unhealthy air days in 30 yrs
- 1 days/yr
Risk factors via First Street. Map © Google.
Why this score? — see what drove the C+ grade
The composite is a weighted blend of 9 inputs, each scored 0–100. Each bar is that input's sub-score; the figure is the points it added to the 100-point composite (weight × sub-score).
- Cash flow +27.2/30.0
- DSCR +9.4/10.0
- ARV discount +7.5/15.0
- 1% rule +6.0/10.0
- Livability +3.8/5.0
- Condition / age +2.5/5.0
- Schools +2.3/10.0
- Rent growth +1.8/5.0
- Appreciation +0.0/10.0
$475,000
🖨 Deal sheet 📄 Offer letter ✓ Due diligence
Multi-family units
County records classify this as Multi-Family (2-4 Unit). Listing-text estimate: 5 units. estimate disagrees with records
Listing remarks
Investment Opportunity! This 5-plex offers a unique blend of potential and affordability. Fire damage has presented the chance to renovate and customize this property to your vision. Featuring spacious 1-bedroom, 1-bathroom units, this property is ideally situated near shopping and public transportation, making it convenient for both residents and investors. Seller estimates $150k cost to rebuild the 2 units and remodel the remaining 3 units. Live in one unit while generating income from the others, or capitalize on the strong rental demand in this desirable location. Don't miss this chance to create a thriving income stream and build your real estate portfolio.
Key facts
- Strong rental demand
- Desirable location
- 4 parking spots
Tags
Property features AI
Finance
- Other: Directions: First street north of Glendale just east of 67th Ave.
- HOA & community: No pool
Exterior
- Parking: 4 total parking spaces; 4 open parking spaces; 1 space per unit
- Utilities: Electric service: SRP; Public sewer; City franchise water
- Home design: Fee simple ownership; One building on the property
- Construction: Painted stucco and block construction; Composition roof
- Exterior features: Painted stucco and block construction; Composition roof; Asphalt road access; Irrigated lot dimensions (IRR)
Interior
- Kitchen: Free-standing range; Refrigerator
- Flooring: Carpet; Vinyl
- Heating & cooling: Window/wall cooling unit; No heating system listed
- Interior features: Free-standing range; Refrigerator
Neighborhood map
What this means for you Summary
Snapshot
- This is a 5 × 2-bed/?-bath units multifamily listed at $475k.
Deal economics
- At list price, monthly cash flow is $1k ($16k/yr) — positive. Per door: $271/mo.
- The deal already cash-flows at list — no discount required.
- Meets the 1% rule at list price ($5k rent vs $475k).
- Recommended offer: $418k (12.0% below list) — sets the bar for market timing.
- Cap rate 9.7% vs local median 3.5% in Glendale — top-decile yield for the area; either an underpriced asset or a hidden risk that comps aren't pricing in. Stress-test before assuming the spread holds.
Location & tenants
- Location reads 76/100 on livability (#12 in AZ, #3,235 nationally) — a middle-class / working-renter tenant base. Strengths: commute A+, housing A+, amenities B; Watch: health & safety D+, crime F.
- Glendale Union High School District (4285) (urban): math 23% / reading 31% proficiency, ranked #130 of 249 in AZ (top 52%) — low school quality limits family demand, transient renter base, plan for 1-2y turnover.
- Market conditions: Rents soft (-3.0%/yr); 215 active listings in the ZIP; 14 comparable units currently listed for rent nearby; rentals at typical pace (median 17d on market — plan ~3-4 weeks tenant-placement turnaround); 36,011 units permitted in Maricopa County in 2024 (12,801 in 5+ unit buildings).
- At $5,241/mo this rent would consume 117% of the median local household income ($54k/yr) (locally 3741% of renters already pay >50% of income on rent) — very limited rent-growth headroom before tenants either downsize or default.
Forward outlook
- Local home prices are declining (-3.0%/yr); year-one equity from $3k of loan paydown is wiped out by about $14k of value loss. Plan a longer hold.
- Maricopa County population projected at +38% by 2050 — long-run rental-demand tailwind backs the buy-and-hold thesis.
Negotiation context
- It's been on market 525 days — a 12% lower offer ($418k) is reasonable based on typical stale-listing flexibility.
- 3 sale attempts; this cycle's ask has dropped $25k (5%) from the opening price — seller is motivated, your offer sets the floor, not the list.
- Current owner paid $260k; list at $475k implies a 83% gain — meaningful room to come down on a strong offer.
Risks & watch-outs
- Watch-outs: built in 1955 — expect roof / HVAC / electrical / plumbing capex.
- Climate carrying-cost: extreme-heat days projected 7→18/yr by 2055 (HVAC capex compounding) — expect insurance premiums to compound above CPI over the hold.
Questions for the listing agent
- It's been on market 525 days. Have you received any prior offers? Is the seller open to a 12% concession, seller financing, or rate buy-down credit?
- Can we see the unit-by-unit rent roll, current vacancy, and any below-market leases? What's the average tenancy length?
- What capital expenditures (roof, boiler, parking lot, exteriors) have been made in the last 5 years, and what's planned in the next 2?
- Built in 1955 — when were the roof, HVAC, electrical panel, plumbing, and water heater last replaced?
- Why hasn't it sold? Are there any deal-killer items the seller is aware of (foundation, flood, title, zoning, code violations)?
- Is there a deadline driving the sale (1031 exchange, divorce, estate, relocation)? That informs how much negotiation room exists.
- Crime grade is F in this area — have there been break-ins, vandalism, or insurance claims at this property in the last 3 years? What carrier currently insures it and at what premium?
- What's the average days-on-market for RENTAL listings here right now (not sales)? A rising rental-DOM trend means longer vacancies and softer asking-rent achievability than the comps imply.
- What's the recent tenant-quality profile in this submarket — average credit score on applications, eviction rate, late-payment / NSF rate, and stable-employment percentage? A property-management company in the area should have these aggregated.
- How much new apartment / multifamily construction is in the pipeline within 1–3 miles? Heavy new supply (>2% of stock underway) typically softens rents 12–24 months out; light construction supports rent growth.
Investment metrics
- 1% rule
- 1.10% ✓
- Cap rate
- 9.71%
- Cash-on-cash
- 12.21%
- DSCR
- 1.54
- GRM
- 7.6
CMA / ARV
No comps found within radius.
Projected returns pro-forma
-3.0% appreciation · 0.0% rent growth · sell at horizon
- IRR
- -1.3%
- Equity multiple
- 0.95×
- Total profit
- $-6,337
- Equity at exit
- $70,824
- IRR
- 5.3%
- Equity multiple
- 1.34×
- Total profit
- $45,227
- Equity at exit
- $41,069
Cash invested: $133,000 (down + closing). Projections, not guarantees.
Landlord ↔ Tenant lean methodology
- Overall (STATE)
- 87 Strongly Landlord-Friendly
- State Arizona
- 87 Strongly Landlord-Friendly · R+3
- County
- — inherits STATE
- City
- — inherits STATE
ZIP-level market 85301
- Home prices YoY
- -10.6%
- Rents YoY
- -3.0%
- Active inventory
- 215
- Price-to-rent
- 37.8×
Monthly cashflow live
- Estimated rent
- $5,241 medium interval (Pro) →
- Mortgage (P&I)
- −$2,491
- Tax from tax record
- −$98 /mo · $1,174/yr
- Insurance
- −$198
- HOA
- −$0
- Vacancy / Maint / Mgmt
- −$1,101
- Net cashflow
- $1,354
Break-even live
5-unit breakdown (identical units grouped — click to expand)
| Units | Beds | Baths | Est. rent |
|---|---|---|---|
| 5× units | 2 | — | $5,240 |
| #1 | 2 | — | $1,048 |
| #2 | 2 | — | $1,048 |
| #3 | 2 | — | $1,048 |
| #4 | 2 | — | $1,048 |
| #5 | 2 | — | $1,048 |
| Total (5 units) | $5,241 | ||
UW: 25.0% down · 7.5% · 30yr · 1.5% tax · 5.0% vac · 8.0% maint · 8.0% mgmt
Financing live
Cash to close
- Down payment
- $118,750
- Closing costs
- $14,250
- Reserves months
- —
- Total cash needed
- —
Loan-product check · same deal, 3 products live
Conventional
25% down · 7.5% · 30yr
- Down + closing
- —
- Monthly P&I
- —
- Monthly cashflow
- —
- DSCR
- —
- Eligible?
- —
Personal DTI + credit; lowest rate.
DSCR
20% down · 8.5% · 30yr
- Down + closing
- —
- Monthly P&I
- —
- Monthly cashflow
- —
- DSCR
- —
- Eligible?
- —
No personal income docs; deal must DSCR.
Hard money
10% down · 12.0% · 12mo
- Down + closing
- —
- Monthly P&I
- —
- Monthly cashflow
- —
- DSCR
- —
- Eligible?
- —
Short-term bridge; refi at stabilization.
Rent comps 14 comps
| Address | Beds | Baths | Sqft | Rent | $/sqft | DOM | Units | Dist |
|---|---|---|---|---|---|---|---|---|
| 6819 N 64th Ave Glendale, AZ | 3.0 | 2.0 | 1568 | $1,500 | $0.96 | 20d | 1 | 0.29mi |
| 6603 N 65th Ave Glendale, AZ | 1.0–4.0 | 1.0–2.0 | 1150 | $1,190 | $1.04 | 1d | 30 | 0.44mi |
| 6526 N 69th Dr Glendale, AZ | 3.0 | 2.0 | 1595 | $2,145 | $1.34 | 24d | 1 | 0.61mi |
| 7255 W Palmaire Ave Glendale, AZ | 3.0 | 2.5 | 2034 | $1,895 | $0.93 | 10d | 1 | 0.74mi |
| 7519 N 59th Ln Glendale, AZ | 3.0 | 2.0 | 1856 | $2,099 | $1.13 | 24d | 1 | 0.96mi |
| 7733 N 60th Ave Glendale, AZ | 3.0 | 2.0 | 1430 | $2,000 | $1.40 | 1d | 1 | 1.05mi |
| 7631 N 59th Ln Glendale, AZ | 3.0 | 1.0 | 1750 | $1,980 | $1.13 | 1d | 1 | 1.07mi |
| 6780 N 74th Dr Glendale, AZ | 3.0 | 2.0 | 1646 | $1,900 | $1.15 | 18d | 1 | 1.07mi |
| 6780 N 74th Dr Glendale, AZ | 3.0 | 2.0 | 1646 | $1,900 | $1.15 | 1d | 1 | 1.07mi |
| 7552 W State Ave Glendale, AZ | 3.0 | 2.0 | 1875 | $2,061 | $1.10 | 24d | 1 | 1.18mi |
| 7668 W Flynn Ln Glendale, AZ | 3.0 | 2.5 | 2178 | $2,196 | $1.01 | 20d | 1 | 1.28mi |
| 6755 W Montebello Ave Glendale, AZ | 3.0 | 2.0 | 1476 | $1,795 | $1.22 | 16d | 1 | 1.33mi |
| 5819 N 59th Dr Glendale, AZ | 3.0 | 3.0 | 1500 | $2,100 | $1.40 | 3d | 1 | 1.37mi |
| 7732 W Ocotillo Rd Glendale, AZ | 3.0 | 2.0 | 1446 | $2,000 | $1.38 | 1d | 1 | 1.40mi |
Listing history 26 events
-
2026-06-18days on market $475,000 Active 525 DOM
-
2026-06-17days on market $475,000 Active 524 DOM
-
2026-06-16days on market $475,000 Active 523 DOM
-
2026-06-15days on market $475,000 Active 522 DOM
-
2026-06-13days on market $475,000 Active 520 DOM
-
2026-06-13days on market $475,000 Active 519 DOM
-
2026-06-09days on market $475,000 Active 516 DOM
-
2026-06-08days on market $475,000 Active 515 DOM
-
2026-06-07days on market $475,000 Active 514 DOM
-
2026-06-04days on market $475,000 Active 511 DOM
-
2026-06-03days on market $475,000 Active 510 DOM
-
2026-06-02days on market $475,000 Active 509 DOM
-
2026-06-01days on market $475,000 Active 508 DOM
-
2026-05-31days on market $475,000 Active 507 DOM
-
2025-12-22price $475,000
-
2025-10-27price $499,999
-
2025-05-27status Active
-
2025-05-22historical Under Contract Accepting Backups
-
2025-02-13status Active
-
2025-02-03historical Under Contract Accepting Backups
-
2025-01-09$500,000 Active
-
2007-01-24soldstatus $260,000
-
2006-04-10soldstatus $260,000
-
2006-01-20soldstatus $260,000
-
1997-12-29soldstatus $78,900
-
1996-02-02soldstatus $26,350
ⓘ Source: listings_history table (triggers on properties + properties_extension) + one-shot
backfill from property_details.listing_events for pre-trigger history.
Tax reassessment forecast AZ · Resets to sale price
- Current annual tax
- $1,174 · $98/mo
- Projected year-2 tax
- $3,135 · $261/mo
- Expected delta
- +$1,961/yr (+$163/mo · 167.1%)
ⓘ Screening estimate from a state-policy table — verify with the county assessor before closing.
Climate risk First Street
- Flood 1/10 Low FEMA zone X (shaded) · 0% chance over 30 yrs
- Wildfire 1/10 Low
- Heat 9/10 Extreme 7 d/yr ≥112°F today · 18 d/yr by 30 yrs out
- Wind 1/10 Low
- Air quality 2/10 Low 0 unhealthy d/yr today · 1 by 30 yrs out
Nearby sold comps map
Loading sold comps map…
Walkable amenities ~0.75 mi
Loading nearby amenities…
Taxation est. · year 1
- Rental income
- $62,892
- − Mortgage interest
- −$26,607
- − Property taxes
- −$1,174
- − Insurance
- −$2,375
- − Repairs & maintenance
- −$5,031
- − Management
- −$5,031
- − Depreciation
- −$13,818
- Taxable income
- $8,855
- Est. tax owed @ 24.0%
- −$2,125
- After-tax cash flow
- $14,119/yr
For passive investors: Depreciation is non-cash, so a rental often shows a tax loss while cash-flowing — sheltering income. Rental losses are passive: they offset passive income freely, and up to $25,000/yr can offset ordinary (W-2) income if you actively participate and your MAGI is under $100k (phasing out to $0 by $150k); unused losses carry forward. On sale, claimed depreciation is recaptured at up to 25%, and gains may owe capital-gains tax (a 1031 exchange can defer both). Figures are a year-1 estimate at your 24.0% rate — not tax advice; consult a CPA.
Schools (NCES district)
- District
- Glendale Union High School District (4285)
- NCES district ID
- 0403450
- Math proficiency
- 23% ▼ -38.00%
- Reading proficiency
- 31% ▼ -19.00%
- Median HH income
- $40,846
- Composite
- 22.81/100
- National rank
- #8020
- State rank
- #130 of 249 in AZ
Livability — Glendale
- Score
- 76/100
- State rank
- #12
- US rank
- #3235
Category grades
Schools grade is shown separately in the Schools card above.
Census & demographics
- Census place
- Glendale, AZ
- County
- Maricopa County · 4,537,380 people
- City population
- 294,586
- Metro
- Phoenix-Mesa-Chandler, AZ
- Population (ZIP)
- 68,178
- Household income
- $53,827
- Rent vs Own
- Severe rent burden
- 3741.0
Population outlook (Maricopa County) Hauer SSP2
- Today (2025)
- 4,979,203 people
- By 2030
- 5,378,229 · +8.0%
- By 2040
- 6,156,598 · +23.6%
- By 2050
- 6,872,376 · +38.0%
- By 2075
- 8,401,270 · +68.7%
- By 2100
- 9,247,439 · +85.7%
Race, ethnicity, and origin ACS 2023
- Neighborhood character
- Majority Hispanic (63%)
- Race & ethnicity
- Hispanic / Latino 63% Two or more races 37% White 22% Black 8% Asian 2% Native American 2%
- Hispanic origin (detail)
- Mexican 57% Cuban 1%
- Common ancestry
- Slovak 1% Italian 1%
- Foreign-born
- 26% · Canada, Vietnam, Philippines
- Languages at home
- 46% English-only · Spanish 48% Arabic 1% Other Indo-European 1%
Political lean MEDSL · Maricopa
- 2024 margin
- Toss-up / Even · D 47.7% · R 51.2% · Other 1.1%
- 2008→2024 swing
- +7.1pp toward D · 2008: -10.6pp · 2024: -3.5pp
- All cycles
- 2024: R+3.5 2020: D+2.2 2016: R+3.5 2012: R+12.0 2008: R+10.6
Not yet ingested
- Civics
- —
Market trends
- HPI YoY
- ▼ -50.49%
- Current HPI
- 427.3069
- Rent YoY
- ▼ -2.98%
- Metro
- Phoenix-Mesa-Chandler, AZ
- State GDP YoY
- ▲ 4.54%
- F500 in state
- 20
Industry mix (Fortune 500 HQ in AZ)
| Industry | F500 HQs | Revenue |
|---|---|---|
| Technology | 2 | $13B |
|
||
| Mining / Metals | 1 | $23B |
|
||
| Environmental Services | 1 | $16B |
|
||
| Metals / Steel | 1 | $14B |
|
||
| Technology Distribution | 1 | $9B |
|
||
| Homebuilding | 1 | $8B |
|
||
Price history
+1702.7% since first listed12 events — show timeline
- 2025-12-22 Price Changed $475,000 ARMLS
- 2025-10-27 Price Changed $499,999 ARMLS
- 2025-05-27 Relisted — ARMLS
- 2025-05-22 Contingent — ARMLS
- 2025-02-13 Relisted — ARMLS
- 2025-02-03 Contingent — ARMLS
- 2025-01-09 Listed $500,000 ARMLS
- 2007-01-24 Sold (Public Records) $260,000 Public Records
- 2006-04-10 Sold (Public Records) $260,000 Public Records
- 2006-01-20 Sold (Public Records) $260,000 Public Records
- 1997-12-29 Sold (Public Records) $78,900 Public Records
- 1996-02-02 Sold (Public Records) $26,350 Public Records
Property tax history
-2.9%/yrLatest (2025): $1,174 · +3.9% YoY. Source: county tax records.
Cash-flow waterfall
monthlySold comps — $/sqft
last 12 mo · ≤1 miLoading sold comps…