2156 Bethlehem Rd · Cottondale, FL
Flood risk 1/10 · Minimal
- FEMA flood zone
- X (unshaded)
- Chance of flooding over 30 yrs
- 0.0%
- Est. flood insurance / yr
- $507 – $1,088
Fire risk 6/10 · Moderate
- Est. fire insurance / yr
- $947 – $1,759
Heat risk 8/10 · Major
- Hot days now (above 108°F)
- 7 days/yr
- Hot days in 30 yrs
- 19 days/yr
Wind risk 9/10 · Severe
- Chance of severe wind over 30 yrs
- 99.0%
Air-quality risk 3/10 · Minor
- Unhealthy air days now
- 3 days/yr
- Unhealthy air days in 30 yrs
- 4 days/yr
Risk factors via First Street. Map © Google.
Why this score? — see what drove the D grade
The composite is a weighted blend of 9 inputs, each scored 0–100. Each bar is that input's sub-score; the figure is the points it added to the 100-point composite (weight × sub-score).
- Appreciation +10.0/10.0
- Cash flow +8.0/30.0
- ARV discount +7.5/15.0
- Schools +4.2/10.0
- Livability +3.2/5.0
- Rent growth +2.5/5.0
- Condition / age +2.5/5.0
- DSCR +2.1/10.0
- 1% rule +1.3/10.0
$189,900
🖨 Deal sheet (PDF) 📄 Offer letter ✓ Due diligence
Listing remarks
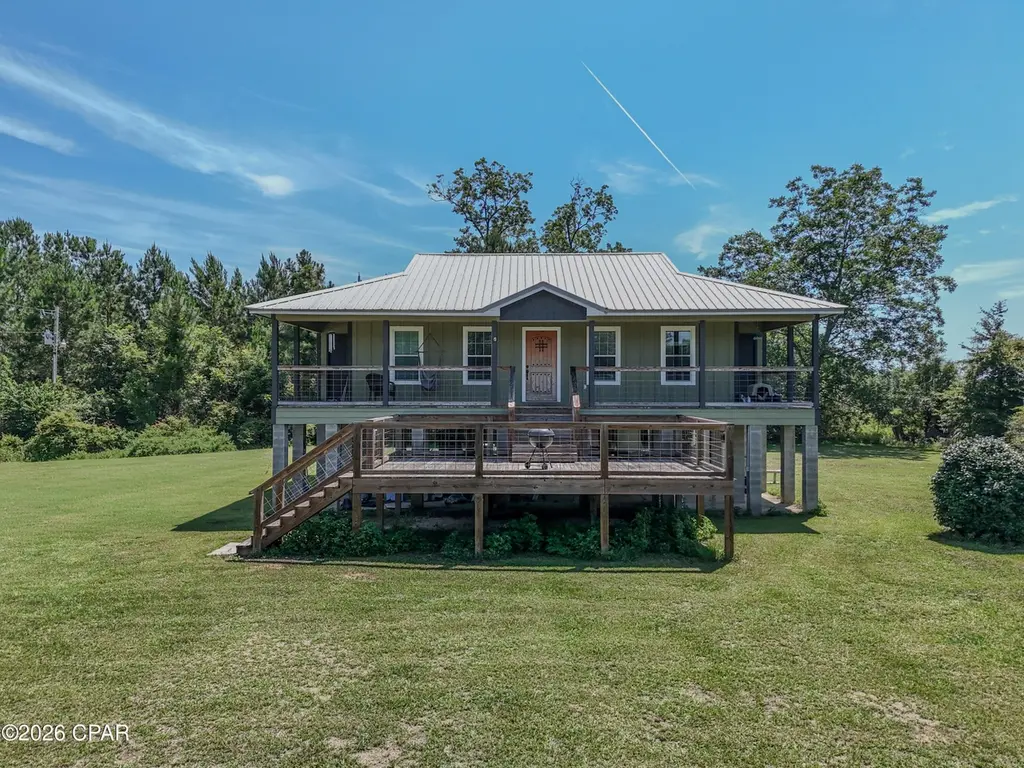
Coastal feel in the Country! This 3 Bedroom 2 Bath pier and beam home resting on a gorgeous acre in southern Jackson County, offers a Coastal Flare combined with Southern Charm. Outside, the pier and beam construction elevates the home to make way for the large open and covered deck system, and gives the owners the ability to utilize the ground floor for storage, or for later enclosure and addition. Inside, the home offers rustic tongue and groove walls, wood trim finishes, and that cozy county feel. The living kitchen, and dining areas flow openly and together, making family time a breeze. The master suite offers plenty of room for large furnishings and has a large walk-in closet for cl
Key facts
- Wood trim finishes
- Walk-in shower
- Large walk-in closet
Tags
Property features AI
Exterior
- Parking: 2 covered parking spaces
- Utilities: Electricity available
- Home design: Single-family zoning (county, residential); Pillar/post/pier foundation
- Construction: Metal roof; HardiPlank-type siding
- Exterior features: Covered patio; Deck; Partial fencing; Paved lot
Interior
- Kitchen: Electric range
- Bedrooms: Multiple bedrooms including a primary bedroom (room sizes include: 12 x 12, 12 x 12, 14 x 12, 10 x 8)
- Bathrooms: Two full bathrooms
- Heating & cooling: Central heating; Electric heating; Fireplace heating; Central air conditioning; Ceiling fans
- Interior features: Gas fireplace
- Laundry & utility: Electric water heater
Neighborhood map
What this means for you Summary
Snapshot
- This is a 3-bed/2.0-bath single-family listed at $190k.
Deal economics
- At list price, monthly cash flow is $-190 ($-2k/yr) — negative.
- To cash-flow at today's rent, offer at most $156k (17.7% below list).
- To meet the 1% rule (rent ≥ 1% of price), the offer needs to be $119k (37.4% below list).
- Recommended offer: $119k (37.4% below list) — sets the bar for 1% rule.
Location & tenants
- Location reads 65/100 on livability (#649 in FL) — a middle-class / working-renter tenant base. Strengths: cost of living A+, housing A; Watch: crime D+, health & safety D, amenities F.
- Jackson (rural): math 47% / reading 54% proficiency, ranked #39 of 73 in FL (top 53%) — acceptable for families but not a draw, mixed tenant base, ~2y average lease.
- Zoned schools: Grand Ridge School (math 55% / reading 54%, grade B-, #183 of 571 statewide, top 34%, 326 students, 50% FRL).
- Market conditions: 45 active listings in the ZIP; 153 units permitted in Jackson County in 2024 (40 in 5+ unit buildings).
Forward outlook
- In year one you build about $20k of equity ($1k loan paydown + $19k appreciation (10.0% local appreciation)).
- Jackson County population projected at -18% by 2050 — secular population decline; favor cash flow + early exit over multi-decade hold.
- By year 2, paydown + projected appreciation supports a ~$33k cash-out refi (75% LTV) — recoverable capital for the next deal without selling this one.
Negotiation context
- Only 12 days on market — expect competitive offers; lowballing is unlikely to land.
Risks & watch-outs
- Climate carrying-cost: severe wind risk, 99% chance of damaging wind over 30y; major wildfire risk; extreme-heat days projected 7→19/yr by 2055 (HVAC capex compounding) — expect insurance premiums to compound above CPI over the hold.
Questions for the listing agent
- What do current leases actually rent for vs. the listed asking? Can we see a recent rent roll and the last 12 months of T-12 income?
- Is there a deadline driving the sale (1031 exchange, divorce, estate, relocation)? That informs how much negotiation room exists.
- Crime grade is D in this area — have there been break-ins, vandalism, or insurance claims at this property in the last 3 years? What carrier currently insures it and at what premium?
- The area grade is low — what's the realistic commute time and amenity access for the typical tenant pool here? Any planned neighborhood developments (good or bad) we should know about?
- What's the average days-on-market for RENTAL listings here right now (not sales)? A rising rental-DOM trend means longer vacancies and softer asking-rent achievability than the comps imply.
- What's the recent tenant-quality profile in this submarket — average credit score on applications, eviction rate, late-payment / NSF rate, and stable-employment percentage? A property-management company in the area should have these aggregated.
- How much new for-sale + rental construction is in the pipeline within 1–3 miles? Heavy new supply typically softens prices + rents 12–24 months out; constrained supply supports both.
Investment metrics
- 1% rule
- 0.63% ✗
- Cap rate
- 5.09%
- Cash-on-cash
- -4.29%
- DSCR
- 0.81
- GRM
- 13.3
CMA / ARV
No comps found within radius.
Projected returns pro-forma
10.0% appreciation · 3.0% rent growth · sell at horizon
- IRR
- 21.2%
- Equity multiple
- 2.72×
- Total profit
- $91,221
- Equity at exit
- $171,077
- IRR
- 19.2%
- Equity multiple
- 6.23×
- Total profit
- $277,966
- Equity at exit
- $368,934
Cash invested: $53,172 (down + closing). Projections, not guarantees.
Landlord ↔ Tenant lean methodology
- Overall (STATE)
- 87 Strongly Landlord-Friendly
- State Florida
- 87 Strongly Landlord-Friendly · R+3
- County
- — inherits STATE
- City
- — inherits STATE
ZIP-level market 32431
- Home prices YoY
- 7.3%
- Active inventory
- 45
- Price-to-rent
- 13.3×
Monthly cashflow live
- Estimated rent
- $1,189 medium interval (Pro) →
- Mortgage (P&I)
- −$996
- Tax from tax record
- −$54 /mo · $652/yr
- Insurance
- −$79
- HOA
- −$0
- Vacancy / Maint / Mgmt
- −$250
- Net cashflow
- $-190
Break-even live
Sensitivity live
| Price | -10% $-83 | -5% $-136 | +0% $-190 | +5% $-244 | +10% $-298 |
|---|---|---|---|---|---|
| Rent | -10% $-284 | -5% $-237 | +0% $-190 | +5% $-143 | +10% $-96 |
| Rate | -1.0pp $-94 | -0.5pp $-142 | base $-190 | +0.5pp $-239 | +1.0pp $-289 |
UW: 25.0% down · 7.5% · 30yr · 1.5% tax · 5.0% vac · 8.0% maint · 8.0% mgmt
Financing live
Cash to close
- Down payment
- $47,475
- Closing costs
- $5,697
- Reserves months
- —
- Total cash needed
- —
Loan-product check · same deal, 3 products live
Conventional
25% down · 7.5% · 30yr
- Down + closing
- —
- Monthly P&I
- —
- Monthly cashflow
- —
- DSCR
- —
- Eligible?
- —
Personal DTI + credit; lowest rate.
DSCR
20% down · 8.5% · 30yr
- Down + closing
- —
- Monthly P&I
- —
- Monthly cashflow
- —
- DSCR
- —
- Eligible?
- —
No personal income docs; deal must DSCR.
Hard money
10% down · 12.0% · 12mo
- Down + closing
- —
- Monthly P&I
- —
- Monthly cashflow
- —
- DSCR
- —
- Eligible?
- —
Short-term bridge; refi at stabilization.
Listing history 10 events
-
2026-06-21statusdays on market $189,900 Pending 12 DOM
-
2026-06-21days on market $189,900 Active 11 DOM
-
2026-06-18days on market $189,900 Active 9 DOM
-
2026-06-17days on market $189,900 Active 8 DOM
-
2026-06-16days on market $189,900 Active 7 DOM
-
2026-06-15days on market $189,900 Active 6 DOM
-
2026-06-13days on market $189,900 Active 4 DOM
-
2026-06-12days on market $189,900 Active 3 DOM
-
2026-06-09remarks 699-char remark
-
2026-06-09$189,900 Active 1 DOM
ⓘ Source: listings_history table (triggers on properties + properties_extension) + one-shot
backfill from property_details.listing_events for pre-trigger history.
Tax reassessment forecast FL · Resets to sale price
- Current annual tax
- $652 · $54/mo
- Projected year-2 tax
- $1,576 · $131/mo
- Expected delta
- +$924/yr (+$77/mo · 141.8%)
ⓘ Screening estimate from a state-policy table — verify with the county assessor before closing.
Climate risk First Street
- Flood 1/10 Low FEMA zone X (unshaded) · 0% chance over 30 yrs
- Wildfire 6/10 Major
- Heat 8/10 Severe 7 d/yr ≥108°F today · 19 d/yr by 30 yrs out
- Wind 9/10 Extreme 99% chance of damaging wind over 30 yrs
- Air quality 3/10 Moderate 3 unhealthy d/yr today · 4 by 30 yrs out
Nearby sold comps map
Loading sold comps map…
Walkable amenities ~0.75 mi
Loading nearby amenities…
Taxation est. · year 1
- Rental income
- $14,266
- − Mortgage interest
- −$10,637
- − Property taxes
- −$652
- − Insurance
- −$950
- − Repairs & maintenance
- −$1,141
- − Management
- −$1,141
- − Depreciation
- −$5,524
- Taxable loss
- −$5,780
- Est. tax savings @ 24.0%
- +$1,387
- After-tax cash flow
- $-894/yr
For passive investors: Depreciation is non-cash, so a rental often shows a tax loss while cash-flowing — sheltering income. Rental losses are passive: they offset passive income freely, and up to $25,000/yr can offset ordinary (W-2) income if you actively participate and your MAGI is under $100k (phasing out to $0 by $150k); unused losses carry forward. On sale, claimed depreciation is recaptured at up to 25%, and gains may owe capital-gains tax (a 1031 exchange can defer both). Figures are a year-1 estimate at your 24.0% rate — not tax advice; consult a CPA.
Schools (NCES district)
- District
- Jackson
- NCES district ID
- 1200960
- Math proficiency
- 47% ▼ -9.00%
- Reading proficiency
- 54% ▼ -3.00%
- Median HH income
- $36,824
- Composite
- 41.92/100
- National rank
- #3358
- State rank
- #39 of 73 in FL
Livability — Cottondale
- Score
- 65/100
- State rank
- #649
- US rank
- #12805
Category grades
Schools grade is shown separately in the Schools card above.
Census & demographics
- Population (ZIP)
- 4,887
Population outlook (Jackson County) Hauer SSP2
- Today (2025)
- 46,095 people
- By 2030
- 44,432 · -3.6%
- By 2040
- 41,077 · -10.9%
- By 2050
- 37,587 · -18.5%
- By 2075
- 28,921 · -37.3%
- By 2100
- 19,332 · -58.1%
Race, ethnicity, and origin ACS 2023
- Neighborhood character
- Predominantly White (80%)
- Race & ethnicity
- White 80% Black 16% Two or more races 4%
- Common ancestry
- Hispanic 4% Serbian 2% Slovak 2%
- Foreign-born
- 2% · Canada
- Languages at home
- 98% English-only · French/Haitian/Cajun 1% Spanish 1%
Political lean MEDSL · Jackson
- 2024 margin
- Solid R (+46.1) · D 26.7% · R 72.7%
- 2008→2024 swing
- -18.0pp toward R · 2008: -28.0pp · 2024: -46.1pp
- All cycles
- 2024: R+46.1 2020: R+38.9 2016: R+37.4 2012: R+29.0 2008: R+28.0
Not yet ingested
- Civics
- —
Market trends
- HPI YoY
- ▲ 14.20%
- Current HPI
- 208.19
- Rent YoY
- —
- Metro
- —
- State GDP YoY
- ▲ 3.28%
- F500 in state
- 36
Industry mix (Fortune 500 HQ in FL)
| Industry | F500 HQs | Revenue |
|---|---|---|
| Industrial Technology | 2 | $29B |
|
||
| Insurance | 2 | $17B |
|
||
| Retail | 1 | $60B |
|
||
| Technology Distribution | 1 | $58B |
|
||
| Homebuilding | 1 | $35B |
|
||
| Technology Manufacturing | 1 | $35B |
|
||
Price history
1 event — show timeline
- 2026-06-05 Listed $189,900 CPARMLS
Property tax history
+1.5%/yrLatest (2025): $652 · +4.1% YoY. Source: county tax records.
Cash-flow waterfall
monthlySold comps — $/sqft
last 12 mo · ≤1 miLoading sold comps…