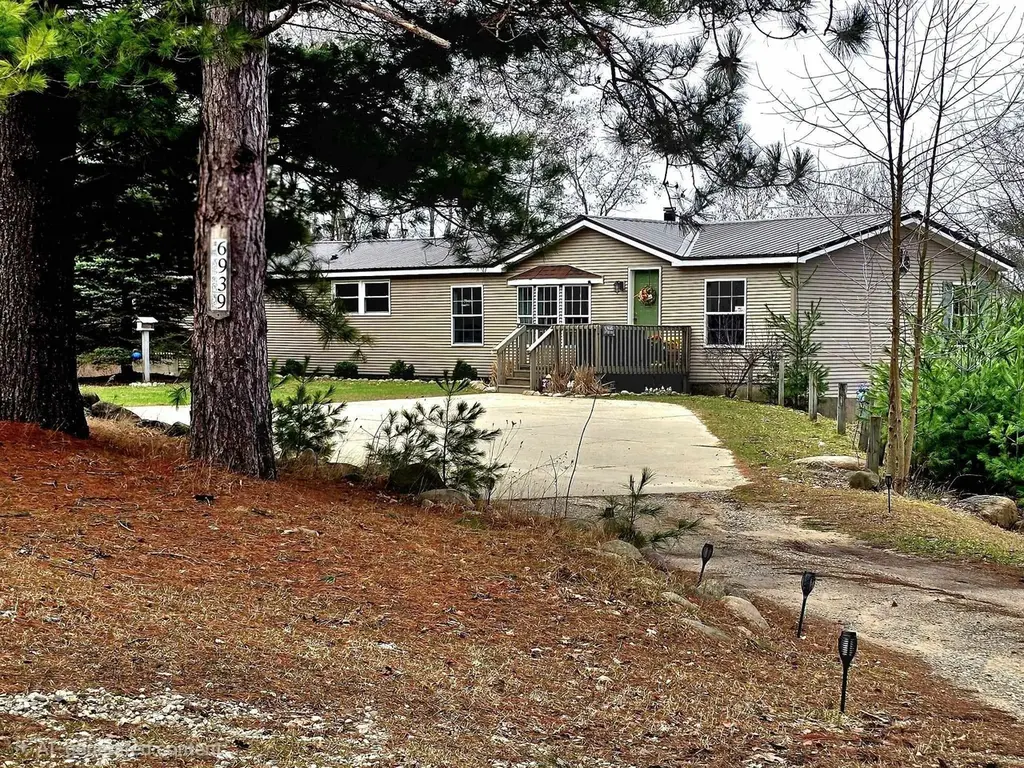
6939 170th Ave · Stanwood, MI
Flood risk 1/10 · Minimal
- FEMA flood zone
- X (unshaded)
- Chance of flooding over 30 yrs
- 0.0%
- Est. flood insurance / yr
- $473 – $860
Fire risk 3/10 · Minor
- Est. fire insurance / yr
- $784 – $1,456
Heat risk 2/10 · Minimal
- Hot days now (above 95°F)
- 7 days/yr
- Hot days in 30 yrs
- 15 days/yr
Wind risk 1/10 · Minimal
- Chance of severe wind over 30 yrs
- —
Air-quality risk 2/10 · Minimal
- Unhealthy air days now
- 0 days/yr
- Unhealthy air days in 30 yrs
- 1 days/yr
Risk factors via First Street. Map © Google.
Why this score? — see what drove the D- grade
The composite is a weighted blend of 9 inputs, each scored 0–100. Each bar is that input's sub-score; the figure is the points it added to the 100-point composite (weight × sub-score).
- Cash flow +10.5/30.0
- ARV discount +6.7/15.0
- Appreciation +5.0/10.0
- 1% rule +3.1/10.0
- DSCR +3.0/10.0
- Livability +2.9/5.0
- Rent growth +2.5/5.0
- Condition / age +2.5/5.0
- Schools +2.4/10.0
$340,000
🖨 Deal sheet 📄 Offer letter ✓ Due diligence
Listing remarks
Here is your opportunity to own this beautifully maintained 5-bedroom, 3 full bath ranch nestled on 5 private wooded acres with peaceful countryside views from nearly every window. This spacious home features an open and inviting layout, two wood-burning fireplaces, and central air for year-round comfort. The primary suite offers a private en suite bath with granite vanity and a large walk-in closet. Enjoy outdoor living on the decks off both the dining room and primary bedroom that are overlooking a serene wooded setting. The backyard is partially cleared, making it ideal for entertaining. The full walkout basement with daylight window and two sets of sliders provides endless potential and
Key facts
- Private wooded acres
- Countryside views
- Large walk-in closet
Tags
Property features AI
Finance
- Other: Approximately 5 acres
Exterior
- Utilities: Private well water; Septic system; LP/propane gas fuel
- Home design: Residential property; Manufactured home; Single-story (1 story); Built in 1998; Faces unspecified
- Construction: Vinyl siding; Basement with egress/daylight windows, full, walk-out, poured foundation, unfinished
- Exterior features: Deck; Corner lot; Rolling/hilly terrain; Wooded setting
Interior
- Kitchen: Dishwasher; Range/oven; Refrigerator; Kitchen roughly 20 x 15
- Bedrooms: Main-level bedroom; Bedroom dimensions approximately 22 x 15, 15 x 14, and 13' (width)
- Bathrooms: Three full bathrooms; Primary bathroom included
- Heating & cooling: Forced air heating; Central air conditioning
- Interior features: Fireplace; Walk-in closet
- Laundry & utility: Main-level laundry
Neighborhood map
What this means for you Summary
Snapshot
- This is a 5-bed/3.0-bath single-family listed at $340k.
Deal economics
- At list price, monthly cash flow is $-173 ($-2k/yr) — negative.
- To cash-flow at today's rent, offer at most $315k (7.3% below list).
- To meet the 1% rule (rent ≥ 1% of price), the offer needs to be $276k (18.9% below list).
- Recommended offer: $276k (18.9% below list) — sets the bar for 1% rule.
Location & tenants
- Location reads 57/100 on livability (#654 in MI) — a working-class tenant base; expect higher turnover. Strengths: cost of living A+, housing A+; Watch: schools F, crime F, amenities F.
- Morley Stanwood Community Schools (rural): math 24% / reading 33% proficiency, ranked #390 of 540 in MI (top 72%) — low school quality limits family demand, transient renter base, plan for 1-2y turnover.
- Market conditions: 27 active listings in the ZIP; 116 units permitted in Mecosta County in 2024 (0 in 5+ unit buildings).
Forward outlook
- In year one you build about $3k of equity ($2k loan paydown + $318 appreciation (0.1% local appreciation)).
- Mecosta County population projected to shrink 9% by 2050 — rents likely to lag national; underwrite the cash flow, not the appreciation.
- By year 9, paydown + projected appreciation supports a ~$31k cash-out refi (75% LTV) — recoverable capital for the next deal without selling this one.
Negotiation context
- It's been on market 33 days — a 3% lower offer ($330k) is reasonable based on typical stale-listing flexibility.
- 15 sale attempts since 9y ago with the ask held roughly flat each time — persistent listings suggest the price (not the market) is what's stuck; bring a comps-based counter.
- Current owner paid $278k; 23% above their basis — modest negotiation headroom, anchor on the comps not their cost.
Questions for the listing agent
- What do current leases actually rent for vs. the listed asking? Can we see a recent rent roll and the last 12 months of T-12 income?
- It's been on market 33 days. Have you received any prior offers? Is the seller open to a 19% concession, seller financing, or rate buy-down credit?
- Is there a deadline driving the sale (1031 exchange, divorce, estate, relocation)? That informs how much negotiation room exists.
- Schools are F-rated, which usually means shorter tenancies and higher turnover. Who's the typical renter profile here, and what's been the actual vacancy rate?
- Crime grade is F in this area — have there been break-ins, vandalism, or insurance claims at this property in the last 3 years? What carrier currently insures it and at what premium?
- The area grade is low — what's the realistic commute time and amenity access for the typical tenant pool here? Any planned neighborhood developments (good or bad) we should know about?
- What's the average days-on-market for RENTAL listings here right now (not sales)? A rising rental-DOM trend means longer vacancies and softer asking-rent achievability than the comps imply.
- What's the recent tenant-quality profile in this submarket — average credit score on applications, eviction rate, late-payment / NSF rate, and stable-employment percentage? A property-management company in the area should have these aggregated.
- How much new for-sale + rental construction is in the pipeline within 1–3 miles? Heavy new supply typically softens prices + rents 12–24 months out; constrained supply supports both.
Investment metrics
- 1% rule
- 0.81% ✗
- Cap rate
- 5.68%
- Cash-on-cash
- -2.18%
- DSCR
- 0.90
- GRM
- 10.3
CMA / ARV
- ARV (on-the-fly)
- $334,176
- Comps found
- 2
Show comp detail 2 sales within ~0.75 mi
| Address | Dist | Beds/Ba | Sqft | Sold | Price | $/sf | Match |
|---|---|---|---|---|---|---|---|
| 6939 170th Ave | 0.00mi | 5/3.0 | 1,888 (0%) | 1mo | $335,000 | $177 | 100 |
| 6939 170th Ave | 0.00mi | 5/3.0 | 1,888 (0%) | 1mo | $335,000 | $177 | 99 |
Match score weights: distance 35% · size 25% · config 20% · recency 20%. Top-matched comps best support the ARV.
Projected returns pro-forma
0.09% appreciation · 3.0% rent growth · sell at horizon
- IRR
- -4.3%
- Equity multiple
- 0.80×
- Total profit
- $-19,397
- Equity at exit
- $100,318
- IRR
- 1.5%
- Equity multiple
- 1.16×
- Total profit
- $15,429
- Equity at exit
- $121,865
Cash invested: $95,200 (down + closing). Projections, not guarantees.
Landlord ↔ Tenant lean methodology
- Overall (STATE)
- 62 Landlord-Friendly
- State Michigan
- 62 Landlord-Friendly · EVEN
- County
- — inherits STATE
- City
- — inherits STATE
ZIP-level market 49326
- Home prices YoY
- 0.0%
- Active inventory
- 27
- Price-to-rent
- 10.3×
Monthly cashflow live
- Estimated rent
- $2,756 medium interval (Pro) →
- Mortgage (P&I)
- −$1,783
- Tax est. 1.5%
- −$425 /mo · $5,100/yr
- Insurance
- −$142
- HOA
- −$0
- Vacancy / Maint / Mgmt
- −$579
- Net cashflow
- $-173
Break-even live
UW: 25.0% down · 7.5% · 30yr · 1.5% tax · 5.0% vac · 8.0% maint · 8.0% mgmt
Financing live
Cash to close
- Down payment
- $85,000
- Closing costs
- $10,200
- Reserves months
- —
- Total cash needed
- —
Loan-product check · same deal, 3 products live
Conventional
25% down · 7.5% · 30yr
- Down + closing
- —
- Monthly P&I
- —
- Monthly cashflow
- —
- DSCR
- —
- Eligible?
- —
Personal DTI + credit; lowest rate.
DSCR
20% down · 8.5% · 30yr
- Down + closing
- —
- Monthly P&I
- —
- Monthly cashflow
- —
- DSCR
- —
- Eligible?
- —
No personal income docs; deal must DSCR.
Hard money
10% down · 12.0% · 12mo
- Down + closing
- —
- Monthly P&I
- —
- Monthly cashflow
- —
- DSCR
- —
- Eligible?
- —
Short-term bridge; refi at stabilization.
Listing history 33 events
-
2026-05-04status Pending
-
2026-04-20historical Accepting Backup Offers
-
2026-04-14price $340,000
-
2026-03-31$349,900 Active
-
2022-09-22soldstatus $277,500
-
2022-02-07historical
-
2022-02-07historical
-
2022-02-06historical
-
2022-02-05historical
-
2022-02-05historical
-
2021-12-27$150,000 Active
-
2021-12-27$150,000
-
2021-12-27$150,000
-
2021-12-27$150,000 Active
-
2021-12-27$150,000 Active
-
2018-05-16soldstatus $115,000
-
2018-05-16soldstatus $115,000 Sold
-
2018-05-16soldstatus $115,000
-
2018-05-16soldstatus $115,000
-
2018-04-23status Pending
-
2018-04-09$115,000
-
2018-04-09$115,000 Active
-
2018-04-09$115,000
-
2018-04-09$115,000
-
2018-01-11historical
-
2018-01-11historical
-
2018-01-03$63,500
-
2018-01-03$63,500
-
2018-01-03$63,500 Active
-
2017-09-11historical
-
2017-09-10historical
-
2017-07-21$99,900 Active
-
2017-07-12$99,900
ⓘ Source: listings_history table (triggers on properties + properties_extension) + one-shot
backfill from property_details.listing_events for pre-trigger history.
Climate risk First Street
- Flood 1/10 Low FEMA zone X (unshaded) · 0% chance over 30 yrs
- Wildfire 3/10 Moderate
- Heat 2/10 Low 7 d/yr ≥95°F today · 15 d/yr by 30 yrs out
- Wind 1/10 Low
- Air quality 2/10 Low 0 unhealthy d/yr today · 1 by 30 yrs out
Nearby sold comps map
Loading sold comps map…
Walkable amenities ~0.75 mi
Loading nearby amenities…
Taxation est. · year 1
- Rental income
- $33,070
- − Mortgage interest
- −$19,045
- − Property taxes
- −$5,100
- − Insurance
- −$1,700
- − Repairs & maintenance
- −$2,646
- − Management
- −$2,646
- − Depreciation
- −$9,891
- Taxable loss
- −$7,957
- Est. tax savings @ 24.0%
- +$1,910
- After-tax cash flow
- $-161/yr
For passive investors: Depreciation is non-cash, so a rental often shows a tax loss while cash-flowing — sheltering income. Rental losses are passive: they offset passive income freely, and up to $25,000/yr can offset ordinary (W-2) income if you actively participate and your MAGI is under $100k (phasing out to $0 by $150k); unused losses carry forward. On sale, claimed depreciation is recaptured at up to 25%, and gains may owe capital-gains tax (a 1031 exchange can defer both). Figures are a year-1 estimate at your 24.0% rate — not tax advice; consult a CPA.
Schools (NCES district)
- District
- Morley Stanwood Community Schools
- NCES district ID
- 2624600
- Math proficiency
- 24% ▼ -1.00%
- Reading proficiency
- 33% ▲ 1.00%
- Median HH income
- $40,617
- Composite
- 24.03/100
- National rank
- #7769
- State rank
- #390 of 540 in MI
Livability — Stanwood
- Score
- 57/100
- State rank
- #654
- US rank
- #22265
Category grades
Schools grade is shown separately in the Schools card above.
Census & demographics
- Population (ZIP)
- 4,126
Population outlook (Mecosta County) Hauer SSP2
- Today (2025)
- 42,954 people
- By 2030
- 42,954 · +0.0%
- By 2040
- 41,574 · -3.2%
- By 2050
- 39,250 · -8.6%
- By 2075
- 32,628 · -24.0%
- By 2100
- 27,476 · -36.0%
Race, ethnicity, and origin ACS 2023
- Neighborhood character
- Predominantly White (94%)
- Race & ethnicity
- White 94% Hispanic / Latino 5%
- Common ancestry
- Iranian 10% Romanian 3% Lithuanian 3%
- Foreign-born
- 0% · China
- Languages at home
- 96% English-only · Spanish 4%
Political lean MEDSL · Mecosta
- 2024 margin
- Solid R (+30.0) · D 34.2% · R 64.2% · Other 1.6%
- 2008→2024 swing
- -29.3pp toward R · 2008: -0.7pp · 2024: -30.0pp
- All cycles
- 2024: R+30.0 2020: R+28.0 2016: R+26.1 2012: R+9.8 2008: R+0.7
Not yet ingested
- Civics
- —
Market trends
- HPI YoY
- ▲ 0.09%
- Current HPI
- 379.9632
- Rent YoY
- —
- Metro
- —
- State GDP YoY
- ▲ 1.37%
- F500 in state
- 28
Industry mix (Fortune 500 HQ in MI)
| Industry | F500 HQs | Revenue |
|---|---|---|
| Automotive Parts | 3 | $48B |
|
||
| Automotive | 2 | $372B |
|
||
| Chemicals | 1 | $45B |
|
||
| Automotive Retail | 1 | $29B |
|
||
| Healthcare / Medical Devices | 1 | $23B |
|
||
| Automotive Technology | 1 | $20B |
|
||
Price history
+240.3% since first listed33 events — show timeline
- 2026-05-04 Pending — MiRealSource-MiMLS
- 2026-04-20 Contingent — MiRealSource-MiMLS
- 2026-04-14 Price Changed $340,000 MiRealSource-MiMLS
- 2026-03-31 Listed $349,900 MiRealSource-MiMLS
- 2022-09-22 Sold (Public Records) $277,500 Public Records
- 2022-02-07 Listing Removed — MiRealSource-MiMLS
- 2022-02-07 Listing Removed — REALCOMP
- 2022-02-06 Listing Removed — REALCOMP
- 2022-02-05 Listing Removed — SW Michigan MLS
- 2022-02-05 Listing Removed — MiRealSource-MiMLS
- 2021-12-27 Listed $150,000 SW Michigan MLS
- 2021-12-27 Listed $150,000 MiRealSource-MiMLS
- 2021-12-27 Listed $150,000 MiRealSource-MiMLS
- 2021-12-27 Listed $150,000 REALCOMP
- 2021-12-27 Listed $150,000 REALCOMP
- 2018-05-16 Sold (Public Records) $115,000 Public Records
- 2018-05-16 Sold (MLS) $115,000 MiRealSource-MiMLS
- 2018-05-16 Sold (MLS) $115,000 SW Michigan MLS
- 2018-05-16 Sold (MLS) $115,000 REALCOMP
- 2018-04-23 Pending — SW Michigan MLS
- 2018-04-09 Listed $115,000 MiRealSource-MiMLS
- 2018-04-09 Listed $115,000 MiRealSource-MiMLS
- 2018-04-09 Listed $115,000 SW Michigan MLS
- 2018-04-09 Listed $115,000 REALCOMP
- 2018-01-11 Listing Removed — SW Michigan MLS
- 2018-01-11 Listing Removed — MiRealSource-MiMLS
- 2018-01-03 Listed $63,500 SW Michigan MLS
- 2018-01-03 Listed $63,500 MiRealSource-MiMLS
- 2018-01-03 Listed $63,500 REALCOMP
- 2017-09-11 Listing Removed — REALCOMP
- 2017-09-10 Listing Removed — MiRealSource-MiMLS
- 2017-07-21 Listed $99,900 REALCOMP
- 2017-07-12 Listed $99,900 MiRealSource-MiMLS
Cash-flow waterfall
monthlySold comps — $/sqft
last 12 mo · ≤1 miLoading sold comps…