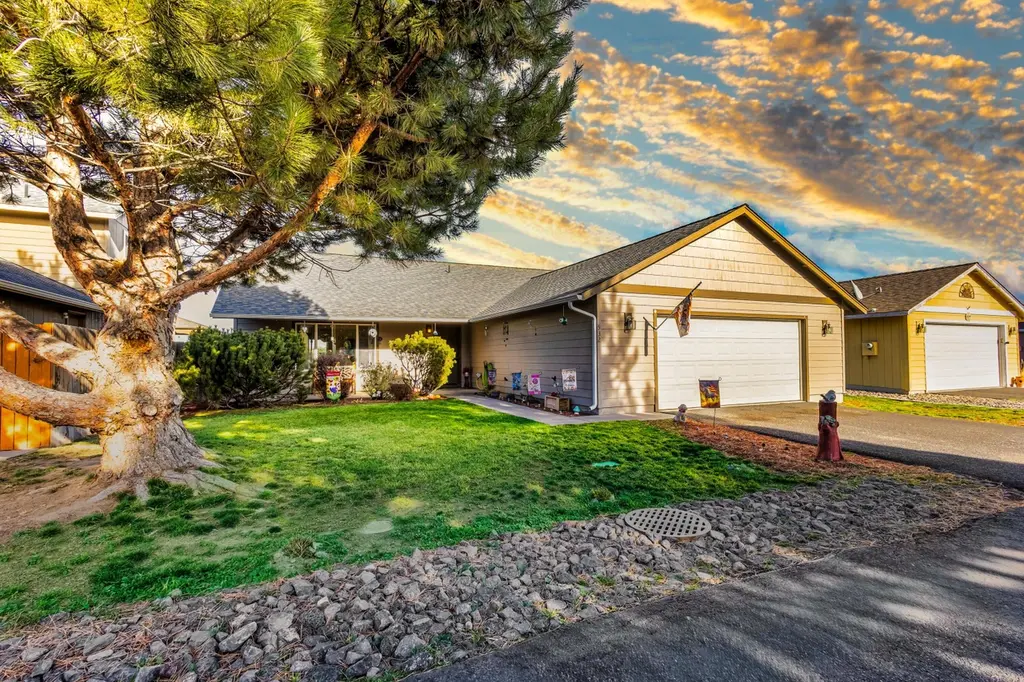
532 SE Ponderosa Dr · Madras, OR
Flood risk 1/10 · Minimal
- FEMA flood zone
- X (shaded)
- Chance of flooding over 30 yrs
- 0.0%
- Est. flood insurance / yr
- $507 – $1,088
Fire risk 7/10 · Major
- Est. fire insurance / yr
- $498 – $926
Heat risk 4/10 · Minor
- Hot days now (above 95°F)
- 7 days/yr
- Hot days in 30 yrs
- 15 days/yr
Wind risk 1/10 · Minimal
- Chance of severe wind over 30 yrs
- —
Air-quality risk 10/10 · Severe
- Unhealthy air days now
- 18 days/yr
- Unhealthy air days in 30 yrs
- 22 days/yr
Risk factors via First Street. Map © Google.
Why this score? — see what drove the D- grade
The composite is a weighted blend of 9 inputs, each scored 0–100. Each bar is that input's sub-score; the figure is the points it added to the 100-point composite (weight × sub-score).
- Appreciation +10.0/10.0
- ARV discount +7.5/15.0
- Cash flow +6.8/30.0
- Livability +3.4/5.0
- Rent growth +2.5/5.0
- Condition / age +2.5/5.0
- Schools +2.1/10.0
- 1% rule +1.2/10.0
- DSCR +1.1/10.0
$299,000
🖨 Deal sheet 📄 Offer letter ✓ Due diligence
Listing remarks MLS
This recently updated, single-level home is ideally located close to public schools, shopping, and downtown Madras. Well maintained and truly turn-key, the home features new LVP flooring throughout and vaulted ceilings in the great room and kitchen, giving a bright and open feel. The extremely spacious kitchen offers plenty of room to cook, gather, and entertain. There is a large front yard and welcoming front porch—perfect for relaxing outdoors. The primary suite includes an en-suite bathroom and walk-in closet, while two additional guest bedrooms provide flexibility for family, guests, or a home office. With its updates, location, and functional floorplan, this home is hard to beat!
Key facts
- Large front yard
- Spacious kitchen
- New lvp flooring
Tags
Neighborhood map
What this means for you Summary
Snapshot
- This is a 3-bed/2.0-bath other listed at $299k.
Deal economics
- At list price, monthly cash flow is $-459 ($-6k/yr) — negative.
- To cash-flow at today's rent, offer at most $218k (27.1% below list).
- To meet the 1% rule (rent ≥ 1% of price), the offer needs to be $186k (37.8% below list).
- Recommended offer: $186k (37.8% below list) — sets the bar for 1% rule.
- Cap rate 4.5% vs local median 2.9% in Madras — top-decile yield for the area; either an underpriced asset or a hidden risk that comps aren't pricing in. Stress-test before assuming the spread holds.
Location & tenants
- Location reads 67/100 on livability (#180 in OR) — a middle-class / working-renter tenant base. Strengths: cost of living A+, health & safety A+, housing A; Watch: amenities D+, schools F, crime D-.
- Jefferson County SD 509J (rural): math 19% / reading 30% proficiency, ranked #55 of 58 in OR (top 95%) — low school quality limits family demand, transient renter base, plan for 1-2y turnover; 77% free/reduced lunch — lower-income household profile, screen leases tightly.
- Market conditions: 260 active listings in the ZIP; 3 comparable units currently listed for rent nearby; rentals lingering (median 44d on market — plan ~5-8 weeks vacancy on turnover, expect pricing pressure); 100% of comp listings sitting > 30 days — soft ceiling on asking rent; 108 units permitted in Jefferson County in 2024 (5 in 5+ unit buildings).
- This rent runs 31% of the median local income ($71k/yr) — at the standard rent-burdened threshold; future hikes will face affordability resistance.
Forward outlook
- In year one you build about $32k of equity ($2k loan paydown + $30k appreciation (10.0% local appreciation)).
- Jefferson County population projected at +7% by 2050 — modest demand growth; plan on rents tracking national, not racing it.
- By year 2, paydown + projected appreciation supports a ~$51k cash-out refi (75% LTV) — recoverable capital for the next deal without selling this one.
Negotiation context
- It's been on market 129 days — a 12% lower offer ($263k) is reasonable based on typical stale-listing flexibility.
- 2 sale attempts; this cycle's ask has dropped $26k (8%) from the opening price — seller is motivated, your offer sets the floor, not the list.
- Current owner paid $147k; list at $299k implies a 103% gain — meaningful room to come down on a strong offer.
Risks & watch-outs
- Climate carrying-cost: major wildfire risk — expect insurance premiums to compound above CPI over the hold.
Questions for the listing agent
- What do current leases actually rent for vs. the listed asking? Can we see a recent rent roll and the last 12 months of T-12 income?
- It's been on market 129 days. Have you received any prior offers? Is the seller open to a 38% concession, seller financing, or rate buy-down credit?
- What does the HOA fee cover, when was the last increase, and are there any pending special assessments or reserve-fund shortfalls?
- Why hasn't it sold? Are there any deal-killer items the seller is aware of (foundation, flood, title, zoning, code violations)?
- Is there a deadline driving the sale (1031 exchange, divorce, estate, relocation)? That informs how much negotiation room exists.
- Schools are F-rated, which usually means shorter tenancies and higher turnover. Who's the typical renter profile here, and what's been the actual vacancy rate?
- Crime grade is D in this area — have there been break-ins, vandalism, or insurance claims at this property in the last 3 years? What carrier currently insures it and at what premium?
- The area grade is low — what's the realistic commute time and amenity access for the typical tenant pool here? Any planned neighborhood developments (good or bad) we should know about?
- What's the average days-on-market for RENTAL listings here right now (not sales)? A rising rental-DOM trend means longer vacancies and softer asking-rent achievability than the comps imply.
- What's the recent tenant-quality profile in this submarket — average credit score on applications, eviction rate, late-payment / NSF rate, and stable-employment percentage? A property-management company in the area should have these aggregated.
- How much new for-sale + rental construction is in the pipeline within 1–3 miles? Heavy new supply typically softens prices + rents 12–24 months out; constrained supply supports both.
Investment metrics
- 1% rule
- 0.62% ✗
- Cap rate
- 4.45%
- Cash-on-cash
- -6.57%
- DSCR
- 0.71
- GRM
- 13.4
CMA / ARV
No comps found within radius.
Projected returns pro-forma
10.0% appreciation · 3.0% rent growth · sell at horizon
- IRR
- 19.6%
- Equity multiple
- 2.60×
- Total profit
- $133,579
- Equity at exit
- $269,363
- IRR
- 18.0%
- Equity multiple
- 5.97×
- Total profit
- $416,222
- Equity at exit
- $580,891
Cash invested: $83,720 (down + closing). Projections, not guarantees.
Landlord ↔ Tenant lean methodology
- Overall (STATE)
- 28 Tenant-Leaning
- State Oregon
- 28 Tenant-Leaning · D+6
- County
- — inherits STATE
- City
- — inherits STATE
ZIP-level market 97741
- Home prices YoY
- 5.3%
- Active inventory
- 260
- Price-to-rent
- 13.4×
Monthly cashflow live
- Estimated rent
- $1,859 medium interval (Pro) →
- Mortgage (P&I)
- −$1,568
- Tax from tax record
- −$204 /mo · $2,454/yr
- Insurance
- −$125
- HOA
- −$30
- Vacancy / Maint / Mgmt
- −$390
- Net cashflow
- $-459
Break-even live
UW: 25.0% down · 7.5% · 30yr · 1.5% tax · 5.0% vac · 8.0% maint · 8.0% mgmt
Financing live
Cash to close
- Down payment
- $74,750
- Closing costs
- $8,970
- Reserves months
- —
- Total cash needed
- —
Loan-product check · same deal, 3 products live
Conventional
25% down · 7.5% · 30yr
- Down + closing
- —
- Monthly P&I
- —
- Monthly cashflow
- —
- DSCR
- —
- Eligible?
- —
Personal DTI + credit; lowest rate.
DSCR
20% down · 8.5% · 30yr
- Down + closing
- —
- Monthly P&I
- —
- Monthly cashflow
- —
- DSCR
- —
- Eligible?
- —
No personal income docs; deal must DSCR.
Hard money
10% down · 12.0% · 12mo
- Down + closing
- —
- Monthly P&I
- —
- Monthly cashflow
- —
- DSCR
- —
- Eligible?
- —
Short-term bridge; refi at stabilization.
Rent comps 3 comps
| Address | Beds | Baths | Sqft | Rent | $/sqft | DOM | Units | Dist |
|---|---|---|---|---|---|---|---|---|
| 335 SE 8th St Madras, OR | 3.0 | 1.0 | 1178 | $1,550 | $1.32 | 43d | 1 | 0.47mi |
| 1392 SE Yarrow Ave Madras, OR | 1.0–3.0 | 1.0–2.0 | 904 | $1,995 | $2.21 | 43d | 12 | 0.89mi |
| 652 NE McCampbell St Madras, OR | 3.0 | 2.0 | 1677 | $2,550 | $1.52 | 43d | 1 | 1.31mi |
HOA detail
- Monthly dues
- $30 · $360/yr
Listing history 8 events
-
2026-04-04price $299,000 699-char remark
Show marketing remark (699 chars)
This recently updated, single-level home is ideally located close to public schools, shopping, and downtown Madras. Well maintained and truly turn-key, the home features new LVP flooring throughout and vaulted ceilings in the great room and kitchen, giving a bright and open feel. The extremely spacious kitchen offers plenty of room to cook, gather, and entertain. There is a large front yard and welcoming front porch—perfect for relaxing outdoors. The primary suite includes an en-suite bathroom and walk-in closet, while two additional guest bedrooms provide flexibility for family, guests, or a home office. With its updates, location, and functional floorplan, this home is hard to beat!
-
2026-03-18price $315,000 699-char remark
Show marketing remark (699 chars)
This recently updated, single-level home is ideally located close to public schools, shopping, and downtown Madras. Well maintained and truly turn-key, the home features new LVP flooring throughout and vaulted ceilings in the great room and kitchen, giving a bright and open feel. The extremely spacious kitchen offers plenty of room to cook, gather, and entertain. There is a large front yard and welcoming front porch—perfect for relaxing outdoors. The primary suite includes an en-suite bathroom and walk-in closet, while two additional guest bedrooms provide flexibility for family, guests, or a home office. With its updates, location, and functional floorplan, this home is hard to beat!
-
2026-01-15$325,000 Active 699-char remark
Show marketing remark (699 chars)
This recently updated, single-level home is ideally located close to public schools, shopping, and downtown Madras. Well maintained and truly turn-key, the home features new LVP flooring throughout and vaulted ceilings in the great room and kitchen, giving a bright and open feel. The extremely spacious kitchen offers plenty of room to cook, gather, and entertain. There is a large front yard and welcoming front porch—perfect for relaxing outdoors. The primary suite includes an en-suite bathroom and walk-in closet, while two additional guest bedrooms provide flexibility for family, guests, or a home office. With its updates, location, and functional floorplan, this home is hard to beat!
-
2025-05-10historical $2,025
-
2025-04-29price $2,025
-
2025-01-29price $2,150
-
2025-01-08$2,350
-
2006-03-06soldstatus $147,400
ⓘ Source: listings_history table (triggers on properties + properties_extension) + one-shot
backfill from property_details.listing_events for pre-trigger history.
Tax reassessment forecast OR · Resets to sale price
- Current annual tax
- $2,454 · $204/mo
- Projected year-2 tax
- $2,900 · $242/mo
- Expected delta
- +$447/yr (+$37/mo · 18.2%)
ⓘ Screening estimate from a state-policy table — verify with the county assessor before closing.
Climate risk First Street
- Flood 1/10 Low FEMA zone X (shaded) · 0% chance over 30 yrs
- Wildfire 7/10 Severe
- Heat 4/10 Moderate 7 d/yr ≥95°F today · 15 d/yr by 30 yrs out
- Wind 1/10 Low
- Air quality 10/10 Extreme 18 unhealthy d/yr today · 22 by 30 yrs out
Nearby sold comps map
Loading sold comps map…
Walkable amenities ~0.75 mi
Loading nearby amenities…
Taxation est. · year 1
- Rental income
- $22,306
- − Mortgage interest
- −$16,749
- − Property taxes
- −$2,454
- − Insurance
- −$1,495
- − Repairs & maintenance
- −$1,784
- − Management
- −$1,784
- − HOA
- −$360
- − Depreciation
- −$8,698
- Taxable loss
- −$11,019
- Est. tax savings @ 24.0%
- +$2,644
- After-tax cash flow
- $-2,858/yr
For passive investors: Depreciation is non-cash, so a rental often shows a tax loss while cash-flowing — sheltering income. Rental losses are passive: they offset passive income freely, and up to $25,000/yr can offset ordinary (W-2) income if you actively participate and your MAGI is under $100k (phasing out to $0 by $150k); unused losses carry forward. On sale, claimed depreciation is recaptured at up to 25%, and gains may owe capital-gains tax (a 1031 exchange can defer both). Figures are a year-1 estimate at your 24.0% rate — not tax advice; consult a CPA.
Schools (NCES district)
- District
- Jefferson County SD 509J
- NCES district ID
- 4106740
- Math proficiency
- 19% ▼ -8.00%
- Reading proficiency
- 30% ▼ -9.00%
- Median HH income
- $42,663
- Composite
- 20.9/100
- National rank
- #8488
- State rank
- #55 of 58 in OR
Livability — Madras
- Score
- 67/100
- State rank
- #180
- US rank
- #11012
Category grades
Schools grade is shown separately in the Schools card above.
Census & demographics
- Census place
- Madras, OR
- County
- Jefferson County · 13,663 people
- City population
- 13,663
- Metro
- The Dalles, OR
- Population (ZIP)
- 13,663
- Household income
- $70,983
- Rent vs Own
- Severe rent burden
- 466.0
Population outlook (Jefferson County) Hauer SSP2
- Today (2025)
- 24,040 people
- By 2030
- 24,631 · +2.5%
- By 2040
- 25,499 · +6.1%
- By 2050
- 25,801 · +7.3%
- By 2075
- 25,682 · +6.8%
- By 2100
- 22,222 · -7.6%
Race, ethnicity, and origin ACS 2023
- Neighborhood character
- Diverse neighborhood (Simpson 0.62)
- Race & ethnicity
- White 56% Hispanic / Latino 27% Two or more races 19% Native American 8%
- Hispanic origin (detail)
- Mexican 24%
- Common ancestry
- Portuguese 2% Italian 1% Iranian 1%
- Foreign-born
- 8% · Canada
- Languages at home
- 78% English-only · Spanish 20%
Political lean MEDSL · Jefferson
- 2024 margin
- Solid R (+30.2) · D 33.6% · R 63.8% · Other 2.5%
- 2008→2024 swing
- -21.5pp toward R · 2008: -8.7pp · 2024: -30.2pp
- All cycles
- 2024: R+30.2 2020: R+23.5 2016: R+27.6 2012: R+16.8 2008: R+8.7
Not yet ingested
- Civics
- —
Market trends
- HPI YoY
- ▲ 29.68%
- Current HPI
- 590.9612
- Rent YoY
- —
- Metro
- The Dalles, OR
- State GDP YoY
- ▲ 2.05%
- F500 in state
- 2
Industry mix (Fortune 500 HQ in OR)
| Industry | F500 HQs | Revenue |
|---|---|---|
| Consumer Goods | 1 | $51B |
|
||
Price history
+102.8% since first listed8 events — show timeline
- 2026-04-04 Price Changed $299,000 MLSCO
- 2026-03-18 Price Changed $315,000 MLSCO
- 2026-01-15 Listed $325,000 MLSCO
- 2025-05-10 Rental Removed $2,025 APPFOLIO
- 2025-04-29 Price Changed $2,025 APPFOLIO
- 2025-01-29 Price Changed $2,150 APPFOLIO
- 2025-01-08 Listed for Rent $2,350 APPFOLIO
- 2006-03-06 Sold (Public Records) $147,400 Public Records
Property tax history
+4.0%/yrLatest (2025): $2,454 · +1.7% YoY. Source: county tax records.
Cash-flow waterfall
monthlySold comps — $/sqft
last 12 mo · ≤1 miLoading sold comps…