Hwy 119 · Pineville, KY
Flood risk 8/10 · Major
- FEMA flood zone
- X (unshaded)
- Chance of flooding over 30 yrs
- 0.87%
- Est. flood insurance / yr
- $507 – $1,088
Fire risk 4/10 · Minor
- Est. fire insurance / yr
- $839 – $1,559
Heat risk 5/10 · Moderate
- Hot days now (above 100°F)
- 7 days/yr
- Hot days in 30 yrs
- 21 days/yr
Wind risk 2/10 · Minimal
- Chance of severe wind over 30 yrs
- 3.0%
Air-quality risk 2/10 · Minimal
- Unhealthy air days now
- 2 days/yr
- Unhealthy air days in 30 yrs
- 2 days/yr
Risk factors via First Street. Map © Google.
Why this score? — see what drove the C- grade
The composite is a weighted blend of 9 inputs, each scored 0–100. Each bar is that input's sub-score; the figure is the points it added to the 100-point composite (weight × sub-score).
- Cash flow +15.0/30.0
- ARV discount +7.5/15.0
- Appreciation +7.2/10.0
- 1% rule +5.0/10.0
- DSCR +5.0/10.0
- Livability +3.4/5.0
- Schools +2.7/10.0
- Rent growth +2.5/5.0
- Condition / age +2.5/5.0
$22,500
🖨 Deal sheet 📄 Offer letter ✓ Due diligence
Key facts
- 0.75 acre lot
- Built 1995
- Listed 319 days
Property features AI
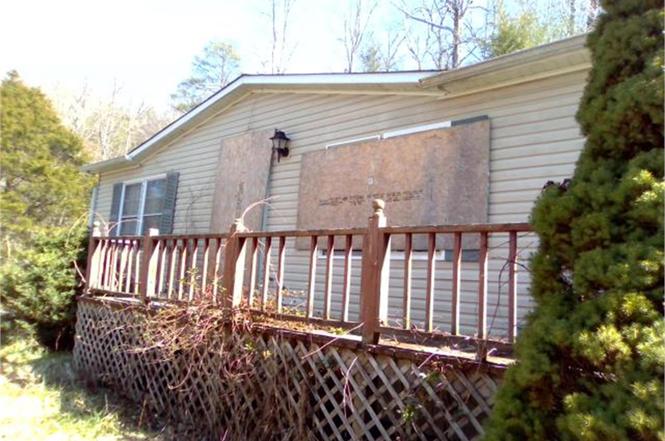
Exterior
- Parking: Off-street parking
- Utilities: Septic tank
- Home design: Detached property; Building area 1,232 (source: tax records)
- Construction: Construction: Other
- Exterior features: Wooded lot; Rolling slope
Interior
- Bathrooms: 2 full bathrooms
- Heating & cooling: Electric heating; No central cooling indicated
- Interior features: 5 total rooms; Crawl space basement
Neighborhood map
What this means for you Summary
Snapshot
- This is a 3-bed/2.0-bath manufactured listed at $22k.
Deal economics
- At list price, monthly cash flow is $601 ($7k/yr) — positive.
- The deal already cash-flows at list — no discount required.
- Meets the 1% rule at list price ($1k rent vs $22k).
- Recommended offer: $20k (12.0% below list) — sets the bar for market timing.
Location & tenants
- Location reads 68/100 on livability (#195 in KY) — a middle-class / working-renter tenant base. Strengths: crime A+, cost of living A+, health & safety A-; Watch: schools D-, amenities F, commute F.
- Bell County (rural): math 27% / reading 40% proficiency, ranked #91 of 165 in KY (top 55%) — families likely to look elsewhere, expect single-tenant / working-renter base with shorter leases; 71% free/reduced lunch — lower-income household profile, screen leases tightly.
- Market conditions: 7 active listings in the ZIP; 44 units permitted in Bell County in 2024 (0 in 5+ unit buildings).
Forward outlook
- In year one you build about $1k of equity ($156 loan paydown + $979 appreciation (4.3% local appreciation)).
- Bell County population projected at -30% by 2050 — secular population decline; favor cash flow + early exit over multi-decade hold.
- At projected returns (4.3% appreciation + 3.0% rent growth), your $6k cash investment doubles in ~1 year — after that, you're playing with house money.
Negotiation context
- It's been on market 319 days — a 12% lower offer ($20k) is reasonable based on typical stale-listing flexibility.
Risks & watch-outs
- Watch-outs: flood insurance adds $66/mo.
- Climate carrying-cost: severe flood risk; extreme-heat days projected 7→21/yr by 2055 (HVAC capex compounding) — expect insurance premiums to compound above CPI over the hold.
Questions for the listing agent
- It's been on market 319 days. Have you received any prior offers? Is the seller open to a 12% concession, seller financing, or rate buy-down credit?
- What's the actual annual flood-insurance premium (NFIP or private), and is the property in a SFHA with mandatory coverage?
- Why hasn't it sold? Are there any deal-killer items the seller is aware of (foundation, flood, title, zoning, code violations)?
- Is there a deadline driving the sale (1031 exchange, divorce, estate, relocation)? That informs how much negotiation room exists.
- Schools are D-rated, which usually means shorter tenancies and higher turnover. Who's the typical renter profile here, and what's been the actual vacancy rate?
- What's the average days-on-market for RENTAL listings here right now (not sales)? A rising rental-DOM trend means longer vacancies and softer asking-rent achievability than the comps imply.
- What's the recent tenant-quality profile in this submarket — average credit score on applications, eviction rate, late-payment / NSF rate, and stable-employment percentage? A property-management company in the area should have these aggregated.
- How much new for-sale + rental construction is in the pipeline within 1–3 miles? Heavy new supply typically softens prices + rents 12–24 months out; constrained supply supports both.
Investment metrics
- 1% rule
- 4.63% ✓
- Cap rate
- 41.89%
- Cash-on-cash
- 127.12%
- DSCR
- 6.66
- GRM
- 1.8
CMA / ARV
No comps found within radius.
Projected returns pro-forma
4.35% appreciation · 3.0% rent growth · sell at horizon
- IRR
- —
- Equity multiple
- 7.78×
- Total profit
- $42,690
- Equity at exit
- $11,871
- IRR
- —
- Equity multiple
- 16.32×
- Total profit
- $96,496
- Equity at exit
- $19,795
Cash invested: $6,300 (down + closing). Projections, not guarantees.
Landlord ↔ Tenant lean methodology
- Overall (STATE)
- 83 Strongly Landlord-Friendly
- State Kentucky
- 83 Strongly Landlord-Friendly · R+16
- County
- — inherits STATE
- City
- — inherits STATE
ZIP-level market 40813
- Home prices YoY
- 4.2%
- Active inventory
- 7
- Price-to-rent
- 1.8×
Monthly cashflow live
- Estimated rent
- $1,042 medium interval (Pro) →
- Mortgage (P&I)
- −$118
- Tax est. 1.5%
- −$28 /mo · $338/yr
- Insurance
- −$9
- Flood insurance flood zone
- −$66 /mo · $798/yr
- HOA
- −$0
- Vacancy / Maint / Mgmt
- −$219
- Net cashflow
- $601
Break-even live
UW: 25.0% down · 7.5% · 30yr · 1.5% tax · 5.0% vac · 8.0% maint · 8.0% mgmt
Financing live
Cash to close
- Down payment
- $5,625
- Closing costs
- $675
- Reserves months
- —
- Total cash needed
- —
Loan-product check · same deal, 3 products live
Conventional
25% down · 7.5% · 30yr
- Down + closing
- —
- Monthly P&I
- —
- Monthly cashflow
- —
- DSCR
- —
- Eligible?
- —
Personal DTI + credit; lowest rate.
DSCR
20% down · 8.5% · 30yr
- Down + closing
- —
- Monthly P&I
- —
- Monthly cashflow
- —
- DSCR
- —
- Eligible?
- —
No personal income docs; deal must DSCR.
Hard money
10% down · 12.0% · 12mo
- Down + closing
- —
- Monthly P&I
- —
- Monthly cashflow
- —
- DSCR
- —
- Eligible?
- —
Short-term bridge; refi at stabilization.
Listing history 3 events
-
2026-05-11status Pending
-
2026-04-30price $22,500
-
2025-06-24$39,900 Active
ⓘ Source: listings_history table (triggers on properties + properties_extension) + one-shot
backfill from property_details.listing_events for pre-trigger history.
Climate risk First Street
- Flood 8/10 Severe FEMA zone X (unshaded) · 87% chance over 30 yrs
- Wildfire 4/10 Moderate
- Heat 5/10 Major 7 d/yr ≥100°F today · 21 d/yr by 30 yrs out
- Wind 2/10 Low 3% chance of damaging wind over 30 yrs
- Air quality 2/10 Low 2 unhealthy d/yr today · 2 by 30 yrs out
Nearby sold comps map
Loading sold comps map…
Walkable amenities ~0.75 mi
Loading nearby amenities…
Taxation est. · year 1
- Rental income
- $12,500
- − Mortgage interest
- −$1,260
- − Property taxes
- −$338
- − Insurance
- −$910
- − Repairs & maintenance
- −$1,000
- − Management
- −$1,000
- − Depreciation
- −$655
- Taxable income
- $7,337
- Est. tax owed @ 24.0%
- −$1,761
- After-tax cash flow
- $5,450/yr
For passive investors: Depreciation is non-cash, so a rental often shows a tax loss while cash-flowing — sheltering income. Rental losses are passive: they offset passive income freely, and up to $25,000/yr can offset ordinary (W-2) income if you actively participate and your MAGI is under $100k (phasing out to $0 by $150k); unused losses carry forward. On sale, claimed depreciation is recaptured at up to 25%, and gains may owe capital-gains tax (a 1031 exchange can defer both). Figures are a year-1 estimate at your 24.0% rate — not tax advice; consult a CPA.
Schools (NCES district)
- District
- Bell County
- NCES district ID
- 2100390
- Math proficiency
- 27% ▼ -14.00%
- Reading proficiency
- 40% ▼ -18.00%
- Median HH income
- $27,032
- Composite
- 26.86/100
- National rank
- #7102
- State rank
- #91 of 165 in KY
Livability — Pineville
- Score
- 68/100
- State rank
- #195
- US rank
- #9690
Category grades
Schools grade is shown separately in the Schools card above.
Census & demographics
- Population (ZIP)
- 321
Population outlook (Bell County) Hauer SSP2
- Today (2025)
- 24,501 people
- By 2030
- 22,923 · -6.4%
- By 2040
- 19,860 · -18.9%
- By 2050
- 17,161 · -30.0%
- By 2075
- 12,070 · -50.7%
- By 2100
- 8,525 · -65.2%
Race, ethnicity, and origin ACS 2023
- Neighborhood character
- Predominantly White (100%)
- Race & ethnicity
- White 100%
- Common ancestry
- Slovak 19%
Political lean MEDSL · Bell
- 2024 margin
- Solid R (+68.7) · D 15.2% · R 83.9%
- 2008→2024 swing
- -28.1pp toward R · 2008: -40.6pp · 2024: -68.7pp
- All cycles
- 2024: R+68.7 2020: R+63.2 2016: R+62.2 2012: R+51.7 2008: R+40.6
Not yet ingested
- Civics
- —
Market trends
- HPI YoY
- ▲ 4.35%
- Current HPI
- 106.9899
- Rent YoY
- —
- Metro
- —
- State GDP YoY
- ▲ 1.81%
- F500 in state
- 4
Industry mix (Fortune 500 HQ in KY)
| Industry | F500 HQs | Revenue |
|---|---|---|
| Healthcare | 1 | $118B |
|
||
| Food / Beverage | 1 | $7B |
|
||
Price history
-43.6% since first listed3 events — show timeline
- 2026-05-11 Pending — Knoxville MLS
- 2026-04-30 Price Changed $22,500 Knoxville MLS
- 2025-06-24 Listed $39,900 Knoxville MLS
Cash-flow waterfall
monthlySold comps — $/sqft
last 12 mo · ≤1 miLoading sold comps…