 🏗️ New Construction
Plan 1477 Plan · Hitchcock, TX
Flood risk No data
- FEMA flood zone
- —
- Chance of flooding over 30 yrs
- —
- Est. flood insurance / yr
- —
Fire risk No data
- Est. fire insurance / yr
- —
Heat risk No data
- Hot days now (above threshold)
- —
- Hot days in 30 yrs
- —
Wind risk No data
- Chance of severe wind over 30 yrs
- —
Air-quality risk No data
- Unhealthy air days now
- —
- Unhealthy air days in 30 yrs
- —
Risk factors via First Street. Map © Google.
Why this score? — see what drove the F grade
The composite is a weighted blend of 9 inputs, each scored 0–100. Each bar is that input's sub-score; the figure is the points it added to the 100-point composite (weight × sub-score).
- Cash flow +7.6/30.0
- ARV discount +7.5/15.0
- Livability +3.4/5.0
- Schools +2.6/10.0
- Rent growth +2.5/5.0
- 1% rule +2.2/10.0
- Condition / age +2.2/5.0
- DSCR +1.7/10.0
- Appreciation +0.0/10.0
$220,995
🖨 Deal sheet (PDF) 📄 Offer letter ✓ Due diligence
Listing remarks MLS
* Granite kitchen countertops * Gas range * Kitchen USB charging receptacle * Kitchen breakfast bar * Smart thermostat * Low-E windows * 5-panel interior doors * Open floor plan * Spacious great room * Dedicated laundry room * WaterSense® labeled faucets * ENERGY STAR® certified home * Close to ocean * Community park * Commuter-friendly location * Near entertainment and leisure * Volleyball court * Walking paths
Key facts
- Low-e windows
- Smart thermostat
- Gas range
Tags
Neighborhood map
What this means for you Summary
Snapshot
- This is a 3-bed/2.0-bath single-family listed at $221k. Condition is rated fair.
Deal economics
- At list price, monthly cash flow is $-310 ($-4k/yr) — negative.
- To cash-flow at today's rent, offer at most $212k (4.0% below list).
- To meet the 1% rule (rent ≥ 1% of price), the offer needs to be $186k (16.0% below list).
- Recommended offer: $186k (16.0% below list) — sets the bar for 1% rule.
- Cap rate 4.8% vs local median 1.0% in Hitchcock — top-decile yield for the area; either an underpriced asset or a hidden risk that comps aren't pricing in. Stress-test before assuming the spread holds.
Location & tenants
- Location reads 67/100 on livability (#560 in TX) — a middle-class / working-renter tenant base. Strengths: cost of living A+, housing A+; Watch: crime C-, employment D+, amenities F.
- Hitchcock ISD (suburban): math 28% / reading 31% proficiency, ranked #628 of 826 in TX (top 76%) — low school quality limits family demand, transient renter base, plan for 1-2y turnover; 72% free/reduced lunch — lower-income household profile, screen leases tightly.
- Zoned schools: Hitchcock Pri (453 students, 85% FRL); Crosby Middle (math 25% / reading 33%, grade F, #1,103 of 1,662 statewide, top 67%, 410 students, 84% FRL); Hitchcock H S (math 47% / reading 47%, grade D-, #591 of 1,632 statewide, top 38%, 470 students, 77% FRL).
- Market conditions: 302 active listings in the ZIP; 4 comparable units currently listed for rent nearby; rentals at typical pace (median 22d on market — plan ~3-4 weeks tenant-placement turnaround); solid renter incomes; 3,258 units permitted in Galveston County in 2024 (0 in 5+ unit buildings).
Forward outlook
- Local home prices are declining (-3.0%/yr); year-one equity from $2k of loan paydown is wiped out by about $8k of value loss. Plan a longer hold.
- Galveston County population projected at +43% by 2050 — long-run rental-demand tailwind backs the buy-and-hold thesis.
Negotiation context
- It's been on market 390 days — a 12% lower offer ($194k) is reasonable based on typical stale-listing flexibility.
Questions for the listing agent
- What do current leases actually rent for vs. the listed asking? Can we see a recent rent roll and the last 12 months of T-12 income?
- It's been on market 390 days. Have you received any prior offers? Is the seller open to a 16% concession, seller financing, or rate buy-down credit?
- Have any recent inspections been done? Can we get a copy of the seller's disclosures and any deferred-maintenance estimates?
- Why hasn't it sold? Are there any deal-killer items the seller is aware of (foundation, flood, title, zoning, code violations)?
- Is there a deadline driving the sale (1031 exchange, divorce, estate, relocation)? That informs how much negotiation room exists.
- Schools are D-rated, which usually means shorter tenancies and higher turnover. Who's the typical renter profile here, and what's been the actual vacancy rate?
- The area grade is low — what's the realistic commute time and amenity access for the typical tenant pool here? Any planned neighborhood developments (good or bad) we should know about?
- What's the average days-on-market for RENTAL listings here right now (not sales)? A rising rental-DOM trend means longer vacancies and softer asking-rent achievability than the comps imply.
- What's the recent tenant-quality profile in this submarket — average credit score on applications, eviction rate, late-payment / NSF rate, and stable-employment percentage? A property-management company in the area should have these aggregated.
- How much new for-sale + rental construction is in the pipeline within 1–3 miles? Heavy new supply typically softens prices + rents 12–24 months out; constrained supply supports both.
Investment metrics
- 1% rule
- 0.72% ✗
- Cap rate
- 4.85%
- Cash-on-cash
- -5.16%
- DSCR
- 0.77
- GRM
- 11.5
CMA / ARV
- ARV (median comp)
- $257,016
- List price
- $220,995
- Delta
- -14.01%
- Verdict
- UNDERPRICED
- Comps
- 20 within 1.0 mi
Show comp detail 12 sales within ~0.75 mi
| Address | Dist | Beds/Ba | Sqft | Sold | Price | $/sf | Match |
|---|---|---|---|---|---|---|---|
| 1109 Black Rail St | 0.33mi | 3/2.0 | 1,526 (+3%) | 1mo | $245,000 | $161 | 79 |
| 996 Camellia Hills Ln | 0.33mi | 3/2.0 | 1,526 (+3%) | 1mo | $239,000 | $157 | 78 |
| 5514 Blackbird Ln | 0.11mi | 3/2.0 | 1,655 (+12%) | 2mo | $259,995 | $157 | 73 |
| 1233 Sacred Light Ln | 0.61mi | 3/2.0 | 1,491 (+1%) | 0mo | $252,990 | $170 | 70 |
| 1305 Blue Moon Ln | 0.61mi | 3/2.0 | 1,491 (+1%) | 1mo | $257,990 | $173 | 69 |
| 5515 Blackbird Ln | 0.13mi | 3/2.0 | 1,271 (-14%) | 3mo | $242,995 | $191 | 68 |
| 805 Apple Blossom Dr | 0.63mi | 3/2.0 | 1,501 (+2%) | 1mo | $269,990 | $180 | 67 |
| 1106 Radiant Ave | 0.54mi | 3/2.0 | 1,548 (+5%) | 1mo | $265,990 | $172 | 66 |
| 26259 Astral Way | 0.49mi | 3/2.0 | 1,615 (+9%) | 2mo | $274,990 | $170 | 60 |
| 914 Temple Cir | 0.41mi | 3/2.0 | 1,671 (+13%) | 1mo | $218,000 | $130 | 58 |
| 634 Cherry Tree Dr | 0.74mi | 3/2.0 | 1,566 (+6%) | 2mo | $260,960 | $167 | 54 |
| 608 Burlina Rd | 0.68mi | 4/2.0 (+1) | 1,676 (+14%) | 2mo | $268,990 | $160 | 39 |
Match score weights: distance 35% · size 25% · config 20% · recency 20%. Top-matched comps best support the ARV.
Projected returns pro-forma
-3.0% appreciation · 3.0% rent growth · sell at horizon
- IRR
- -25.1%
- Equity multiple
- 0.15×
- Total profit
- $-61,340
- Equity at exit
- $38,322
- IRR
- -21.0%
- Equity multiple
- -0.09×
- Total profit
- $-78,694
- Equity at exit
- $22,222
Cash invested: $71,964 (down + closing). Projections, not guarantees.
Landlord ↔ Tenant lean methodology
- Overall (STATE)
- 87 Strongly Landlord-Friendly
- State Texas
- 87 Strongly Landlord-Friendly · R+5
- County
- — inherits STATE
- City
- — inherits STATE
ZIP-level market 77563
- Active inventory
- 302
- Price-to-rent
- 9.9×
Monthly cashflow live
- Estimated rent
- $1,856 medium interval (Pro) →
- Mortgage (P&I)
- −$1,348
- Tax est. 1.5%
- −$321 /mo · $3,855/yr
- Insurance
- −$107
- HOA
- −$0
- Vacancy / Maint / Mgmt
- −$390
- Net cashflow
- $-310
Break-even live
Sensitivity live
| Price | -10% $-132 | -5% $-221 | +0% $-310 | +5% $-398 | +10% $-487 |
|---|---|---|---|---|---|
| Rent | -10% $-456 | -5% $-383 | +0% $-310 | +5% $-236 | +10% $-163 |
| Rate | -1.0pp $-180 | -0.5pp $-244 | base $-310 | +0.5pp $-376 | +1.0pp $-444 |
UW: 25.0% down · 7.5% · 30yr · 1.5% tax · 5.0% vac · 8.0% maint · 8.0% mgmt
Financing live
Cash to close
- Down payment
- $64,254
- Closing costs
- $7,710
- Reserves months
- —
- Total cash needed
- —
Loan-product check · same deal, 3 products live
Conventional
25% down · 7.5% · 30yr
- Down + closing
- —
- Monthly P&I
- —
- Monthly cashflow
- —
- DSCR
- —
- Eligible?
- —
Personal DTI + credit; lowest rate.
DSCR
20% down · 8.5% · 30yr
- Down + closing
- —
- Monthly P&I
- —
- Monthly cashflow
- —
- DSCR
- —
- Eligible?
- —
No personal income docs; deal must DSCR.
Hard money
10% down · 12.0% · 12mo
- Down + closing
- —
- Monthly P&I
- —
- Monthly cashflow
- —
- DSCR
- —
- Eligible?
- —
Short-term bridge; refi at stabilization.
Rent comps 4 comps
| Address | Beds | Baths | Sqft | Rent | $/sqft | DOM | Units | Dist |
|---|---|---|---|---|---|---|---|---|
| 7440 Highway 6 Hitchcock, TX | 1.0–3.0 | 1.0–2.0 | 866 | $1,428 | $1.65 | 0d | 11 | 1.26mi |
| 7446 Highway 6 Hitchcock, TX | 3.0 | 2.0 | 1035 | $1,150 | $1.11 | 45d | 1 | 1.33mi |
| 453 Maple Bend Ln La Marque, TX | 3.0 | 2.0 | 1860 | $2,071 | $1.11 | 22d | 1 | 1.35mi |
| 14403 Daniel Shores Dr La Marque, TX | 4.0 | 3.0–3.5 | 1872 | $2,600 | $1.39 | 0d | 12 | 1.39mi |
Listing history 20 events
-
2026-06-21days on market $220,995 Active 390 DOM
-
2026-06-18days on market $220,995 Active 387 DOM
-
2026-06-17days on market $220,995 Active 386 DOM
-
2026-06-16days on market $220,995 Active 385 DOM
-
2026-06-15days on market $220,995 Active 384 DOM
-
2026-06-13days on market $220,995 Active 382 DOM
-
2026-06-13days on market $220,995 Active 381 DOM
-
2026-06-09days on market $220,995 Active 378 DOM
-
2026-06-08days on market $220,995 Active 377 DOM
-
2026-06-07days on market $220,995 Active 376 DOM
-
2026-06-04days on market $220,995 Active 373 DOM
-
2026-06-03days on market $220,995 Active 372 DOM
-
2026-06-02days on market $220,995 Active 371 DOM
-
2026-06-01days on market $220,995 Active 370 DOM
-
2026-05-31days on market $220,995 Active 369 DOM
-
2026-01-22price $220,995 458-char remark
Show marketing remark (458 chars)
* Granite kitchen countertops * Gas range * Kitchen USB charging receptacle * Kitchen breakfast bar * Smart thermostat * Low-E windows * 5-panel interior doors * Open floor plan * Spacious great room * Dedicated laundry room * WaterSense® labeled faucets * ENERGY STAR® certified home * Close to ocean * Community park * Commuter-friendly location * Near entertainment and leisure * Volleyball court * Walking paths
-
2025-11-18price $225,995 458-char remark
Show marketing remark (458 chars)
* Granite kitchen countertops * Gas range * Kitchen USB charging receptacle * Kitchen breakfast bar * Smart thermostat * Low-E windows * 5-panel interior doors * Open floor plan * Spacious great room * Dedicated laundry room * WaterSense® labeled faucets * ENERGY STAR® certified home * Close to ocean * Community park * Commuter-friendly location * Near entertainment and leisure * Volleyball court * Walking paths
-
2025-11-10price $221,995 458-char remark
Show marketing remark (458 chars)
* Granite kitchen countertops * Gas range * Kitchen USB charging receptacle * Kitchen breakfast bar * Smart thermostat * Low-E windows * 5-panel interior doors * Open floor plan * Spacious great room * Dedicated laundry room * WaterSense® labeled faucets * ENERGY STAR® certified home * Close to ocean * Community park * Commuter-friendly location * Near entertainment and leisure * Volleyball court * Walking paths
-
2025-06-14price $219,995 458-char remark
Show marketing remark (458 chars)
* Granite kitchen countertops * Gas range * Kitchen USB charging receptacle * Kitchen breakfast bar * Smart thermostat * Low-E windows * 5-panel interior doors * Open floor plan * Spacious great room * Dedicated laundry room * WaterSense® labeled faucets * ENERGY STAR® certified home * Close to ocean * Community park * Commuter-friendly location * Near entertainment and leisure * Volleyball court * Walking paths
-
2025-05-28$217,995 Active 458-char remark
Show marketing remark (458 chars)
* Granite kitchen countertops * Gas range * Kitchen USB charging receptacle * Kitchen breakfast bar * Smart thermostat * Low-E windows * 5-panel interior doors * Open floor plan * Spacious great room * Dedicated laundry room * WaterSense® labeled faucets * ENERGY STAR® certified home * Close to ocean * Community park * Commuter-friendly location * Near entertainment and leisure * Volleyball court * Walking paths
ⓘ Source: listings_history table (triggers on properties + properties_extension) + one-shot
backfill from property_details.listing_events for pre-trigger history.
Nearby sold comps map
Loading sold comps map…
Walkable amenities ~0.75 mi
Loading nearby amenities…
Taxation est. · year 1
- Rental income
- $22,277
- − Mortgage interest
- −$14,397
- − Property taxes
- −$3,855
- − Insurance
- −$1,285
- − Repairs & maintenance
- −$1,782
- − Management
- −$1,782
- − Depreciation
- −$7,477
- Taxable loss
- −$8,302
- Est. tax savings @ 24.0%
- +$1,992
- After-tax cash flow
- $-1,723/yr
For passive investors: Depreciation is non-cash, so a rental often shows a tax loss while cash-flowing — sheltering income. Rental losses are passive: they offset passive income freely, and up to $25,000/yr can offset ordinary (W-2) income if you actively participate and your MAGI is under $100k (phasing out to $0 by $150k); unused losses carry forward. On sale, claimed depreciation is recaptured at up to 25%, and gains may owe capital-gains tax (a 1031 exchange can defer both). Figures are a year-1 estimate at your 24.0% rate — not tax advice; consult a CPA.
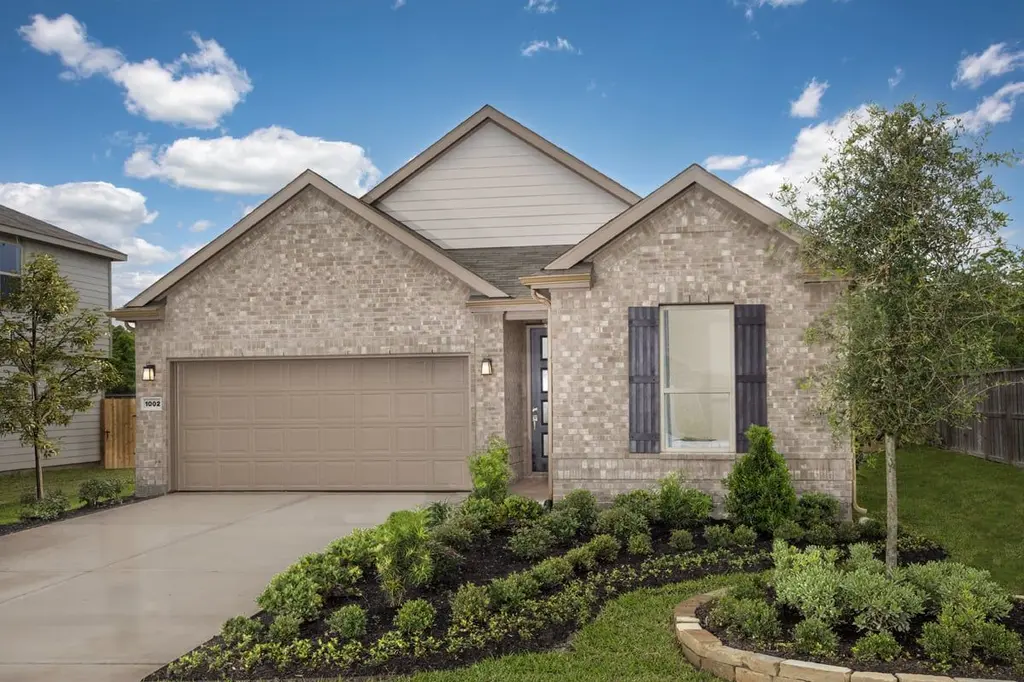
Condition & rehab AI · 1 photo
The home is in good condition with good systems and features, but some landscaping and exterior painting are needed to enhance its curb appeal and value.
Repairs flagged
- Minor Landscaping — Some overgrown grass
Value-add opportunities
- Both Landscaping and curb appeal — Enhances curb appeal and could attract more buyers
- Both Paint exterior — Improves home's appearance and could increase its value
Renovation cost estimate screening
| Repair item | Severity | Est. cost |
|---|---|---|
| Landscaping · Some overgrown grass | Minor | $500–3,000 |
| Total estimated repair cost · 1 items | $500–3,000 |
Value-add ROI direction
- Both Landscaping and curb appeal — Enhances curb appeal and could attract more buyers ↑
- Both Paint exterior — Improves home's appearance and could increase its value ↑
ⓘ Cost ranges are severity-bucket heuristics (US national rule-of-thumb). Get contractor quotes + a written scope before underwriting a rehab budget.
Schools (NCES district)
- District
- Hitchcock ISD
- NCES district ID
- 4823310
- Math proficiency
- 28% ▼ -2.00%
- Reading proficiency
- 31% ▼ -4.00%
- Median HH income
- $47,041
- Composite
- 25.5/100
- National rank
- #7439
- State rank
- #628 of 826 in TX
Livability — Hitchcock
- Score
- 67/100
- State rank
- #560
- US rank
- #10752
Category grades
Schools grade is shown separately in the Schools card above.
Census & demographics
- Census place
- Hitchcock, TX
- County
- Galveston County · 357,330 people
- City population
- 9,955
- Metro
- Houston-The Woodlands-Sugar Land, TX
- Population (ZIP)
- 9,955
- Household income
- $75,806
- Rent vs Own
- Severe rent burden
- 317.0
Population outlook (Galveston County) Hauer SSP2
- Today (2025)
- 390,640 people
- By 2030
- 425,226 · +8.9%
- By 2040
- 493,765 · +26.4%
- By 2050
- 559,698 · +43.3%
- By 2075
- 719,260 · +84.1%
- By 2100
- 819,628 · +109.8%
Race, ethnicity, and origin ACS 2023
- Neighborhood character
- Diverse neighborhood (Simpson 0.66)
- Race & ethnicity
- White 49% Hispanic / Latino 25% Black 21% Two or more races 14%
- Hispanic origin (detail)
- Mexican 24%
- Common ancestry
- Italian 4% Slovak 2% Serbian 2%
- Foreign-born
- 7% · Canada, Vietnam
- Languages at home
- 83% English-only · Spanish 16%
Political lean MEDSL · Galveston
- 2024 margin
- Strong R (+27.4) · D 35.7% · R 63.1% · Other 1.2%
- 2008→2024 swing
- -7.9pp toward R · 2008: -19.5pp · 2024: -27.4pp
- All cycles
- 2024: R+27.4 2020: R+22.6 2016: R+22.6 2012: R+26.9 2008: R+19.5
Not yet ingested
- Civics
- —
Market trends
- HPI YoY
- ▼ -145.04%
- Current HPI
- 261.4711
- Rent YoY
- —
- Metro
- Houston-The Woodlands-Sugar Land, TX
- State GDP YoY
- ▲ 3.95%
- F500 in state
- 110
Industry mix (Fortune 500 HQ in TX)
| Industry | F500 HQs | Revenue |
|---|---|---|
| Energy | 16 | $1,198B |
|
||
| Technology | 5 | $198B |
|
||
| Engineering / Construction | 4 | $72B |
|
||
| Energy Services | 3 | $60B |
|
||
| Utilities | 3 | $41B |
|
||
| Healthcare | 2 | $330B |
|
||
Price history
+1.4% since first listed5 events — show timeline
- 2026-01-22 Price Changed $220,995 Zillow
- 2025-11-18 Price Changed $225,995 Zillow
- 2025-11-10 Price Changed $221,995 Zillow
- 2025-06-14 Price Changed $219,995 Zillow
- 2025-05-28 Listed $217,995 Zillow
Cash-flow waterfall
monthlySold comps — $/sqft
last 12 mo · ≤1 miLoading sold comps…