 🌊 Lakefront
18415 Hames St SE · McKenna, WA
Flood risk 1/10 · Minimal
- FEMA flood zone
- X (unshaded)
- Chance of flooding over 30 yrs
- 0.0%
- Est. flood insurance / yr
- $507 – $1,088
Fire risk 2/10 · Minimal
- Est. fire insurance / yr
- $604 – $1,122
Heat risk 2/10 · Minimal
- Hot days now (above 89°F)
- 7 days/yr
- Hot days in 30 yrs
- 14 days/yr
Wind risk 1/10 · Minimal
- Chance of severe wind over 30 yrs
- —
Air-quality risk 6/10 · Moderate
- Unhealthy air days now
- 7 days/yr
- Unhealthy air days in 30 yrs
- 9 days/yr
Risk factors via First Street. Map © Google.
Why this score? — see what drove the D+ grade
The composite is a weighted blend of 9 inputs, each scored 0–100. Each bar is that input's sub-score; the figure is the points it added to the 100-point composite (weight × sub-score).
- ARV discount +15.0/15.0
- Cash flow +11.8/30.0
- Schools +4.8/10.0
- Rent growth +3.9/5.0
- DSCR +3.5/10.0
- Livability +3.4/5.0
- 1% rule +2.6/10.0
- Condition / age +2.5/5.0
- Appreciation +0.0/10.0
$399,000
🖨 Deal sheet (PDF) 📄 Offer letter ✓ Due diligence
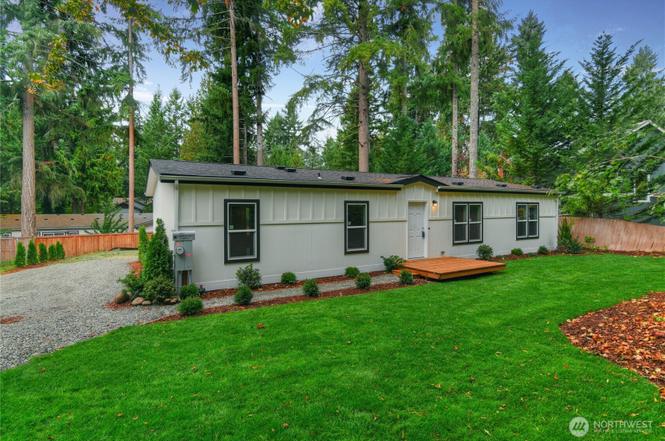
Listing remarks
Welcome home to Single Tree estates! This beautiful gated community offers a lakefront clubhouse, dock, boat launch, tennis courts, parks & walking trails! Enjoy one level living in the brand new 2025 4 bedroom, 2 bath home offering over 1500 Sq Ft. of open living space. Chef's kitchen with lot's of cabinet space, spacious bedrooms, beautiful bathrooms and fresh landscaping. 30 Mins to JBLM! Come tour this impressive community and new home today!
Key facts
- Gated community
- Boat launch
- Lakefront clubhouse
Tags
Property features AI
Finance
- Other: NW ENERGY STAR certified (NWESH Certified)
- Financial info: Accepted financing: Cash, Conventional, FHA, VA
- HOA & community: Part of Single Tree Estates association; Annual association fee of $780 (includes water); Community features: boat launch, CCRs, clubhouse, park, trails
Exterior
- Parking: Driveway
- Security: Security gate
- Utilities: Electric energy source; Community water (Single Tree Estates); Septic sewer; Electric water heater
- Home design: Manufactured home (double wide); Skyline make, model 2L 4401-6; One story; Main entry level; Has a view; Property in very good condition
- Construction: Wood construction; Composition roof; Poured concrete foundation with tie downs; Year built (effective) 2025; New construction (completed)
- Exterior features: Wood products siding; Deck; Cable TV available; High-speed internet available; Lot is paved; Level topography; Community waterfront / private beach access
Interior
- Kitchen: Dishwasher; Refrigerator; Stove/Range; Kitchen with eating space
- Bedrooms: 4 bedrooms (all on the main level); Primary bedroom (main level)
- Flooring: Vinyl plank flooring; Carpet
- Bathrooms: 2 full bathrooms (both on the main level); 2 bathtubs, 2 showers
- Heating & cooling: Forced air heating; No central air conditioning
- Interior features: Dining room; Water heater
- Laundry & utility: Utility room (main level); Water heater located near back door
Neighborhood map
What this means for you Summary
Snapshot
- This is a 4-bed/2.0-bath manufactured listed at $399k.
Deal economics
- At list price, monthly cash flow is $-113 ($-1k/yr) — negative.
- To cash-flow at today's rent, offer at most $379k (5.0% below list).
- To meet the 1% rule (rent ≥ 1% of price), the offer needs to be $304k (23.9% below list).
- Recommended offer: $304k (23.9% below list) — sets the bar for 1% rule.
- Cap rate 6.0% vs local median 3.7% in McKenna — top-decile yield for the area; either an underpriced asset or a hidden risk that comps aren't pricing in. Stress-test before assuming the spread holds.
Location & tenants
- Location reads 67/100 on livability (#300 in WA) — a middle-class / working-renter tenant base. Strengths: employment A+, housing A+, crime A-; Watch: health & safety C-, amenities F, commute F.
- Yelm School District (rural): math 48% / reading 59% proficiency, ranked #108 of 291 in WA (top 37%) — acceptable for families but not a draw, mixed tenant base, ~2y average lease.
- Zoned schools: Lackamas Elementary (310 students, 55% FRL); Ridgeline Middle School (574 students, 46% FRL); Yelm High School 12 (1,634 students, 45% FRL) — zoned schools average 49% FRL vs 34% district-wide (15 pts higher); higher-poverty schools than district average — tighter screening recommended.
- Market conditions: Rents rising fast (+5.8%/yr); 434 active listings in the ZIP; 2 comparable units currently listed for rent nearby; solid renter incomes; 1,222 units permitted in Thurston County in 2024 (508 in 5+ unit buildings).
- This rent runs 40% of the median local income ($92k/yr) — at the standard rent-burdened threshold; future hikes will face affordability resistance.
Forward outlook
- Local home prices are declining (-3.0%/yr); year-one equity from $3k of loan paydown is wiped out by about $12k of value loss. Plan a longer hold.
- Thurston County population projected at +27% by 2050 — long-run rental-demand tailwind backs the buy-and-hold thesis.
Negotiation context
- It's been on market 212 days — a 12% lower offer ($351k) is reasonable based on typical stale-listing flexibility.
Questions for the listing agent
- What do current leases actually rent for vs. the listed asking? Can we see a recent rent roll and the last 12 months of T-12 income?
- It's been on market 212 days. Have you received any prior offers? Is the seller open to a 24% concession, seller financing, or rate buy-down credit?
- What does the HOA fee cover, when was the last increase, and are there any pending special assessments or reserve-fund shortfalls?
- Why hasn't it sold? Are there any deal-killer items the seller is aware of (foundation, flood, title, zoning, code violations)?
- Is there a deadline driving the sale (1031 exchange, divorce, estate, relocation)? That informs how much negotiation room exists.
- Schools are B-rated — typically a magnet for longer-tenancy family renters. What's the average tenant stay here, and is there a school-zone premium baked into asking?
- The area grade is low — what's the realistic commute time and amenity access for the typical tenant pool here? Any planned neighborhood developments (good or bad) we should know about?
- This sits on a lake — are riparian / water-frontage rights deeded with the parcel? Any dock permits, shoreline easements, or HOA water-use restrictions?
- What's the documented flood / surge / shoreline-erosion history here (FEMA AND non-FEMA — e.g., storm surge, creek backup, septic-field saturation)?
- Any water-quality or seasonal algae-bloom issues that affect tenant satisfaction or short-term-rental demand?
- What's the average days-on-market for RENTAL listings here right now (not sales)? A rising rental-DOM trend means longer vacancies and softer asking-rent achievability than the comps imply.
- What's the recent tenant-quality profile in this submarket — average credit score on applications, eviction rate, late-payment / NSF rate, and stable-employment percentage? A property-management company in the area should have these aggregated.
- How much new for-sale + rental construction is in the pipeline within 1–3 miles? Heavy new supply typically softens prices + rents 12–24 months out; constrained supply supports both.
Investment metrics
- 1% rule
- 0.76% ✗
- Cap rate
- 5.95%
- Cash-on-cash
- -1.21%
- DSCR
- 0.95
- GRM
- 10.9
CMA / ARV
- ARV (on-the-fly)
- $559,289
- Comps found
- 2
Show comp detail 2 sales within ~0.75 mi
| Address | Dist | Beds/Ba | Sqft | Sold | Price | $/sf | Match |
|---|---|---|---|---|---|---|---|
| 18415 Hames St SE | 0.00mi | 4/2.0 | 1,568 (+4%) | 1mo | $393,000 | $251 | 93 |
| 18438 SE Tapaderos st SE SE | 0.04mi | 3/2.0 (-1) | 1,512 (0%) | 7mo | $415,000 | $274 | 87 |
Match score weights: distance 35% · size 25% · config 20% · recency 20%. Top-matched comps best support the ARV.
Projected returns pro-forma
-3.0% appreciation · 5.78% rent growth · sell at horizon
- IRR
- -15.5%
- Equity multiple
- 0.43×
- Total profit
- $-63,229
- Equity at exit
- $59,492
- IRR
- -3.2%
- Equity multiple
- 0.76×
- Total profit
- $-26,812
- Equity at exit
- $34,498
Cash invested: $111,720 (down + closing). Projections, not guarantees.
Landlord ↔ Tenant lean methodology
- Overall (STATE)
- 28 Tenant-Leaning
- State Washington
- 28 Tenant-Leaning · D+8
- County
- — inherits STATE
- City
- — inherits STATE
ZIP-level market 98597
- Rents YoY
- 5.8%
- Active inventory
- 434
- Price-to-rent
- 10.9×
Monthly cashflow live
- Estimated rent
- $3,038 medium interval (Pro) →
- Mortgage (P&I)
- −$2,092
- Tax from tax record
- −$190 /mo · $2,276/yr
- Insurance
- −$166
- HOA
- −$65
- Vacancy / Maint / Mgmt
- −$638
- Net cashflow
- $-113
Break-even live
Sensitivity live
| Price | -10% $113 | -5% $0 | +0% $-113 | +5% $-226 | +10% $-339 |
|---|---|---|---|---|---|
| Rent | -10% $-353 | -5% $-233 | +0% $-113 | +5% $7 | +10% $127 |
| Rate | -1.0pp $88 | -0.5pp $-12 | base $-113 | +0.5pp $-216 | +1.0pp $-322 |
UW: 25.0% down · 7.5% · 30yr · 1.5% tax · 5.0% vac · 8.0% maint · 8.0% mgmt
Financing live
Cash to close
- Down payment
- $99,750
- Closing costs
- $11,970
- Reserves months
- —
- Total cash needed
- —
Loan-product check · same deal, 3 products live
Conventional
25% down · 7.5% · 30yr
- Down + closing
- —
- Monthly P&I
- —
- Monthly cashflow
- —
- DSCR
- —
- Eligible?
- —
Personal DTI + credit; lowest rate.
DSCR
20% down · 8.5% · 30yr
- Down + closing
- —
- Monthly P&I
- —
- Monthly cashflow
- —
- DSCR
- —
- Eligible?
- —
No personal income docs; deal must DSCR.
Hard money
10% down · 12.0% · 12mo
- Down + closing
- —
- Monthly P&I
- —
- Monthly cashflow
- —
- DSCR
- —
- Eligible?
- —
Short-term bridge; refi at stabilization.
Rent comps 2 comps
| Address | Beds | Baths | Sqft | Rent | $/sqft | DOM | Units | Dist |
|---|---|---|---|---|---|---|---|---|
| 18545 Woodside Dr SE Yelm, WA | 3.0 | 2.5 | 1600 | $2,395 | $1.50 | 14d | 1 | 0.48mi |
| 18525 Woodside Dr SE Yelm, WA | 3.0 | 2.0 | 1232 | $2,299 | $1.87 | 14d | 1 | 0.49mi |
HOA detail
- Monthly dues
- $65 · $780/yr
- Likely covers
- landscapingsecurity
Listing history 4 events
-
2026-05-03status Pending
-
2026-03-10price $399,000
-
2026-01-13price $415,000
-
2025-10-03$425,000 Active
ⓘ Source: listings_history table (triggers on properties + properties_extension) + one-shot
backfill from property_details.listing_events for pre-trigger history.
Tax reassessment forecast WA · Resets to sale price
- Current annual tax
- $2,276 · $190/mo
- Projected year-2 tax
- $3,910 · $326/mo
- Expected delta
- +$1,635/yr (+$136/mo · 71.8%)
ⓘ Screening estimate from a state-policy table — verify with the county assessor before closing.
Climate risk First Street
- Flood 1/10 Low FEMA zone X (unshaded) · 0% chance over 30 yrs
- Wildfire 2/10 Low
- Heat 2/10 Low 7 d/yr ≥89°F today · 14 d/yr by 30 yrs out
- Wind 1/10 Low
- Air quality 6/10 Major 7 unhealthy d/yr today · 9 by 30 yrs out
Nearby sold comps map
Loading sold comps map…
Walkable amenities ~0.75 mi
Loading nearby amenities…
Taxation est. · year 1
- Rental income
- $36,458
- − Mortgage interest
- −$22,350
- − Property taxes
- −$2,276
- − Insurance
- −$1,995
- − Repairs & maintenance
- −$2,917
- − Management
- −$2,917
- − HOA
- −$780
- − Depreciation
- −$11,607
- Taxable loss
- −$8,383
- Est. tax savings @ 24.0%
- +$2,012
- After-tax cash flow
- $655/yr
For passive investors: Depreciation is non-cash, so a rental often shows a tax loss while cash-flowing — sheltering income. Rental losses are passive: they offset passive income freely, and up to $25,000/yr can offset ordinary (W-2) income if you actively participate and your MAGI is under $100k (phasing out to $0 by $150k); unused losses carry forward. On sale, claimed depreciation is recaptured at up to 25%, and gains may owe capital-gains tax (a 1031 exchange can defer both). Figures are a year-1 estimate at your 24.0% rate — not tax advice; consult a CPA.
Schools (NCES district)
- District
- Yelm School District
- NCES district ID
- 5310140
- Math proficiency
- 48% ▲ 1.00%
- Reading proficiency
- 59% ▲ 1.00%
- Median HH income
- $58,328
- Composite
- 48.34/100
- National rank
- #4685
- State rank
- #108 of 291 in WA
Livability — McKenna
- Score
- 67/100
- State rank
- #300
- US rank
- #10587
Category grades
Schools grade is shown separately in the Schools card above.
Census & demographics
- County
- Thurston County · 269,345 people
- City population
- 61
- Metro
- Olympia-Lacey-Tumwater, WA
- Population (ZIP)
- 26,669
- Household income
- $92,219
- Rent vs Own
- Severe rent burden
- 259.0
Population outlook (Thurston County) Hauer SSP2
- Today (2025)
- 308,239 people
- By 2030
- 326,483 · +5.9%
- By 2040
- 359,890 · +16.8%
- By 2050
- 391,800 · +27.1%
- By 2075
- 468,024 · +51.8%
- By 2100
- 519,890 · +68.7%
Race, ethnicity, and origin ACS 2023
- Neighborhood character
- Predominantly White (76%)
- Race & ethnicity
- White 76% Two or more races 10% Hispanic / Latino 10% Black 3% Pacific Islander 2% Asian 2%
- Hispanic origin (detail)
- Mexican 7% Puerto Rican 1%
- Common ancestry
- Portuguese 5% Romanian 4% Lithuanian 3%
- Foreign-born
- 7% · Canada, South Korea
- Languages at home
- 90% English-only · Spanish 6% German/W. Germanic 1% Other Asian/Pacific 1%
Political lean MEDSL · Thurston
- 2024 margin
- Strong D (+20.4) · D 58.5% · R 38.1% · Other 3.5%
- 2008→2024 swing
- -1.3pp toward R · 2008: 21.7pp · 2024: 20.4pp
- All cycles
- 2024: D+20.4 2020: D+18.6 2016: D+15.4 2012: D+19.0 2008: D+21.7
Not yet ingested
- Civics
- —
Market trends
- HPI YoY
- ▼ -192.07%
- Current HPI
- 326.4361
- Rent YoY
- ▲ 5.78%
- Metro
- Olympia-Lacey-Tumwater, WA
- State GDP YoY
- ▲ 4.65%
- F500 in state
- 22
Industry mix (Fortune 500 HQ in WA)
| Industry | F500 HQs | Revenue |
|---|---|---|
| Retail | 2 | $269B |
|
||
| Technology / Retail | 1 | $638B |
|
||
| Technology | 1 | $245B |
|
||
| Telecommunications | 1 | $38B |
|
||
| Food / Beverage | 1 | $36B |
|
||
| Automotive / Trucks | 1 | $34B |
|
||
Price history
-6.1% since first listed4 events — show timeline
- 2026-05-03 Pending — NWMLS as Distributed by MLS Grid
- 2026-03-10 Price Changed $399,000 NWMLS as Distributed by MLS Grid
- 2026-01-13 Price Changed $415,000 NWMLS as Distributed by MLS Grid
- 2025-10-03 Listed $425,000 NWMLS as Distributed by MLS Grid
Property tax history
+27.0%/yrLatest (2026): $2,276 · +610.3% YoY. Source: county tax records.
Cash-flow waterfall
monthlySold comps — $/sqft
last 12 mo · ≤1 miLoading sold comps…