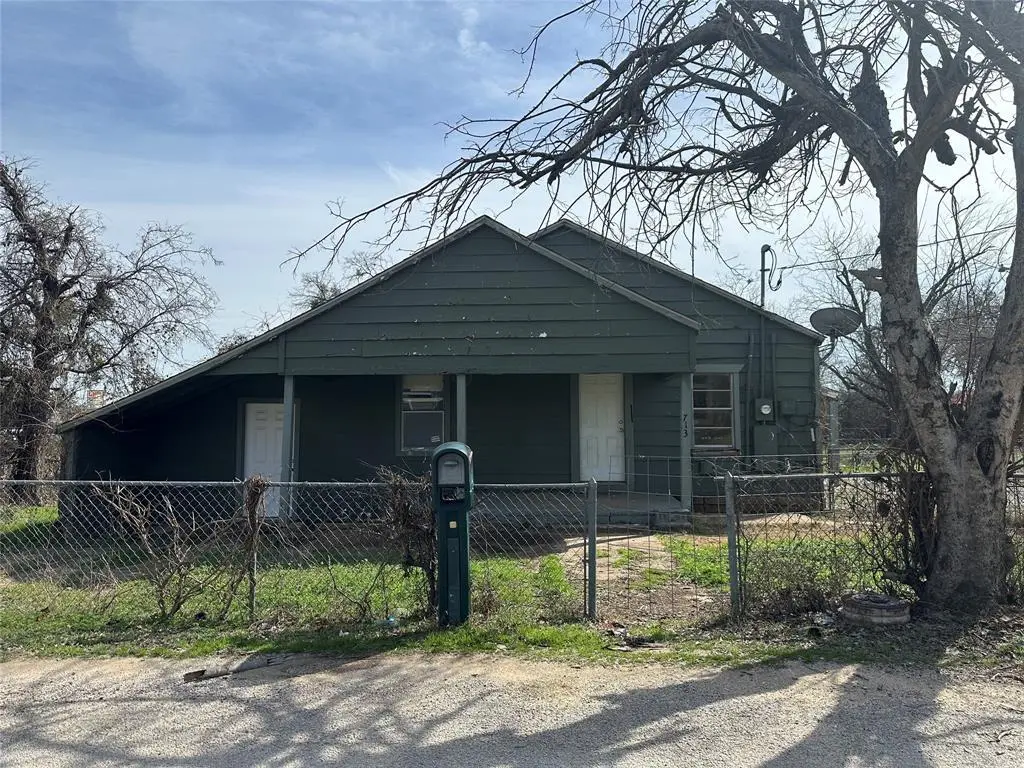
713 Wright Ct · Granbury, TX
Flood risk 1/10 · Minimal
- FEMA flood zone
- X (unshaded)
- Chance of flooding over 30 yrs
- 0.0%
- Est. flood insurance / yr
- $507 – $1,088
Fire risk 6/10 · Moderate
- Est. fire insurance / yr
- $1,222 – $2,270
Heat risk 7/10 · Major
- Hot days now (above 108°F)
- 7 days/yr
- Hot days in 30 yrs
- 24 days/yr
Wind risk 6/10 · Moderate
- Chance of severe wind over 30 yrs
- 27.0%
Air-quality risk 2/10 · Minimal
- Unhealthy air days now
- 1 days/yr
- Unhealthy air days in 30 yrs
- 2 days/yr
Risk factors via First Street. Map © Google.
Why this score? — see what drove the B- grade
The composite is a weighted blend of 9 inputs, each scored 0–100. Each bar is that input's sub-score; the figure is the points it added to the 100-point composite (weight × sub-score).
- Cash flow +30.0/30.0
- DSCR +10.0/10.0
- 1% rule +8.8/10.0
- ARV discount +7.5/15.0
- Schools +4.0/10.0
- Livability +3.3/5.0
- Rent growth +2.8/5.0
- Condition / age +2.5/5.0
- Appreciation +0.0/10.0
$105,000
🖨 Deal sheet 📄 Offer letter ✓ Due diligence
Listing remarks MLS
One of four properties available all sold as is. 3 houses and a vacant lot all on Wright and Roe. Two of the houses are vacant and one is leased. Can be purchased individually or as a package. These properties are outside of the city limits so there are no city taxes. Great location and investment opportunity. Call for more information and pricing for all four properties.
Key facts
- 0.34 acre lot
- Built 1940
- Listed 225 days
Neighborhood map
What this means for you Summary
Snapshot
- This is a 2-bed/1.0-bath land listed at $105k.
Deal economics
- At list price, monthly cash flow is $504 ($6k/yr) — positive.
- The deal already cash-flows at list — no discount required.
- Meets the 1% rule at list price ($1k rent vs $105k).
- Recommended offer: $92k (12.0% below list) — sets the bar for market timing.
- Cap rate 12.1% vs local median 3.8% in Granbury — top-decile yield for the area; either an underpriced asset or a hidden risk that comps aren't pricing in. Stress-test before assuming the spread holds.
Location & tenants
- Location reads 66/100 on livability (#628 in TX) — a middle-class / working-renter tenant base. Strengths: cost of living A+, housing A+, health & safety A+; Watch: employment C-, crime D+, schools D.
- Granbury ISD (town): math 46% / reading 46% proficiency, ranked #237 of 826 in TX (top 29%) — families likely to look elsewhere, expect single-tenant / working-renter base with shorter leases.
- Market conditions: Rents rising (+1.1%/yr); 929 active listings in the ZIP; 8 comparable units currently listed for rent nearby; rentals at typical pace (median 17d on market — plan ~3-4 weeks tenant-placement turnaround); 125 units permitted in Hood County in 2024 (0 in 5+ unit buildings).
Forward outlook
- Local home prices are declining (-3.0%/yr); year-one equity from $726 of loan paydown is wiped out by about $3k of value loss. Plan a longer hold.
- Hood County population projected at +29% by 2050 — long-run rental-demand tailwind backs the buy-and-hold thesis.
- At projected returns (-3.0% appreciation + 1.1% rent growth), your $29k cash investment doubles in ~7 years — after that, you're playing with house money.
Negotiation context
- It's been on market 225 days — a 12% lower offer ($92k) is reasonable based on typical stale-listing flexibility.
- 2 sale attempts since 14y ago; this cycle's ask has dropped $20k (16%) from the opening price — seller is motivated, your offer sets the floor, not the list.
Risks & watch-outs
- Watch-outs: built in 1940 — expect roof / HVAC / electrical / plumbing capex.
- Climate carrying-cost: major wind risk, 27% chance of damaging wind over 30y; major wildfire risk; extreme-heat days projected 7→24/yr by 2055 (HVAC capex compounding) — expect insurance premiums to compound above CPI over the hold.
Questions for the listing agent
- It's been on market 225 days. Have you received any prior offers? Is the seller open to a 12% concession, seller financing, or rate buy-down credit?
- Built in 1940 — when were the roof, HVAC, electrical panel, plumbing, and water heater last replaced?
- Why hasn't it sold? Are there any deal-killer items the seller is aware of (foundation, flood, title, zoning, code violations)?
- Is there a deadline driving the sale (1031 exchange, divorce, estate, relocation)? That informs how much negotiation room exists.
- Schools are D-rated, which usually means shorter tenancies and higher turnover. Who's the typical renter profile here, and what's been the actual vacancy rate?
- Crime grade is D in this area — have there been break-ins, vandalism, or insurance claims at this property in the last 3 years? What carrier currently insures it and at what premium?
- What's the average days-on-market for RENTAL listings here right now (not sales)? A rising rental-DOM trend means longer vacancies and softer asking-rent achievability than the comps imply.
- What's the recent tenant-quality profile in this submarket — average credit score on applications, eviction rate, late-payment / NSF rate, and stable-employment percentage? A property-management company in the area should have these aggregated.
- How much new for-sale + rental construction is in the pipeline within 1–3 miles? Heavy new supply typically softens prices + rents 12–24 months out; constrained supply supports both.
Investment metrics
- 1% rule
- 1.38% ✓
- Cap rate
- 12.05%
- Cash-on-cash
- 20.57%
- DSCR
- 1.92
- GRM
- 6.0
CMA / ARV
- ARV (median comp)
- $213,948
- List price
- $105,000
- Delta
- -50.92%
- Verdict
- UNDERPRICED
- Comps
- 20 within 1.0 mi
Projected returns pro-forma
-3.0% appreciation · 1.1% rent growth · sell at horizon
- IRR
- 10.8%
- Equity multiple
- 1.42×
- Total profit
- $12,323
- Equity at exit
- $15,656
- IRR
- 18.4%
- Equity multiple
- 2.40×
- Total profit
- $41,167
- Equity at exit
- $9,078
Cash invested: $29,400 (down + closing). Projections, not guarantees.
Landlord ↔ Tenant lean methodology
- Overall (STATE)
- 87 Strongly Landlord-Friendly
- State Texas
- 87 Strongly Landlord-Friendly · R+5
- County
- — inherits STATE
- City
- — inherits STATE
ZIP-level market 76048
- Home prices YoY
- -23.4%
- Rents YoY
- 1.1%
- Active inventory
- 929
- Price-to-rent
- 6.0×
Monthly cashflow live
- Estimated rent
- $1,454 high interval (Pro) →
- Mortgage (P&I)
- −$551
- Tax from tax record
- −$50 /mo · $605/yr
- Insurance
- −$44
- HOA
- −$0
- Vacancy / Maint / Mgmt
- −$305
- Net cashflow
- $504
Break-even live
UW: 25.0% down · 7.5% · 30yr · 1.5% tax · 5.0% vac · 8.0% maint · 8.0% mgmt
Financing live
Cash to close
- Down payment
- $26,250
- Closing costs
- $3,150
- Reserves months
- —
- Total cash needed
- —
Loan-product check · same deal, 3 products live
Conventional
25% down · 7.5% · 30yr
- Down + closing
- —
- Monthly P&I
- —
- Monthly cashflow
- —
- DSCR
- —
- Eligible?
- —
Personal DTI + credit; lowest rate.
DSCR
20% down · 8.5% · 30yr
- Down + closing
- —
- Monthly P&I
- —
- Monthly cashflow
- —
- DSCR
- —
- Eligible?
- —
No personal income docs; deal must DSCR.
Hard money
10% down · 12.0% · 12mo
- Down + closing
- —
- Monthly P&I
- —
- Monthly cashflow
- —
- DSCR
- —
- Eligible?
- —
Short-term bridge; refi at stabilization.
Rent comps 8 comps
| Address | Beds | Baths | Sqft | Rent | $/sqft | DOM | Units | Dist |
|---|---|---|---|---|---|---|---|---|
| 900 Elizabeth Blvd Granbury, TX | 3.0 | 1.0 | 1112 | $1,500 | $1.35 | 43d | 1 | 0.48mi |
| 105 W Doyle St Granbury, TX | 2.0 | 1.0 | 980 | $1,675 | $1.71 | 17d | 1 | 0.70mi |
| 1455 Walters Dr Granbury, TX | 2.0 | 1.0 | 792 | $1,000 | $1.26 | 17d | 1 | 0.71mi |
| 1201 W Pearl St Granbury, TX | 1.0–3.0 | 1.0 | 685 | $794 | $1.16 | 1d | 1 | 0.74mi |
| 959 Charterhouse Cir Granbury, TX | 1.0 | 1.0 | 767 | $1,010 | $1.32 | 24d | 1 | 1.02mi |
| 800 Chanel Dr Granbury, TX | 1.0–2.0 | 1.0–2.0 | 1029 | $1,948 | $1.89 | 1d | 10 | 1.23mi |
| 1114 Thorpe Springs Rd Granbury, TX | 2.0 | 1.0 | 920 | $1,500 | $1.63 | 7d | 1 | 1.46mi |
| 1220 Crawford Ct Granbury, TX | 1.0–2.0 | 1.0–2.0 | 968 | $1,739 | $1.80 | 1d | 12 | 1.46mi |
Listing history 20 events
-
2026-06-18days on market $105,000 Active 225 DOM
-
2026-06-17days on market $105,000 Active 224 DOM
-
2026-06-16days on market $105,000 Active 223 DOM
-
2026-06-15days on market $105,000 Active 222 DOM
-
2026-06-13days on market $105,000 Active 220 DOM
-
2026-06-09days on market $105,000 Active 216 DOM
-
2026-06-08days on market $105,000 Active 215 DOM
-
2026-06-07days on market $105,000 Active 214 DOM
-
2026-06-04days on market $105,000 Active 211 DOM
-
2026-06-03days on market $105,000 Active 210 DOM
-
2026-06-02days on market $105,000 Active 209 DOM
-
2026-06-02days on market $105,000 Active 208 DOM
-
2026-05-31days on market $105,000 Active 207 DOM
-
2026-02-28price $105,000 380-char remark
Show marketing remark (380 chars)
One of four properties available all sold as is. 3 houses and a vacant lot all on Wright and Roe. Two of the houses are vacant and one is leased. Can be purchased individually or as a package. These properties are outside of the city limits so there are no city taxes. Great location and investment opportunity. Call for more information and pricing for all four properties.
-
2026-01-09price $115,000 380-char remark
Show marketing remark (380 chars)
One of four properties available all sold as is. 3 houses and a vacant lot all on Wright and Roe. Two of the houses are vacant and one is leased. Can be purchased individually or as a package. These properties are outside of the city limits so there are no city taxes. Great location and investment opportunity. Call for more information and pricing for all four properties.
-
2025-11-05$125,000 Active 380-char remark
Show marketing remark (380 chars)
One of four properties available all sold as is. 3 houses and a vacant lot all on Wright and Roe. Two of the houses are vacant and one is leased. Can be purchased individually or as a package. These properties are outside of the city limits so there are no city taxes. Great location and investment opportunity. Call for more information and pricing for all four properties.
-
2012-06-19soldstatus
-
2012-04-18historical
-
2012-02-22$30,000 Active
-
1993-04-21soldstatus
ⓘ Source: listings_history table (triggers on properties + properties_extension) + one-shot
backfill from property_details.listing_events for pre-trigger history.
Tax reassessment forecast TX · Resets to sale price
- Current annual tax
- $605 · $50/mo
- Projected year-2 tax
- $1,922 · $160/mo
- Expected delta
- +$1,317/yr (+$110/mo · 217.8%)
ⓘ Screening estimate from a state-policy table — verify with the county assessor before closing.
Climate risk First Street
- Flood 1/10 Low FEMA zone X (unshaded) · 0% chance over 30 yrs
- Wildfire 6/10 Major
- Heat 7/10 Severe 7 d/yr ≥108°F today · 24 d/yr by 30 yrs out
- Wind 6/10 Major 27% chance of damaging wind over 30 yrs
- Air quality 2/10 Low 1 unhealthy d/yr today · 2 by 30 yrs out
Nearby sold comps map
Loading sold comps map…
Walkable amenities ~0.75 mi
Loading nearby amenities…
Taxation est. · year 1
- Rental income
- $17,448
- − Mortgage interest
- −$5,882
- − Property taxes
- −$605
- − Insurance
- −$525
- − Repairs & maintenance
- −$1,396
- − Management
- −$1,396
- − Depreciation
- −$3,055
- Taxable income
- $4,590
- Est. tax owed @ 24.0%
- −$1,102
- After-tax cash flow
- $4,945/yr
For passive investors: Depreciation is non-cash, so a rental often shows a tax loss while cash-flowing — sheltering income. Rental losses are passive: they offset passive income freely, and up to $25,000/yr can offset ordinary (W-2) income if you actively participate and your MAGI is under $100k (phasing out to $0 by $150k); unused losses carry forward. On sale, claimed depreciation is recaptured at up to 25%, and gains may owe capital-gains tax (a 1031 exchange can defer both). Figures are a year-1 estimate at your 24.0% rate — not tax advice; consult a CPA.
Schools (NCES district)
- District
- Granbury ISD
- NCES district ID
- 4821390
- Math proficiency
- 46% ▬ 0.00%
- Reading proficiency
- 46% ▲ 4.00%
- Median HH income
- $55,856
- Composite
- 40.04/100
- National rank
- #3820
- State rank
- #237 of 826 in TX
Livability — Granbury
- Score
- 66/100
- State rank
- #628
- US rank
- #11998
Category grades
Schools grade is shown separately in the Schools card above.
Census & demographics
- County
- Hood County · 58,506 people
- City population
- 58,506
- Metro
- Granbury, TX
- Population (ZIP)
- 27,000
- Household income
- $70,346
- Rent vs Own
- Severe rent burden
- 612.0
Population outlook (Hood County) Hauer SSP2
- Today (2025)
- 63,502 people
- By 2030
- 67,459 · +6.2%
- By 2040
- 74,958 · +18.0%
- By 2050
- 81,922 · +29.0%
- By 2075
- 98,872 · +55.7%
- By 2100
- 107,796 · +69.8%
Race, ethnicity, and origin ACS 2023
- Neighborhood character
- Predominantly White (80%)
- Race & ethnicity
- White 80% Hispanic / Latino 14% Two or more races 11% Black 1%
- Hispanic origin (detail)
- Mexican 13%
- Common ancestry
- Italian 2% Slovak 2% Portuguese 1%
- Foreign-born
- 4% · Canada
- Languages at home
- 89% English-only · Spanish 10%
Political lean MEDSL · Hood
- 2024 margin
- Solid R (+66.0) · D 16.6% · R 82.6%
- 2008→2024 swing
- -11.9pp toward R · 2008: -54.0pp · 2024: -66.0pp
- All cycles
- 2024: R+66.0 2020: R+64.1 2016: R+66.5 2012: R+64.7 2008: R+54.0
Not yet ingested
- Civics
- —
Market trends
- HPI YoY
- ▼ -83.25%
- Current HPI
- 272.2126
- Rent YoY
- ▲ 1.10%
- Metro
- Granbury, TX
- State GDP YoY
- ▲ 3.95%
- F500 in state
- 110
Industry mix (Fortune 500 HQ in TX)
| Industry | F500 HQs | Revenue |
|---|---|---|
| Energy | 16 | $1,198B |
|
||
| Technology | 5 | $198B |
|
||
| Engineering / Construction | 4 | $72B |
|
||
| Energy Services | 3 | $60B |
|
||
| Utilities | 3 | $41B |
|
||
| Healthcare | 2 | $330B |
|
||
Price history
+250.0% since first listed7 events — show timeline
- 2026-02-28 Price Changed $105,000 NTREIS
- 2026-01-09 Price Changed $115,000 NTREIS
- 2025-11-05 Listed $125,000 NTREIS
- 2012-06-19 Sold (Public Records) — Public Records
- 2012-04-18 Listing Removed — NTREIS
- 2012-02-22 Listed $30,000 NTREIS
- 1993-04-21 Sold (Public Records) — Public Records
Property tax history
+1.9%/yrLatest (2025): $605 · +0.8% YoY. Source: county tax records.
Cash-flow waterfall
monthlySold comps — $/sqft
last 12 mo · ≤1 miLoading sold comps…