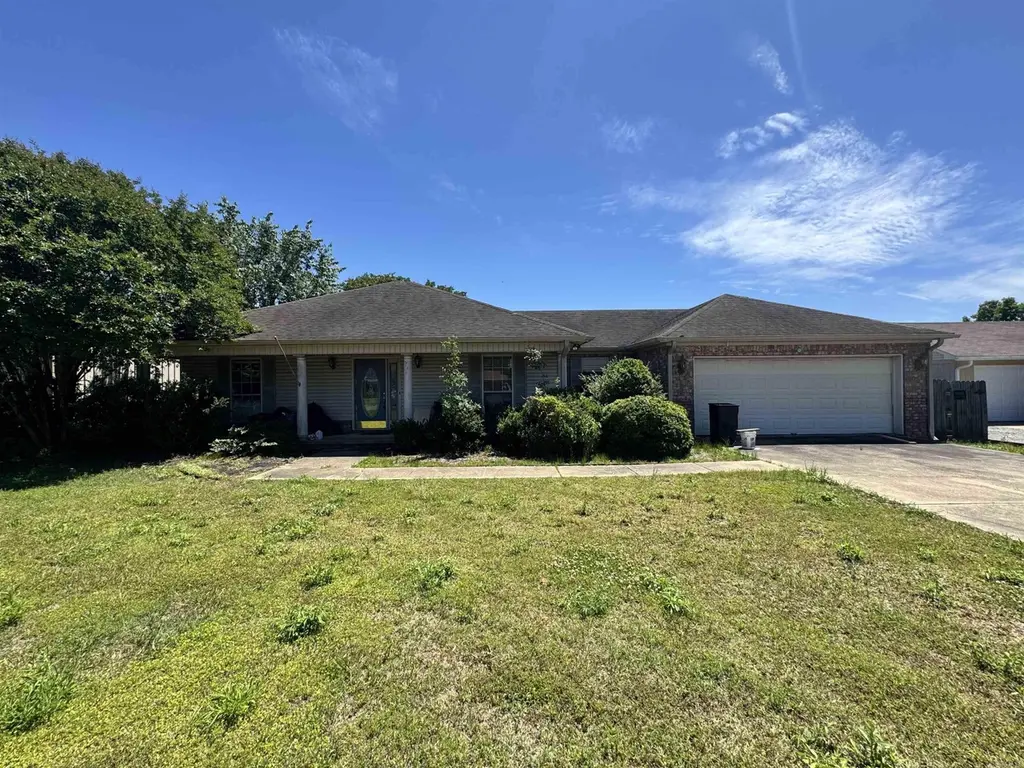
115 Schafer Dr · Carlisle, AR
Flood risk 1/10 · Minimal
- FEMA flood zone
- X (unshaded)
- Chance of flooding over 30 yrs
- 0.0%
- Est. flood insurance / yr
- $507 – $1,088
Fire risk 1/10 · Minimal
- Est. fire insurance / yr
- $1,499 – $2,785
Heat risk 7/10 · Major
- Hot days now (above 109°F)
- 7 days/yr
- Hot days in 30 yrs
- 20 days/yr
Wind risk 4/10 · Minor
- Chance of severe wind over 30 yrs
- 13.0%
Air-quality risk 1/10 · Minimal
- Unhealthy air days now
- 0 days/yr
- Unhealthy air days in 30 yrs
- 0 days/yr
Risk factors via First Street. Map © Google.
Why this score? — see what drove the B- grade
The composite is a weighted blend of 9 inputs, each scored 0–100. Each bar is that input's sub-score; the figure is the points it added to the 100-point composite (weight × sub-score).
- Cash flow +24.0/30.0
- ARV discount +15.0/15.0
- DSCR +7.7/10.0
- 1% rule +6.1/10.0
- Appreciation +6.1/10.0
- Livability +2.9/5.0
- Rent growth +2.5/5.0
- Condition / age +2.5/5.0
- Schools +2.2/10.0
$110,000
🖨 Deal sheet 📄 Offer letter ✓ Due diligence
Listing remarks
INVESTORS! FIXER UPPER! Charming fixer-upper in a great neighborhood! This 3-bedroom, 2-bath home offers great potential with solid bones and plenty of space to make it your own. Features include a bright sunroom perfect for relaxing or entertaining, spacious living areas, and a desirable location surrounded by well-kept homes. Whether you’re an investor or a buyer looking to add your personal touch, this property is full of opportunity.
Key facts
- Bright sunroom
- Garage
- Built 1999
Tags
Property features AI
Finance
- Financial info: Financing available: conventional loan or cash
Exterior
- Parking: Garage
- Utilities: Public water
- Home design: Brick and frame exterior
- Construction: Composition roof; Slab foundation
- Exterior features: Level lot; Paved road access
Interior
- Kitchen: Microwave
- Flooring: Carpet; Tile; Luxury vinyl
- Bathrooms: 2 full bathrooms
- Heating & cooling: Central electric cooling
- Interior features: Carpet, tile and luxury vinyl flooring; Sun room
- Laundry & utility: Laundry room
Neighborhood map
What this means for you Summary
Snapshot
- This is a 3-bed/2.0-bath single-family listed at $110k.
Deal economics
- At list price, monthly cash flow is $215 ($3k/yr) — positive.
- The deal already cash-flows at list — no discount required.
- Meets the 1% rule at list price ($1k rent vs $110k).
Location & tenants
- Location reads 57/100 on livability (#338 in AR) — a working-class tenant base; expect higher turnover. Strengths: cost of living A+, housing A-; Watch: crime D, schools F, amenities F.
- Carlisle School District (rural): math 26% / reading 26% proficiency, ranked #177 of 238 in AR (top 74%) — low school quality limits family demand, transient renter base, plan for 1-2y turnover.
- Market conditions: 15 active listings in the ZIP; 185 units permitted in Lonoke County in 2024 (0 in 5+ unit buildings).
Forward outlook
- In year one you build about $3k of equity ($761 loan paydown + $3k appreciation (2.3% local appreciation)).
- Lonoke County population projected at +12% by 2050 — modest demand growth; plan on rents tracking national, not racing it.
- At projected returns (2.3% appreciation + 3.0% rent growth), your $31k cash investment doubles in ~5 years — after that, you're playing with house money.
- By year 10, paydown + projected appreciation supports a ~$32k cash-out refi (75% LTV) — recoverable capital for the next deal without selling this one.
Negotiation context
- Only 10 days on market — expect competitive offers; lowballing is unlikely to land.
Risks & watch-outs
- Climate carrying-cost: extreme-heat days projected 7→20/yr by 2055 (HVAC capex compounding) — expect insurance premiums to compound above CPI over the hold.
Questions for the listing agent
- Is there a deadline driving the sale (1031 exchange, divorce, estate, relocation)? That informs how much negotiation room exists.
- Schools are F-rated, which usually means shorter tenancies and higher turnover. Who's the typical renter profile here, and what's been the actual vacancy rate?
- Crime grade is D in this area — have there been break-ins, vandalism, or insurance claims at this property in the last 3 years? What carrier currently insures it and at what premium?
- What's the average days-on-market for RENTAL listings here right now (not sales)? A rising rental-DOM trend means longer vacancies and softer asking-rent achievability than the comps imply.
- What's the recent tenant-quality profile in this submarket — average credit score on applications, eviction rate, late-payment / NSF rate, and stable-employment percentage? A property-management company in the area should have these aggregated.
- How much new for-sale + rental construction is in the pipeline within 1–3 miles? Heavy new supply typically softens prices + rents 12–24 months out; constrained supply supports both.
Investment metrics
- 1% rule
- 1.11% ✓
- Cap rate
- 8.63%
- Cash-on-cash
- 8.36%
- DSCR
- 1.37
- GRM
- 7.5
CMA / ARV
- ARV (median comp)
- $169,312
- List price
- $110,000
- Delta
- -35.03%
- Verdict
- UNDERPRICED
- Comps
- 20 within 1.0 mi
Show comp detail 9 sales within ~0.75 mi
| Address | Dist | Beds/Ba | Sqft | Sold | Price | $/sf | Match |
|---|---|---|---|---|---|---|---|
| 115 Schafer Dr | 0.00mi | 3/2.0 | 2,026 (0%) | 0mo | $110,000 | $54 | 100 |
| 42 Schafer Dr | 0.21mi | 3/2.0 | 2,072 (+2%) | 18mo | $180,000 | $87 | 71 |
| 307 E 5th | 0.56mi | 4/2.0 (+1) | 2,103 (+4%) | 4mo | $205,500 | $98 | 59 |
| 1112 E 3rd St | 0.43mi | 3/2.0 | 1,809 (-11%) | 13mo | $105,000 | $58 | 52 |
| 701 N Center St | 0.65mi | 3/2.0 | 2,192 (+8%) | 20mo | $194,000 | $89 | 39 |
| 115 E 4th St | 0.59mi | 3/2.0 | 2,308 (+14%) | 16mo | $105,000 | $45 | 36 |
| 113 W 3rd | 0.61mi | 3/2.0 | 2,235 (+10%) | 22mo | $214,000 | $96 | 36 |
| 3 Eastwood | 0.64mi | 4/3.0 (+1) | 1,922 (-5%) | 20mo | $164,000 | $85 | 36 |
| 504 E 6th St | 0.61mi | 3/3.0 | 1,876 (-7%) | 24mo | $170,000 | $91 | 35 |
Match score weights: distance 35% · size 25% · config 20% · recency 20%. Top-matched comps best support the ARV.
Projected returns pro-forma
2.29% appreciation · 3.0% rent growth · sell at horizon
- IRR
- 13.5%
- Equity multiple
- 1.74×
- Total profit
- $22,856
- Equity at exit
- $45,130
- IRR
- 15.9%
- Equity multiple
- 3.19×
- Total profit
- $67,468
- Equity at exit
- $66,354
Cash invested: $30,800 (down + closing). Projections, not guarantees.
Landlord ↔ Tenant lean methodology
- Overall (STATE)
- 92 Strongly Landlord-Friendly
- State Arkansas
- 92 Strongly Landlord-Friendly · R+14
- County
- — inherits STATE
- City
- — inherits STATE
ZIP-level market 72024
- Home prices YoY
- 1.5%
- Active inventory
- 15
- Price-to-rent
- 7.5×
Monthly cashflow live
- Estimated rent
- $1,224 medium interval (Pro) →
- Mortgage (P&I)
- −$577
- Tax from tax record
- −$130 /mo · $1,554/yr
- Insurance
- −$46
- HOA
- −$0
- Vacancy / Maint / Mgmt
- −$257
- Net cashflow
- $215
Break-even live
UW: 25.0% down · 7.5% · 30yr · 1.5% tax · 5.0% vac · 8.0% maint · 8.0% mgmt
Financing live
Cash to close
- Down payment
- $27,500
- Closing costs
- $3,300
- Reserves months
- —
- Total cash needed
- —
Loan-product check · same deal, 3 products live
Conventional
25% down · 7.5% · 30yr
- Down + closing
- —
- Monthly P&I
- —
- Monthly cashflow
- —
- DSCR
- —
- Eligible?
- —
Personal DTI + credit; lowest rate.
DSCR
20% down · 8.5% · 30yr
- Down + closing
- —
- Monthly P&I
- —
- Monthly cashflow
- —
- DSCR
- —
- Eligible?
- —
No personal income docs; deal must DSCR.
Hard money
10% down · 12.0% · 12mo
- Down + closing
- —
- Monthly P&I
- —
- Monthly cashflow
- —
- DSCR
- —
- Eligible?
- —
Short-term bridge; refi at stabilization.
Listing history 5 events
-
2026-05-18status Under Contract 448-char remark
-
2026-05-08$110,000 New Listing 448-char remark
-
2012-08-10soldstatus $145,000
-
2007-08-13soldstatus $150,000
-
2005-04-08soldstatus $145,000
ⓘ Source: listings_history table (triggers on properties + properties_extension) + one-shot
backfill from property_details.listing_events for pre-trigger history.
Tax reassessment forecast AR · Resets to sale price
- Current annual tax
- $1,554 · $130/mo
- Projected year-2 tax
- $1,554 · $130/mo
- Expected delta
- $0/yr ($0/mo · 0.0%)
ⓘ Screening estimate from a state-policy table — verify with the county assessor before closing.
Climate risk First Street
- Flood 1/10 Low FEMA zone X (unshaded) · 0% chance over 30 yrs
- Wildfire 1/10 Low
- Heat 7/10 Severe 7 d/yr ≥109°F today · 20 d/yr by 30 yrs out
- Wind 4/10 Moderate 13% chance of damaging wind over 30 yrs
- Air quality 1/10 Low 0 unhealthy d/yr today · 0 by 30 yrs out
Nearby sold comps map
Loading sold comps map…
Walkable amenities ~0.75 mi
Loading nearby amenities…
Taxation est. · year 1
- Rental income
- $14,685
- − Mortgage interest
- −$6,162
- − Property taxes
- −$1,554
- − Insurance
- −$550
- − Repairs & maintenance
- −$1,175
- − Management
- −$1,175
- − Depreciation
- −$3,200
- Taxable income
- $869
- Est. tax owed @ 24.0%
- −$209
- After-tax cash flow
- $2,366/yr
For passive investors: Depreciation is non-cash, so a rental often shows a tax loss while cash-flowing — sheltering income. Rental losses are passive: they offset passive income freely, and up to $25,000/yr can offset ordinary (W-2) income if you actively participate and your MAGI is under $100k (phasing out to $0 by $150k); unused losses carry forward. On sale, claimed depreciation is recaptured at up to 25%, and gains may owe capital-gains tax (a 1031 exchange can defer both). Figures are a year-1 estimate at your 24.0% rate — not tax advice; consult a CPA.
Schools (NCES district)
- District
- Carlisle School District
- NCES district ID
- 0503960
- Math proficiency
- 26% ▼ -13.00%
- Reading proficiency
- 26% ▼ -14.00%
- Median HH income
- $44,474
- Composite
- 22.37/100
- National rank
- #8119
- State rank
- #177 of 238 in AR
Livability — Carlisle
- Score
- 57/100
- State rank
- #338
- US rank
- #21691
Category grades
Schools grade is shown separately in the Schools card above.
Census & demographics
- Census place
- Carlisle, AR
- Population (ZIP)
- 4,142
Population outlook (Lonoke County) Hauer SSP2
- Today (2025)
- 78,072 people
- By 2030
- 80,673 · +3.3%
- By 2040
- 84,977 · +8.8%
- By 2050
- 87,778 · +12.4%
- By 2075
- 91,398 · +17.1%
- By 2100
- 87,858 · +12.5%
Race, ethnicity, and origin ACS 2023
- Neighborhood character
- Predominantly White (90%)
- Race & ethnicity
- White 90% Black 6% Two or more races 4%
- Common ancestry
- Romanian 2% Lithuanian 2% Slovak 1%
- Foreign-born
- 0% · Canada
Political lean MEDSL · Lonoke
- 2024 margin
- Solid R (+53.7) · D 22.2% · R 75.8% · Other 2.0%
- 2008→2024 swing
- -6.2pp toward R · 2008: -47.5pp · 2024: -53.7pp
- All cycles
- 2024: R+53.7 2020: R+52.8 2016: R+53.3 2012: R+50.9 2008: R+47.5
Not yet ingested
- Civics
- —
Market trends
- HPI YoY
- ▲ 2.29%
- Current HPI
- 156.5743
- Rent YoY
- —
- Metro
- —
- State GDP YoY
- ▲ 3.80%
- F500 in state
- 10
Industry mix (Fortune 500 HQ in AR)
| Industry | F500 HQs | Revenue |
|---|---|---|
| Retail | 1 | $681B |
|
||
| Food / Agriculture | 1 | $53B |
|
||
| Retail / Energy | 1 | $22B |
|
||
| Transportation / Logistics | 1 | $12B |
|
||
| Energy | 1 | $4B |
|
||
Price history
-24.1% since first listed6 events — show timeline
- 2026-06-09 Sold (MLS) $110,000 CARMLS
- 2026-05-18 Pending — CARMLS
- 2026-05-08 Listed $110,000 CARMLS
- 2012-08-10 Sold (Public Records) $145,000 Public Records
- 2007-08-13 Sold (Public Records) $150,000 Public Records
- 2005-04-08 Sold (Public Records) $145,000 Public Records
Property tax history
+0.1%/yrLatest (2025): $1,554 · +0.0% YoY. Source: county tax records.
Cash-flow waterfall
monthlySold comps — $/sqft
last 12 mo · ≤1 miLoading sold comps…