439 Hayground Rd · Bridgehampton, NY
Flood risk 1/10 · Minimal
- FEMA flood zone
- X (unshaded)
- Chance of flooding over 30 yrs
- 0.0%
- Est. flood insurance / yr
- $473 – $860
Fire risk 3/10 · Minor
- Est. fire insurance / yr
- $691 – $1,283
Heat risk 5/10 · Moderate
- Hot days now (above 90°F)
- 7 days/yr
- Hot days in 30 yrs
- 19 days/yr
Wind risk 8/10 · Major
- Chance of severe wind over 30 yrs
- 80.0%
Air-quality risk 3/10 · Minor
- Unhealthy air days now
- 3 days/yr
- Unhealthy air days in 30 yrs
- 3 days/yr
Risk factors via First Street. Map © Google.
Why this score? — see what drove the A- grade
The composite is a weighted blend of 9 inputs, each scored 0–100. Each bar is that input's sub-score; the figure is the points it added to the 100-point composite (weight × sub-score).
- Cash flow +30.0/30.0
- 1% rule +10.0/10.0
- DSCR +10.0/10.0
- Appreciation +9.3/10.0
- ARV discount +7.5/15.0
- Rent growth +5.0/5.0
- Schools +4.8/10.0
- Livability +3.1/5.0
- Condition / age +2.5/5.0
$2,250,000
🖨 Deal sheet (PDF) 📄 Offer letter ✓ Due diligence
Listing remarks
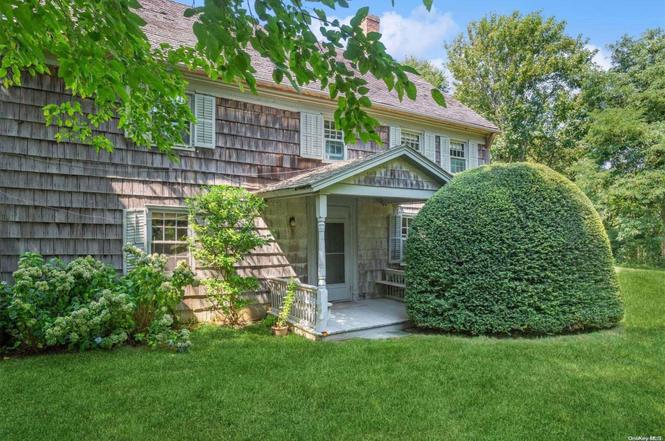
Historic Opportunity This residence in Water Mill was constructed circa 1720, prior to the inception of the United States of America, as one of the original farmhouses sitting on hundreds of acres on the East End. Available for the first time in more than thirty years, it is ready for the special buyer who will breathe life into this amazing property for its next 300 years of existence. Being sold with the condition of it being landmarked, it offers a great template for a creative hand to infuse modern amenities within its rustic character. Possibilities include obtaining status as a guest house and / or being granted a historic credit for the creation of a landmark easement. This one-acre
Key facts
- Historic credit
- Landmarked property
- Original farmhouse
Tags
Neighborhood map
What this means for you Summary
Snapshot
- This is a 4-bed/2.0-bath single-family listed at $2.25M.
Deal economics
- At list price, monthly cash flow is $28k ($331k/yr) — positive.
- The deal already cash-flows at list — no discount required.
- Meets the 1% rule at list price ($52k rent vs $2.25M).
- Recommended offer: $2.22M (1.5% below list) — sets the bar for market timing.
Location & tenants
- Location reads 62/100 on livability (#874 in NY) — a middle-class / working-renter tenant base. Strengths: crime A+, employment A+; Watch: amenities F, commute F, cost of living F.
- Southampton Union Free School District (suburban): math 53% / reading 51% proficiency, ranked #293 of 590 in NY (top 50%) — acceptable for families but not a draw, mixed tenant base, ~2y average lease.
- Zoned schools: Southampton High School (math 98%, 595 students, 48% FRL) — zoned schools average 48% FRL vs 30% district-wide (17 pts higher); higher-poverty schools than district average — tighter screening recommended.
- Market conditions: Rents rising fast (+30.1%/yr); 52 active listings in the ZIP; high-income renter base; 1,366 units permitted in Suffolk County in 2024 (216 in 5+ unit buildings).
- At $51,965/mo this rent would consume 346% of the median local household income ($180k/yr) — very limited rent-growth headroom before tenants either downsize or default.
Forward outlook
- In year one you build about $210k of equity ($16k loan paydown + $194k appreciation (8.6% local appreciation)).
- Suffolk County population projected to shrink 5% by 2050 — rents likely to lag national; underwrite the cash flow, not the appreciation.
- At projected returns (8.6% appreciation + 8.0% rent growth), your $630k cash investment doubles in ~2 years — after that, you're playing with house money.
- By year 2, paydown + projected appreciation supports a ~$336k cash-out refi (75% LTV) — recoverable capital for the next deal without selling this one.
Negotiation context
- It's been on market 21 days — a 2% lower offer ($2.22M) is reasonable based on typical stale-listing flexibility.
Risks & watch-outs
- Watch-outs: built in 1720 — expect roof / HVAC / electrical / plumbing capex.
- Climate carrying-cost: severe wind risk, 80% chance of damaging wind over 30y; extreme-heat days projected 7→19/yr by 2055 (HVAC capex compounding) — expect insurance premiums to compound above CPI over the hold.
Questions for the listing agent
- Built in 1720 — when were the roof, HVAC, electrical panel, plumbing, and water heater last replaced?
- Is there a deadline driving the sale (1031 exchange, divorce, estate, relocation)? That informs how much negotiation room exists.
- Schools are B-rated — typically a magnet for longer-tenancy family renters. What's the average tenant stay here, and is there a school-zone premium baked into asking?
- What's the average days-on-market for RENTAL listings here right now (not sales)? A rising rental-DOM trend means longer vacancies and softer asking-rent achievability than the comps imply.
- What's the recent tenant-quality profile in this submarket — average credit score on applications, eviction rate, late-payment / NSF rate, and stable-employment percentage? A property-management company in the area should have these aggregated.
- How much new for-sale + rental construction is in the pipeline within 1–3 miles? Heavy new supply typically softens prices + rents 12–24 months out; constrained supply supports both.
Investment metrics
- 1% rule
- 2.31% ✓
- Cap rate
- 21.01%
- Cash-on-cash
- 52.55%
- DSCR
- 3.34
- GRM
- 3.6
CMA / ARV
No comps found within radius.
Projected returns pro-forma
8.63% appreciation · 8.0% rent growth · sell at horizon
- IRR
- 68.0%
- Equity multiple
- 5.84×
- Total profit
- $3,049,683
- Equity at exit
- $1,806,875
- IRR
- 64.7%
- Equity multiple
- 14.08×
- Total profit
- $8,241,536
- Equity at exit
- $3,683,830
Cash invested: $630,000 (down + closing). Projections, not guarantees.
Landlord ↔ Tenant lean methodology
- Overall (STATE)
- 15 Strongly Tenant-Friendly
- State New York
- 15 Strongly Tenant-Friendly · D+10
- County
- — inherits STATE
- City
- — inherits STATE
ZIP-level market 11976
- Home prices YoY
- 1.6%
- Rents YoY
- 30.1%
- Active inventory
- 52
- Price-to-rent
- 3.6×
Monthly cashflow live
- Estimated rent
- $51,965 medium interval (Pro) →
- Mortgage (P&I)
- −$11,799
- Tax from tax record
- −$728 /mo · $8,741/yr
- Insurance
- −$938
- HOA
- −$0
- Vacancy / Maint / Mgmt
- −$10,913
- Net cashflow
- $27,587
Break-even live
Sensitivity live
| Price | -10% $28,861 | -5% $28,224 | +0% $27,587 | +5% $26,950 | +10% $26,314 |
|---|---|---|---|---|---|
| Rent | -10% $23,482 | -5% $25,535 | +0% $27,587 | +5% $29,640 | +10% $31,692 |
| Rate | -1.0pp $28,720 | -0.5pp $28,159 | base $27,587 | +0.5pp $27,004 | +1.0pp $26,411 |
UW: 25.0% down · 7.5% · 30yr · 1.5% tax · 5.0% vac · 8.0% maint · 8.0% mgmt
Financing live
Cash to close
- Down payment
- $562,500
- Closing costs
- $67,500
- Reserves months
- —
- Total cash needed
- —
Loan-product check · same deal, 3 products live
Conventional
25% down · 7.5% · 30yr
- Down + closing
- —
- Monthly P&I
- —
- Monthly cashflow
- —
- DSCR
- —
- Eligible?
- —
Personal DTI + credit; lowest rate.
DSCR
20% down · 8.5% · 30yr
- Down + closing
- —
- Monthly P&I
- —
- Monthly cashflow
- —
- DSCR
- —
- Eligible?
- —
No personal income docs; deal must DSCR.
Hard money
10% down · 12.0% · 12mo
- Down + closing
- —
- Monthly P&I
- —
- Monthly cashflow
- —
- DSCR
- —
- Eligible?
- —
Short-term bridge; refi at stabilization.
Listing history 2 events
-
2024-10-15status Pending
-
2024-09-24$2,250,000 Active
ⓘ Source: listings_history table (triggers on properties + properties_extension) + one-shot
backfill from property_details.listing_events for pre-trigger history.
Tax reassessment forecast NY · Partial reset (capped growth)
- Current annual tax
- $8,741 · $728/mo
- Projected year-2 tax
- $23,383 · $1,949/mo
- Expected delta
- +$14,642/yr (+$1,220/mo · 167.5%)
ⓘ Screening estimate from a state-policy table — verify with the county assessor before closing.
Climate risk First Street
- Flood 1/10 Low FEMA zone X (unshaded) · 0% chance over 30 yrs
- Wildfire 3/10 Moderate
- Heat 5/10 Major 7 d/yr ≥90°F today · 19 d/yr by 30 yrs out
- Wind 8/10 Severe 80% chance of damaging wind over 30 yrs
- Air quality 3/10 Moderate 3 unhealthy d/yr today · 3 by 30 yrs out
Nearby sold comps map
Loading sold comps map…
Walkable amenities ~0.75 mi
Loading nearby amenities…
Taxation est. · year 1
- Rental income
- $623,580
- − Mortgage interest
- −$126,035
- − Property taxes
- −$8,741
- − Insurance
- −$11,250
- − Repairs & maintenance
- −$49,886
- − Management
- −$49,886
- − Depreciation
- −$65,455
- Taxable income
- $312,327
- Est. tax owed @ 24.0%
- −$74,958
- After-tax cash flow
- $256,088/yr
For passive investors: Depreciation is non-cash, so a rental often shows a tax loss while cash-flowing — sheltering income. Rental losses are passive: they offset passive income freely, and up to $25,000/yr can offset ordinary (W-2) income if you actively participate and your MAGI is under $100k (phasing out to $0 by $150k); unused losses carry forward. On sale, claimed depreciation is recaptured at up to 25%, and gains may owe capital-gains tax (a 1031 exchange can defer both). Figures are a year-1 estimate at your 24.0% rate — not tax advice; consult a CPA.
Schools (NCES district)
- District
- Southampton Union Free School District
- NCES district ID
- 3627540
- Math proficiency
- 53% ▬ 0.00%
- Reading proficiency
- 51% ▲ 4.00%
- Median HH income
- $85,977
- Composite
- 47.9/100
- National rank
- #2213
- State rank
- #293 of 590 in NY
Livability — Bridgehampton
- Score
- 62/100
- State rank
- #874
- US rank
- #16891
Category grades
Schools grade is shown separately in the Schools card above.
Census & demographics
- Census place
- Bridgehampton, NY
- County
- Suffolk County · 679,920 people
- City population
- 725
- Metro
- New York-Newark-Jersey City, NY-NJ-PA
- Population (ZIP)
- 2,952
- Household income
- $180,250
- Rent vs Own
Population outlook (Suffolk County) Hauer SSP2
- Today (2025)
- 1,505,262 people
- By 2030
- 1,498,318 · -0.5%
- By 2040
- 1,471,101 · -2.3%
- By 2050
- 1,424,848 · -5.3%
- By 2075
- 1,337,157 · -11.2%
- By 2100
- 1,217,720 · -19.1%
Race, ethnicity, and origin ACS 2023
- Neighborhood character
- Predominantly White (87%)
- Race & ethnicity
- White 87% Hispanic / Latino 9% Two or more races 9% Asian 2%
- Hispanic origin (detail)
- Mexican 1% Salvadoran 2%
- Common ancestry
- Romanian 16% Scotch-Irish 7% Italian 3%
- Foreign-born
- 11% · Canada, China
- Languages at home
- 86% English-only · Spanish 7% Other Indo-European 4% German/W. Germanic 1%
Political lean MEDSL · Suffolk
- 2024 margin
- Lean R (+10.0) · D 45.0% · R 55.0%
- 2008→2024 swing
- -16.0pp toward R · 2008: 6.0pp · 2024: -10.0pp
- All cycles
- 2024: R+10.0 2020: R+0.0 2016: R+8.2 2012: D+2.9 2008: D+6.0
Not yet ingested
- Civics
- —
Market trends
- HPI YoY
- ▲ 8.63%
- Current HPI
- 540.0967
- Rent YoY
- ▲ 30.05%
- Metro
- New York-Newark-Jersey City, NY-NJ-PA
- State GDP YoY
- ▲ 2.60%
- F500 in state
- 92
Industry mix (Fortune 500 HQ in NY)
| Industry | F500 HQs | Revenue |
|---|---|---|
| Financial Services | 10 | $950B |
|
||
| Consumer Goods | 9 | $162B |
|
||
| Insurance | 4 | $225B |
|
||
| Telecommunications | 2 | $144B |
|
||
| Pharmaceuticals | 2 | $112B |
|
||
| Media / Entertainment | 2 | $69B |
|
||
Price history
2 events — show timeline
- 2024-10-15 Pending — OneKey® MLS as Distributed by MLS Grid
- 2024-09-24 Listed $2,250,000 OneKey® MLS as Distributed by MLS Grid
Property tax history
+4.4%/yrLatest (2022): $8,741 · +0.0% YoY. Source: county tax records.
Cash-flow waterfall
monthlySold comps — $/sqft
last 12 mo · ≤1 miLoading sold comps…