1894 Elizabeth Ln · Mount Dora, FL
Flood risk 1/10 · Minimal
- FEMA flood zone
- X (unshaded)
- Chance of flooding over 30 yrs
- 0.0%
- Est. flood insurance / yr
- $507 – $1,088
Fire risk 3/10 · Minor
- Est. fire insurance / yr
- $947 – $1,759
Heat risk 8/10 · Major
- Hot days now (above 108°F)
- 6 days/yr
- Hot days in 30 yrs
- 18 days/yr
Wind risk 9/10 · Severe
- Chance of severe wind over 30 yrs
- 99.0%
Air-quality risk 2/10 · Minimal
- Unhealthy air days now
- 1 days/yr
- Unhealthy air days in 30 yrs
- 1 days/yr
Risk factors via First Street. Map © Google.
Why this score? — see what drove the C grade
The composite is a weighted blend of 9 inputs, each scored 0–100. Each bar is that input's sub-score; the figure is the points it added to the 100-point composite (weight × sub-score).
- Cash flow +21.7/30.0
- ARV discount +7.5/15.0
- DSCR +6.9/10.0
- 1% rule +5.9/10.0
- Schools +4.2/10.0
- Livability +3.8/5.0
- Rent growth +2.6/5.0
- Condition / age +2.5/5.0
- Appreciation +0.0/10.0
$225,000
🖨 Deal sheet 📄 Offer letter ✓ Due diligence
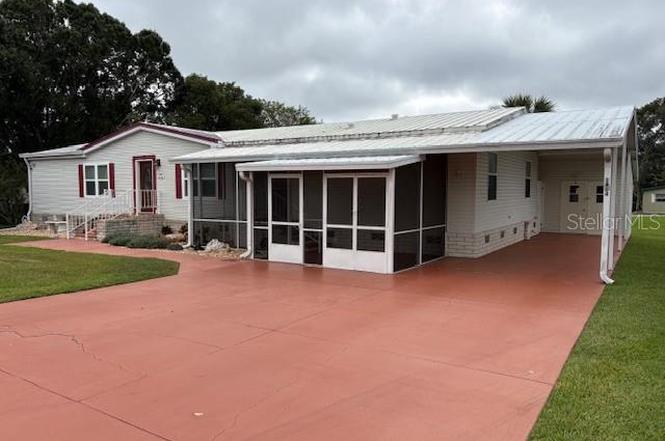
Listing remarks
Come and take a look at this large triple-wide manufactured home in beautiful Dora Pines, a vibrant 55+ golf cart–friendly community just minutes from charming downtown Mount Dora! This community offers a community pool, clubhouse, shuffleboard with very low HOA fees of only $70.00 monthly. Meticulously maintained as you will see from viewing this nearly 2,600 sq. ft. unit from new Pella windows in the front of the unit along with new exterior doors throughout. This is truly move-in ready, schedule your viewing soon before it's gone.
Key facts
- Dora pines community
- Clubhouse
- Community pool
Tags
Property features AI
Finance
- Financial info: Total monthly fees $70; total annual fees $840; Lease restrictions apply
- HOA & community: Has HOA; monthly fee $70 (includes common area taxes and pool); association approval required; Association amenities: clubhouse, pool, shuffleboard court; Community features: community mailbox, deed restrictions, golf carts allowed; Senior community; Pets allowed with breed restrictions; cats and dogs OK
Exterior
- Parking: Carport with 2 spaces
- Utilities: Public water; Public sewer; Electricity connected; Water connected; Sewer connected
- Home design: Manufactured home (triple wide); Single-story; Faces north
- Construction: Metal frame and wood frame construction with vinyl siding; Metal roof; Slab foundation; Built as a triple wide
- Exterior features: Front screened porch; Rain gutters; In-ground spa
Interior
- Kitchen: Built-in oven; Cooktop; Dishwasher; Refrigerator
- Bedrooms: 3 bedrooms
- Flooring: Carpet; Tile
- Bathrooms: 2 full bathrooms
- Heating & cooling: Central heating; Central air conditioning
- Interior features: Ceiling fans; Pest guard system; Thermostat; Walk-in closets; Window treatments; Double-pane windows; Shutters
- Laundry & utility: Inside laundry room; Washer; Dryer; Irrigation equipment
Neighborhood map
What this means for you Summary
Snapshot
- This is a 3-bed/2.0-bath manufactured listed at $225k.
Deal economics
- At list price, monthly cash flow is $345 ($4k/yr) — positive.
- The deal already cash-flows at list — no discount required.
- Meets the 1% rule at list price ($2k rent vs $225k).
- Recommended offer: $198k (12.0% below list) — sets the bar for market timing.
- Cap rate 8.1% vs local median 3.3% in Mount Dora — top-decile yield for the area; either an underpriced asset or a hidden risk that comps aren't pricing in. Stress-test before assuming the spread holds.
Location & tenants
- Location reads 75/100 on livability (#244 in FL, #3,860 nationally) — a middle-class / working-renter tenant base. Strengths: health & safety A+, crime A, housing A-; Watch: employment D+, amenities F, commute F.
- Lake (suburban): math 49% / reading 50% proficiency, ranked #37 of 73 in FL (top 51%) — families likely to look elsewhere, expect single-tenant / working-renter base with shorter leases.
- Market conditions: Rents flat; 639 active listings in the ZIP; 7 comparable units currently listed for rent nearby; rentals at typical pace (median 21d on market — plan ~3-4 weeks tenant-placement turnaround); solid renter incomes; 4,799 units permitted in Lake County in 2024 (814 in 5+ unit buildings).
- This rent runs 38% of the median local income ($77k/yr) — at the standard rent-burdened threshold; future hikes will face affordability resistance.
Forward outlook
- Local home prices are declining (-3.0%/yr); year-one equity from $2k of loan paydown is wiped out by about $7k of value loss. Plan a longer hold.
- Lake County population projected at +37% by 2050 — long-run rental-demand tailwind backs the buy-and-hold thesis.
Negotiation context
- It's been on market 217 days — a 12% lower offer ($198k) is reasonable based on typical stale-listing flexibility.
Risks & watch-outs
- Climate carrying-cost: severe wind risk, 99% chance of damaging wind over 30y; extreme-heat days projected 6→18/yr by 2055 (HVAC capex compounding) — expect insurance premiums to compound above CPI over the hold.
Questions for the listing agent
- It's been on market 217 days. Have you received any prior offers? Is the seller open to a 12% concession, seller financing, or rate buy-down credit?
- What does the HOA fee cover, when was the last increase, and are there any pending special assessments or reserve-fund shortfalls?
- Why hasn't it sold? Are there any deal-killer items the seller is aware of (foundation, flood, title, zoning, code violations)?
- Is there a deadline driving the sale (1031 exchange, divorce, estate, relocation)? That informs how much negotiation room exists.
- What's the average days-on-market for RENTAL listings here right now (not sales)? A rising rental-DOM trend means longer vacancies and softer asking-rent achievability than the comps imply.
- What's the recent tenant-quality profile in this submarket — average credit score on applications, eviction rate, late-payment / NSF rate, and stable-employment percentage? A property-management company in the area should have these aggregated.
- How much new for-sale + rental construction is in the pipeline within 1–3 miles? Heavy new supply typically softens prices + rents 12–24 months out; constrained supply supports both.
Investment metrics
- 1% rule
- 1.09% ✓
- Cap rate
- 8.13%
- Cash-on-cash
- 6.57%
- DSCR
- 1.29
- GRM
- 7.6
CMA / ARV
No comps found within radius.
Projected returns pro-forma
-3.0% appreciation · 0.55% rent growth · sell at horizon
- IRR
- -9.0%
- Equity multiple
- 0.68×
- Total profit
- $-20,342
- Equity at exit
- $33,548
- IRR
- -3.3%
- Equity multiple
- 0.81×
- Total profit
- $-12,282
- Equity at exit
- $19,454
Cash invested: $63,000 (down + closing). Projections, not guarantees.
Landlord ↔ Tenant lean methodology
- Overall (STATE)
- 87 Strongly Landlord-Friendly
- State Florida
- 87 Strongly Landlord-Friendly · R+3
- County
- — inherits STATE
- City
- — inherits STATE
ZIP-level market 32757
- Home prices YoY
- -34.5%
- Rents YoY
- 0.6%
- Active inventory
- 639
- Price-to-rent
- 7.6×
Monthly cashflow live
- Estimated rent
- $2,459 high interval (Pro) →
- Mortgage (P&I)
- −$1,180
- Tax from tax record
- −$254 /mo · $3,047/yr
- Insurance
- −$94
- HOA
- −$70
- Vacancy / Maint / Mgmt
- −$516
- Net cashflow
- $345
Break-even live
UW: 25.0% down · 7.5% · 30yr · 1.5% tax · 5.0% vac · 8.0% maint · 8.0% mgmt
Financing live
Cash to close
- Down payment
- $56,250
- Closing costs
- $6,750
- Reserves months
- —
- Total cash needed
- —
Loan-product check · same deal, 3 products live
Conventional
25% down · 7.5% · 30yr
- Down + closing
- —
- Monthly P&I
- —
- Monthly cashflow
- —
- DSCR
- —
- Eligible?
- —
Personal DTI + credit; lowest rate.
DSCR
20% down · 8.5% · 30yr
- Down + closing
- —
- Monthly P&I
- —
- Monthly cashflow
- —
- DSCR
- —
- Eligible?
- —
No personal income docs; deal must DSCR.
Hard money
10% down · 12.0% · 12mo
- Down + closing
- —
- Monthly P&I
- —
- Monthly cashflow
- —
- DSCR
- —
- Eligible?
- —
Short-term bridge; refi at stabilization.
Rent comps 7 comps
| Address | Beds | Baths | Sqft | Rent | $/sqft | DOM | Units | Dist |
|---|---|---|---|---|---|---|---|---|
| 3108 Bethpage Loop Mount Dora, FL | 4.0 | 2.0 | 1846 | $2,369 | $1.28 | 22d | 1 | 0.98mi |
| 3336 Wolf Run Rd Mount Dora, FL | 3.0 | 2.0 | 1953 | $2,491 | $1.28 | 24d | 1 | 1.03mi |
| 8683 Bridgeport Bay Cir Mount Dora, FL | 3.0 | 2.0 | 1968 | $2,500 | $1.27 | 20d | 1 | 1.08mi |
| 2279 Sabastian St Mount Dora, FL | 4.0 | 2.5 | 2401 | $2,475 | $1.03 | 12d | 1 | 1.18mi |
| 1881 Strathmore Cir Mount Dora, FL | 3.0 | 2.5 | 2630 | $2,225 | $0.85 | 4d | 1 | 1.30mi |
| 2404 Sabastian St Mount Dora, FL | 3.0 | 2.0 | 1981 | $2,375 | $1.20 | 24d | 1 | 1.38mi |
| 2415 Sabastian St Mount Dora, FL | 4.0 | 3.0 | 2165 | $2,400 | $1.11 | 12d | 1 | 1.39mi |
HOA detail
- Monthly dues
- $70 · $840/yr
- Likely covers
- pool
Listing history 8 events
-
2026-05-21status Pending
-
2026-05-07price $225,000
-
2026-04-21price $249,500
-
2025-12-02price $279,500
-
2025-11-05price $284,500
-
2025-10-30price $289,500
-
2025-10-25price $294,500
-
2025-10-16$299,500 Active
ⓘ Source: listings_history table (triggers on properties + properties_extension) + one-shot
backfill from property_details.listing_events for pre-trigger history.
Tax reassessment forecast FL · Resets to sale price
- Current annual tax
- $3,047 · $254/mo
- Projected year-2 tax
- $3,047 · $254/mo
- Expected delta
- $0/yr ($0/mo · 0.0%)
ⓘ Screening estimate from a state-policy table — verify with the county assessor before closing.
Climate risk First Street
- Flood 1/10 Low FEMA zone X (unshaded) · 0% chance over 30 yrs
- Wildfire 3/10 Moderate
- Heat 8/10 Severe 6 d/yr ≥108°F today · 18 d/yr by 30 yrs out
- Wind 9/10 Extreme 99% chance of damaging wind over 30 yrs
- Air quality 2/10 Low 1 unhealthy d/yr today · 1 by 30 yrs out
Nearby sold comps map
Loading sold comps map…
Walkable amenities ~0.75 mi
Loading nearby amenities…
Taxation est. · year 1
- Rental income
- $29,508
- − Mortgage interest
- −$12,603
- − Property taxes
- −$3,047
- − Insurance
- −$1,125
- − Repairs & maintenance
- −$2,361
- − Management
- −$2,361
- − HOA
- −$840
- − Depreciation
- −$6,545
- Taxable income
- $625
- Est. tax owed @ 24.0%
- −$150
- After-tax cash flow
- $3,990/yr
For passive investors: Depreciation is non-cash, so a rental often shows a tax loss while cash-flowing — sheltering income. Rental losses are passive: they offset passive income freely, and up to $25,000/yr can offset ordinary (W-2) income if you actively participate and your MAGI is under $100k (phasing out to $0 by $150k); unused losses carry forward. On sale, claimed depreciation is recaptured at up to 25%, and gains may owe capital-gains tax (a 1031 exchange can defer both). Figures are a year-1 estimate at your 24.0% rate — not tax advice; consult a CPA.
Schools (NCES district)
- District
- Lake
- NCES district ID
- 1201050
- Math proficiency
- 49% ▼ -7.00%
- Reading proficiency
- 50% ▼ -4.00%
- Median HH income
- $46,632
- Composite
- 42.05/100
- National rank
- #3327
- State rank
- #37 of 73 in FL
Livability — Mount Dora
- Score
- 75/100
- State rank
- #244
- US rank
- #3860
Category grades
Schools grade is shown separately in the Schools card above.
Census & demographics
- County
- Lake County · 364,602 people
- City population
- 34,121
- Metro
- Orlando-Kissimmee-Sanford, FL
- Population (ZIP)
- 34,121
- Household income
- $77,216
- Rent vs Own
- Severe rent burden
- 998.0
Population outlook (Lake County) Hauer SSP2
- Today (2025)
- 386,640 people
- By 2030
- 417,107 · +7.9%
- By 2040
- 476,676 · +23.3%
- By 2050
- 531,296 · +37.4%
- By 2075
- 648,303 · +67.7%
- By 2100
- 698,530 · +80.7%
Race, ethnicity, and origin ACS 2023
- Neighborhood character
- Majority White (64%)
- Race & ethnicity
- White 64% Hispanic / Latino 20% Black 12% Two or more races 11% Pacific Islander 1% Native American 1%
- Hispanic origin (detail)
- Mexican 5% Puerto Rican 7% Dominican 1%
- Common ancestry
- Romanian 3% Slovak 3% Lithuanian 2%
- Foreign-born
- 10% · Canada, Jamaica
- Languages at home
- 83% English-only · Spanish 14% Other Indo-European 1%
Political lean MEDSL · Lake
- 2024 margin
- Strong R (+24.7) · D 37.3% · R 62.0%
- 2008→2024 swing
- -11.2pp toward R · 2008: -13.5pp · 2024: -24.7pp
- All cycles
- 2024: R+24.7 2020: R+20.0 2016: R+23.1 2012: R+17.1 2008: R+13.5
Not yet ingested
- Civics
- —
Market trends
- HPI YoY
- ▼ -154.69%
- Current HPI
- 293.4759
- Rent YoY
- ▲ 0.55%
- Metro
- Orlando-Kissimmee-Sanford, FL
- State GDP YoY
- ▲ 3.28%
- F500 in state
- 36
Industry mix (Fortune 500 HQ in FL)
| Industry | F500 HQs | Revenue |
|---|---|---|
| Industrial Technology | 2 | $29B |
|
||
| Insurance | 2 | $17B |
|
||
| Retail | 1 | $60B |
|
||
| Technology Distribution | 1 | $58B |
|
||
| Homebuilding | 1 | $35B |
|
||
| Technology Manufacturing | 1 | $35B |
|
||
Price history
-24.9% since first listed8 events — show timeline
- 2026-05-21 Pending — Stellar MLS as Distributed by MLS Grid
- 2026-05-07 Price Changed $225,000 Stellar MLS as Distributed by MLS Grid
- 2026-04-21 Price Changed $249,500 Stellar MLS as Distributed by MLS Grid
- 2025-12-02 Price Changed $279,500 Stellar MLS as Distributed by MLS Grid
- 2025-11-05 Price Changed $284,500 Stellar MLS as Distributed by MLS Grid
- 2025-10-30 Price Changed $289,500 Stellar MLS as Distributed by MLS Grid
- 2025-10-25 Price Changed $294,500 Stellar MLS as Distributed by MLS Grid
- 2025-10-16 Listed $299,500 Stellar MLS as Distributed by MLS Grid
Property tax history
+14.7%/yrLatest (2025): $3,047 · +2.6% YoY. Source: county tax records.
Cash-flow waterfall
monthlySold comps — $/sqft
last 12 mo · ≤1 miLoading sold comps…