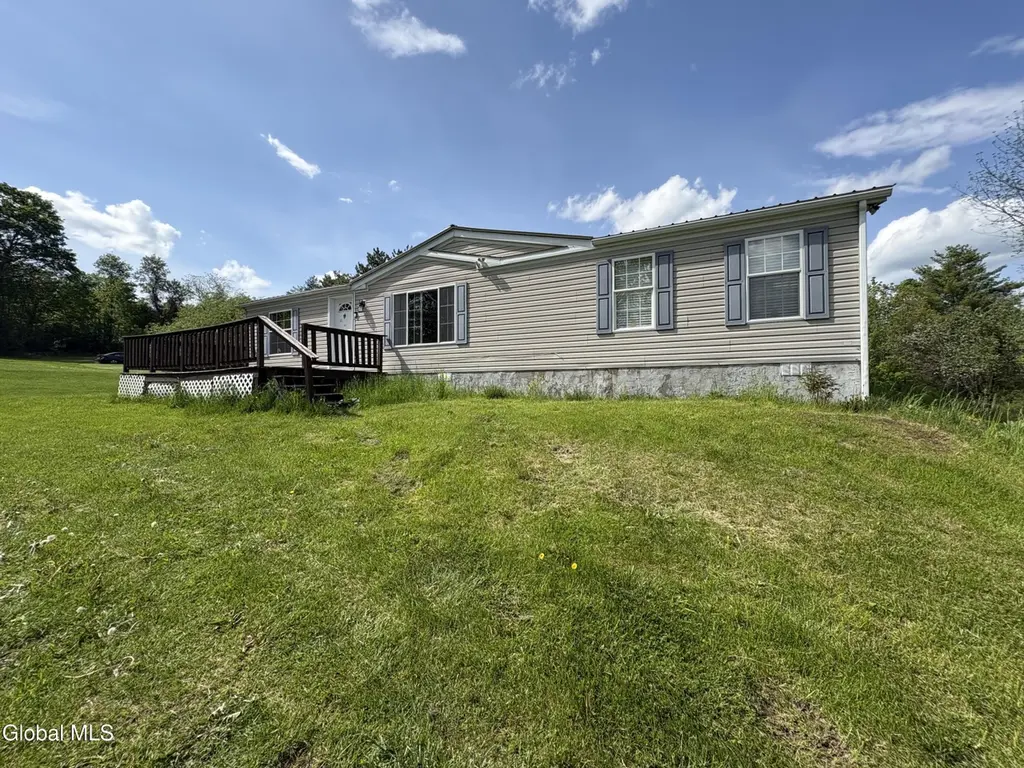
707 Tarbell Hill Rd · Port Henry, NY
Flood risk 1/10 · Minimal
- FEMA flood zone
- X
- Chance of flooding over 30 yrs
- 0.0%
- Est. flood insurance / yr
- $507 – $1,088
Fire risk 1/10 · Minimal
- Est. fire insurance / yr
- $691 – $1,283
Heat risk 2/10 · Minimal
- Hot days now (above 94°F)
- 7 days/yr
- Hot days in 30 yrs
- 15 days/yr
Wind risk 1/10 · Minimal
- Chance of severe wind over 30 yrs
- 1.0%
Air-quality risk 1/10 · Minimal
- Unhealthy air days now
- 0 days/yr
- Unhealthy air days in 30 yrs
- 0 days/yr
Risk factors via First Street. Map © Google.
Why this score? — see what drove the D grade
The composite is a weighted blend of 9 inputs, each scored 0–100. Each bar is that input's sub-score; the figure is the points it added to the 100-point composite (weight × sub-score).
- Appreciation +8.2/10.0
- Cash flow +8.0/30.0
- ARV discount +7.5/15.0
- Schools +4.0/10.0
- Livability +3.8/5.0
- 1% rule +2.5/10.0
- Rent growth +2.5/5.0
- Condition / age +2.5/5.0
- DSCR +2.1/10.0
$169,900
🖨 Deal sheet (PDF) 📄 Offer letter ✓ Due diligence
Listing remarks MLS
Large 3 bedroom, 2 bath manufactured home situated on 1.02 acres. Close to amenities such as schools, shopping, employment and education. Cash offers only
Key facts
- Large front deck
- Newer storage shed
- 1.02 acre lot
Tags
Property features AI
Finance
- Other: Fuel tank(s) on site
Exterior
- Parking: Off-street paved parking for 4 vehicles
- Security: Smoke detectors
- Utilities: Public water; Public sewer; Cable available
- Home design: Single-family residence; Updated/remodeled; Slab foundation
- Construction: Vinyl siding; Metal roof; Built on slab foundation
- Exterior features: Pressure-treated deck; Rear porch; Front porch; Paved driveway; Shed(s); Landscaped grounds; Level lot with road frontage, wooded areas and views
Interior
- Kitchen: Dishwasher; Electric oven; Microwave; Range / Oven; Range hood; Refrigerator; ENERGY STAR qualified appliances
- Bedrooms: Three bedrooms on the first floor
- Flooring: Carpet; Linoleum
- Bathrooms: Two full bathrooms on the first floor
- Heating & cooling: Oil heating; Window cooling units
- Interior features: Paddle fan; Vaulted ceilings; Aluminum frame windows; 8 total rooms
- Laundry & utility: Main-level laundry room; Washer hookup; Electric dryer hookup
Neighborhood map
What this means for you Summary
Snapshot
- This is a 3-bed/2.0-bath manufactured listed at $170k.
Deal economics
- At list price, monthly cash flow is $-170 ($-2k/yr) — negative.
- To cash-flow at today's rent, offer at most $140k (17.7% below list).
- To meet the 1% rule (rent ≥ 1% of price), the offer needs to be $128k (24.8% below list).
- Recommended offer: $128k (24.8% below list) — sets the bar for 1% rule.
- Cap rate 5.1% vs local median 2.7% in Port Henry — top-decile yield for the area; either an underpriced asset or a hidden risk that comps aren't pricing in. Stress-test before assuming the spread holds.
Location & tenants
- Location reads 76/100 on livability (#226 in NY, #3,576 nationally) — a middle-class / working-renter tenant base. Strengths: cost of living A+, housing A+, health & safety A+; Watch: amenities F, commute F.
- Moriah Central School District (rural): math 41% / reading 52% proficiency, ranked #445 of 590 in NY (top 75%) — families likely to look elsewhere, expect single-tenant / working-renter base with shorter leases.
- Zoned schools: Moriah Elementary School (math 42% / reading 47%, grade F, #1,277 of 2,108 statewide, top 64%, 385 students, 47% FRL); Moriah Junior-Senior High School (math 37% / reading 57%, grade D-, #1,007 of 1,100 statewide, top 93%, 316 students, 34% FRL) — zoned schools at 40% FRL track the district average.
- Market conditions: 10 active listings in the ZIP; 218 units permitted in Essex County in 2024 (63 in 5+ unit buildings).
Forward outlook
- In year one you build about $12k of equity ($1k loan paydown + $11k appreciation (6.3% local appreciation)).
- Essex County population projected at -20% by 2050 — secular population decline; favor cash flow + early exit over multi-decade hold.
- By year 4, paydown + projected appreciation supports a ~$41k cash-out refi (75% LTV) — recoverable capital for the next deal without selling this one.
Negotiation context
- Only 13 days on market — expect competitive offers; lowballing is unlikely to land.
- 6 sale attempts since 16y ago with the ask held roughly flat each time — persistent listings suggest the price (not the market) is what's stuck; bring a comps-based counter.
- Current owner paid $30k; list at $170k implies a 466% gain — meaningful room to come down on a strong offer.
Questions for the listing agent
- What do current leases actually rent for vs. the listed asking? Can we see a recent rent roll and the last 12 months of T-12 income?
- Is there a deadline driving the sale (1031 exchange, divorce, estate, relocation)? That informs how much negotiation room exists.
- Schools are D-rated, which usually means shorter tenancies and higher turnover. Who's the typical renter profile here, and what's been the actual vacancy rate?
- The area grade is low — what's the realistic commute time and amenity access for the typical tenant pool here? Any planned neighborhood developments (good or bad) we should know about?
- What's the average days-on-market for RENTAL listings here right now (not sales)? A rising rental-DOM trend means longer vacancies and softer asking-rent achievability than the comps imply.
- What's the recent tenant-quality profile in this submarket — average credit score on applications, eviction rate, late-payment / NSF rate, and stable-employment percentage? A property-management company in the area should have these aggregated.
- How much new for-sale + rental construction is in the pipeline within 1–3 miles? Heavy new supply typically softens prices + rents 12–24 months out; constrained supply supports both.
Investment metrics
- 1% rule
- 0.75% ✗
- Cap rate
- 5.09%
- Cash-on-cash
- -4.29%
- DSCR
- 0.81
- GRM
- 11.1
CMA / ARV
No comps found within radius.
Projected returns pro-forma
6.33% appreciation · 3.0% rent growth · sell at horizon
- IRR
- 12.7%
- Equity multiple
- 1.87×
- Total profit
- $41,606
- Equity at exit
- $110,393
- IRR
- 13.3%
- Equity multiple
- 3.73×
- Total profit
- $130,089
- Equity at exit
- $203,364
Cash invested: $47,572 (down + closing). Projections, not guarantees.
Landlord ↔ Tenant lean methodology
- Overall (STATE)
- 15 Strongly Tenant-Friendly
- State New York
- 15 Strongly Tenant-Friendly · D+10
- County
- — inherits STATE
- City
- — inherits STATE
ZIP-level market 12960
- Home prices YoY
- 1.9%
- Active inventory
- 10
- Price-to-rent
- 11.1×
Monthly cashflow live
- Estimated rent
- $1,277 medium interval (Pro) →
- Mortgage (P&I)
- −$891
- Tax from tax record
- −$218 /mo · $2,612/yr
- Insurance
- −$71
- HOA
- −$0
- Vacancy / Maint / Mgmt
- −$268
- Net cashflow
- $-170
Break-even live
Sensitivity live
| Price | -10% $-74 | -5% $-122 | +0% $-170 | +5% $-218 | +10% $-266 |
|---|---|---|---|---|---|
| Rent | -10% $-271 | -5% $-221 | +0% $-170 | +5% $-120 | +10% $-69 |
| Rate | -1.0pp $-85 | -0.5pp $-127 | base $-170 | +0.5pp $-214 | +1.0pp $-259 |
UW: 25.0% down · 7.5% · 30yr · 1.5% tax · 5.0% vac · 8.0% maint · 8.0% mgmt
Financing live
Cash to close
- Down payment
- $42,475
- Closing costs
- $5,097
- Reserves months
- —
- Total cash needed
- —
Loan-product check · same deal, 3 products live
Conventional
25% down · 7.5% · 30yr
- Down + closing
- —
- Monthly P&I
- —
- Monthly cashflow
- —
- DSCR
- —
- Eligible?
- —
Personal DTI + credit; lowest rate.
DSCR
20% down · 8.5% · 30yr
- Down + closing
- —
- Monthly P&I
- —
- Monthly cashflow
- —
- DSCR
- —
- Eligible?
- —
No personal income docs; deal must DSCR.
Hard money
10% down · 12.0% · 12mo
- Down + closing
- —
- Monthly P&I
- —
- Monthly cashflow
- —
- DSCR
- —
- Eligible?
- —
Short-term bridge; refi at stabilization.
Listing history 17 events
-
2026-06-04statusdays on market $169,900 Pending 13 DOM
-
2026-06-02days on market $169,900 Active 12 DOM
-
2026-06-01days on market $169,900 Active 11 DOM
-
2026-05-31days on market $169,900 Active 10 DOM
-
2026-05-21status Active
-
2026-05-20$169,900 Active
-
2026-05-20historical
-
2022-12-23historical
-
2022-06-26historical
-
2022-06-14$79,900
-
2020-12-10soldstatus $30,000 154-char remark
Show marketing remark (154 chars)
Large 3 bedroom, 2 bath manufactured home situated on 1.02 acres. Close to amenities such as schools, shopping, employment and education. Cash offers only
-
2020-10-13soldstatus $82,472
-
2020-07-04historical
-
2020-06-25$34,900 154-char remark
Show marketing remark (154 chars)
Large 3 bedroom, 2 bath manufactured home situated on 1.02 acres. Close to amenities such as schools, shopping, employment and education. Cash offers only
-
2019-07-04$47,000
-
2011-07-03historical
-
2010-07-03$99,000
ⓘ Source: listings_history table (triggers on properties + properties_extension) + one-shot
backfill from property_details.listing_events for pre-trigger history.
Tax reassessment forecast NY · Partial reset (capped growth)
- Current annual tax
- $2,612 · $218/mo
- Projected year-2 tax
- $2,742 · $228/mo
- Expected delta
- +$130/yr (+$11/mo · 5.0%)
ⓘ Screening estimate from a state-policy table — verify with the county assessor before closing.
Climate risk First Street
- Flood 1/10 Low FEMA zone X · 0% chance over 30 yrs
- Wildfire 1/10 Low
- Heat 2/10 Low 7 d/yr ≥94°F today · 15 d/yr by 30 yrs out
- Wind 1/10 Low 100% chance of damaging wind over 30 yrs
- Air quality 1/10 Low 0 unhealthy d/yr today · 0 by 30 yrs out
Nearby sold comps map
Loading sold comps map…
Walkable amenities ~0.75 mi
Loading nearby amenities…
Taxation est. · year 1
- Rental income
- $15,329
- − Mortgage interest
- −$9,517
- − Property taxes
- −$2,612
- − Insurance
- −$850
- − Repairs & maintenance
- −$1,226
- − Management
- −$1,226
- − Depreciation
- −$4,943
- Taxable loss
- −$5,044
- Est. tax savings @ 24.0%
- +$1,211
- After-tax cash flow
- $-832/yr
For passive investors: Depreciation is non-cash, so a rental often shows a tax loss while cash-flowing — sheltering income. Rental losses are passive: they offset passive income freely, and up to $25,000/yr can offset ordinary (W-2) income if you actively participate and your MAGI is under $100k (phasing out to $0 by $150k); unused losses carry forward. On sale, claimed depreciation is recaptured at up to 25%, and gains may owe capital-gains tax (a 1031 exchange can defer both). Figures are a year-1 estimate at your 24.0% rate — not tax advice; consult a CPA.
Schools (NCES district)
- District
- Moriah Central School District
- NCES district ID
- 3619830
- Math proficiency
- 41% ▼ -6.00%
- Reading proficiency
- 52% ▲ 2.00%
- Median HH income
- $46,940
- Composite
- 39.55/100
- National rank
- #3937
- State rank
- #445 of 590 in NY
Livability — Port Henry
- Score
- 76/100
- State rank
- #226
- US rank
- #3576
Category grades
Schools grade is shown separately in the Schools card above.
Census & demographics
- Population (ZIP)
- 995
Population outlook (Essex County) Hauer SSP2
- Today (2025)
- 36,758 people
- By 2030
- 35,697 · -2.9%
- By 2040
- 32,697 · -11.0%
- By 2050
- 29,248 · -20.4%
- By 2075
- 22,641 · -38.4%
- By 2100
- 16,602 · -54.8%
Race, ethnicity, and origin ACS 2023
- Neighborhood character
- Predominantly White (100%)
- Race & ethnicity
- White 100%
- Common ancestry
- Lithuanian 21% Slovak 12% Romanian 8%
- Languages at home
- 98% English-only · French/Haitian/Cajun 2%
Political lean MEDSL · Essex
- 2024 margin
- Toss-up / Even · D 50.2% · R 49.8%
- 2008→2024 swing
- -12.8pp toward R · 2008: 13.3pp · 2024: 0.5pp
- All cycles
- 2024: D+0.5 2020: D+5.0 2016: R+3.4 2012: D+15.0 2008: D+13.3
Not yet ingested
- Civics
- —
Market trends
- HPI YoY
- ▲ 6.33%
- Current HPI
- 340.4974
- Rent YoY
- —
- Metro
- —
- State GDP YoY
- ▲ 2.60%
- F500 in state
- 92
Industry mix (Fortune 500 HQ in NY)
| Industry | F500 HQs | Revenue |
|---|---|---|
| Financial Services | 10 | $950B |
|
||
| Consumer Goods | 9 | $162B |
|
||
| Insurance | 4 | $225B |
|
||
| Telecommunications | 2 | $144B |
|
||
| Pharmaceuticals | 2 | $112B |
|
||
| Media / Entertainment | 2 | $69B |
|
||
Price history
+71.6% since first listed13 events — show timeline
- 2026-05-21 Relisted — Global MLS
- 2026-05-20 Listing Removed — Global MLS
- 2026-05-20 Listed $169,900 Global MLS
- 2022-12-23 Listing Removed — Global MLS
- 2022-06-26 Listing Removed — Global MLS
- 2022-06-14 Listed $79,900 Global MLS
- 2020-12-10 Sold (MLS) $30,000 Global MLS
- 2020-10-13 Sold (Public Records) $82,472 Public Records
- 2020-07-04 Listing Removed — Global MLS
- 2020-06-25 Listed $34,900 Global MLS
- 2019-07-04 Listed $47,000 Global MLS
- 2011-07-03 Listing Removed — Global MLS
- 2010-07-03 Listed $99,000 Global MLS
Property tax history
-5.1%/yrLatest (2025): $2,612 · -24.8% YoY. Source: county tax records.
Cash-flow waterfall
monthlySold comps — $/sqft
last 12 mo · ≤1 miLoading sold comps…