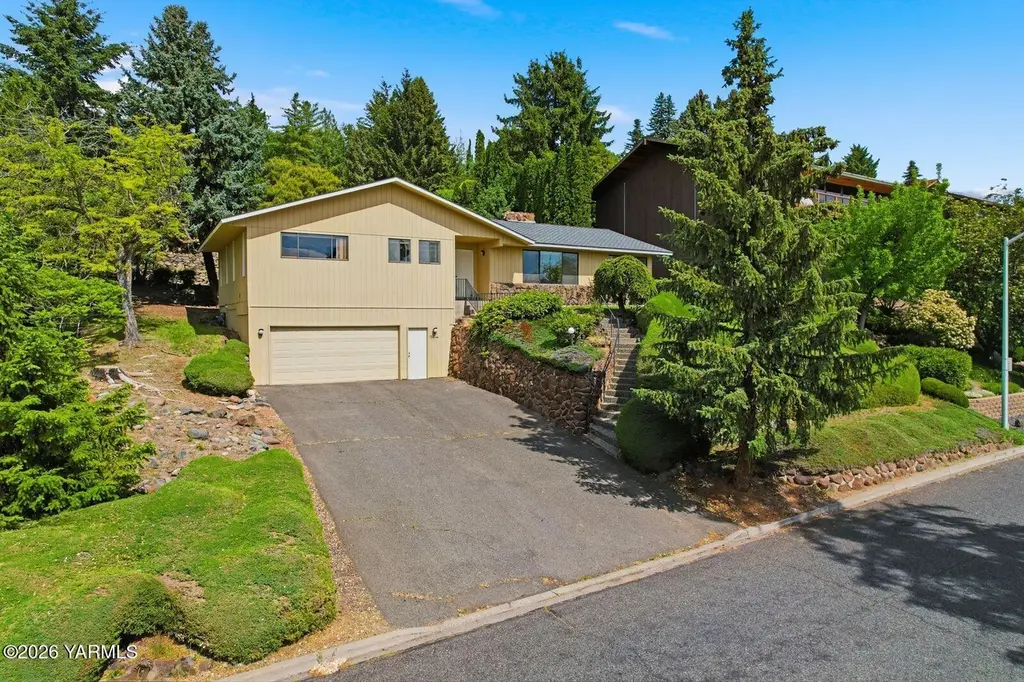
912 Carriage Hill Dr · Yakima, WA
Flood risk 1/10 · Minimal
- FEMA flood zone
- X (unshaded)
- Chance of flooding over 30 yrs
- 0.0%
- Est. flood insurance / yr
- $473 – $860
Fire risk 5/10 · Moderate
- Est. fire insurance / yr
- $604 – $1,122
Heat risk 4/10 · Minor
- Hot days now (above 97°F)
- 7 days/yr
- Hot days in 30 yrs
- 13 days/yr
Wind risk 1/10 · Minimal
- Chance of severe wind over 30 yrs
- —
Air-quality risk 9/10 · Severe
- Unhealthy air days now
- 14 days/yr
- Unhealthy air days in 30 yrs
- 16 days/yr
Risk factors via First Street. Map © Google.
Why this score? — see what drove the D grade
The composite is a weighted blend of 9 inputs, each scored 0–100. Each bar is that input's sub-score; the figure is the points it added to the 100-point composite (weight × sub-score).
- ARV discount +13.2/15.0
- Cash flow +9.0/30.0
- Rent growth +4.1/5.0
- Livability +4.0/5.0
- Schools +3.4/10.0
- DSCR +2.5/10.0
- Condition / age +2.5/5.0
- 1% rule +2.2/10.0
- Appreciation +0.0/10.0
$380,000
🖨 Deal sheet 📄 Offer letter ✓ Due diligence
Listing remarks
This well-maintained 1973 home offers 2,142 square feet of comfortable living space while preserving much of its original character and charm. Featuring 4 bedrooms and 3 bathrooms, the layout is both practical and inviting, with 3 bedrooms conveniently located on the main floor and a 4th cozy bedroom in lower level with small walk-in closet. Inside, the home details reflect the style of the era, a thoughtfully designed floor plan with generous room sizes throughout. The large living areas provide plenty of space for gathering and entertaining, while expansive windows allow natural light to fill the home. The primary bedroom serves as a private retreat with its own attached bathroom. Each ad
Key facts
- Terraced yard
- Stunning views
- 0.25 acre lot
Tags
Property features AI
Exterior
- Parking: Attached garage with 2 spaces and garage door opener
- Utilities: Public water; Sewer connected
- Home design: Single-family residence; 1 story; Site-built construction
- Construction: Frame construction with wood siding
- Exterior features: Composition roof; Lot zoned R1 (single-family residential); Approximately 0.25 acre lot
Interior
- Kitchen: Dishwasher; Range; Refrigerator
- Flooring: Carpet; Concrete; Vinyl
- Bathrooms: 3 full bathrooms
- Heating & cooling: Central air conditioning; Forced air heating; Electric heating; Fireplace insert
- Interior features: Finished basement; Fireplace (2 total)
- Laundry & utility: Laundry in basement
Neighborhood map
What this means for you Summary
Snapshot
- This is a 4-bed/3.0-bath single-family listed at $380k.
Deal economics
- At list price, monthly cash flow is $-301 ($-4k/yr) — negative.
- To cash-flow at today's rent, offer at most $327k (14.0% below list).
- To meet the 1% rule (rent ≥ 1% of price), the offer needs to be $274k (27.9% below list).
- Recommended offer: $274k (27.9% below list) — sets the bar for 1% rule.
- Cap rate 5.3% vs local median 3.4% in Yakima — top-decile yield for the area; either an underpriced asset or a hidden risk that comps aren't pricing in. Stress-test before assuming the spread holds.
Location & tenants
- Location reads 80/100 on livability (#98 in WA, #1,912 nationally) — a professional / high-income tenant draw. Strengths: amenities A+, commute A+, housing A+; Watch: employment D, crime F.
- Yakima School District (urban): math 34% / reading 42% proficiency, ranked #238 of 291 in WA (top 82%) — families likely to look elsewhere, expect single-tenant / working-renter base with shorter leases; 76% free/reduced lunch — lower-income household profile, screen leases tightly.
- Market conditions: Rents rising fast (+6.5%/yr); 326 active listings in the ZIP; 4 comparable units currently listed for rent nearby; rentals lingering (median 44d on market — plan ~5-8 weeks vacancy on turnover, expect pricing pressure); 50% of comp listings sitting > 30 days — soft ceiling on asking rent; solid renter incomes; 468 units permitted in Yakima County in 2024 (23 in 5+ unit buildings).
- This rent runs 39% of the median local income ($84k/yr) — at the standard rent-burdened threshold; future hikes will face affordability resistance.
Forward outlook
- Local home prices are declining (-3.0%/yr); year-one equity from $3k of loan paydown is wiped out by about $11k of value loss. Plan a longer hold.
- Yakima County population projected at +6% by 2050 — modest demand growth; plan on rents tracking national, not racing it.
Negotiation context
- Only 8 days on market — expect competitive offers; lowballing is unlikely to land.
Risks & watch-outs
- Climate carrying-cost: moderate wildfire risk — expect insurance premiums to compound above CPI over the hold.
Questions for the listing agent
- What do current leases actually rent for vs. the listed asking? Can we see a recent rent roll and the last 12 months of T-12 income?
- Built in 1973 — when were the roof, HVAC, electrical panel, plumbing, and water heater last replaced?
- Is there a deadline driving the sale (1031 exchange, divorce, estate, relocation)? That informs how much negotiation room exists.
- Crime grade is F in this area — have there been break-ins, vandalism, or insurance claims at this property in the last 3 years? What carrier currently insures it and at what premium?
- The area grade is low — what's the realistic commute time and amenity access for the typical tenant pool here? Any planned neighborhood developments (good or bad) we should know about?
- What's the average days-on-market for RENTAL listings here right now (not sales)? A rising rental-DOM trend means longer vacancies and softer asking-rent achievability than the comps imply.
- What's the recent tenant-quality profile in this submarket — average credit score on applications, eviction rate, late-payment / NSF rate, and stable-employment percentage? A property-management company in the area should have these aggregated.
- How much new for-sale + rental construction is in the pipeline within 1–3 miles? Heavy new supply typically softens prices + rents 12–24 months out; constrained supply supports both.
Investment metrics
- 1% rule
- 0.72% ✗
- Cap rate
- 5.34%
- Cash-on-cash
- -3.40%
- DSCR
- 0.85
- GRM
- 11.6
CMA / ARV
- ARV (median comp)
- $435,018
- List price
- $380,000
- Delta
- -12.65%
- Verdict
- UNDERPRICED
- Comps
- 20 within 1.0 mi
Show comp detail 12 sales within ~0.75 mi
| Address | Dist | Beds/Ba | Sqft | Sold | Price | $/sf | Match |
|---|---|---|---|---|---|---|---|
| 912 Carriage Hill Dr | 0.00mi | 4/3.0 | 2,142 (-0%) | 1mo | $410,000 | $191 | 99 |
| 826 Carriage Hill Dr | 0.13mi | 4/2.5 | 2,150 (-0%) | 11mo | $405,000 | $188 | 82 |
| 604 Bellevue Pl | 0.44mi | 3/2.5 (-1) | 2,071 (-4%) | 4mo | $535,000 | $258 | 63 |
| 809 Pecks Canyon Rd | 0.39mi | 3/2.0 (-1) | 2,184 (+2%) | 11mo | $650,000 | $298 | 61 |
| 608 Bellevue Pl | 0.42mi | 3/2.0 (-1) | 1,975 (-8%) | 12mo | $430,000 | $218 | 48 |
| 612 N 44th Ave | 0.42mi | 3/2.5 (-1) | 2,432 (+13%) | 5mo | $520,000 | $214 | 48 |
| 5306 Douglas Dr | 0.66mi | 3/2.5 (-1) | 2,280 (+6%) | 8mo | $470,000 | $206 | 46 |
| 4404 Benjamin Dr | 0.54mi | 3/2.0 (-1) | 1,989 (-8%) | 11mo | $383,000 | $193 | 44 |
| 1004 Pecks Canyon Rd | 0.37mi | 3/2.0 (-1) | 1,844 (-14%) | 8mo | $440,000 | $239 | 43 |
| 319 N 46th Ave | 0.72mi | 3/2.0 (-1) | 2,242 (+4%) | 10mo | $420,000 | $187 | 42 |
| 5709 Marilane St | 0.72mi | 4/3.0 | 2,373 (+10%) | 11mo | $585,000 | $247 | 40 |
| 601 N 54th Ave | 0.61mi | 3/3.0 (-1) | 2,415 (+12%) | 11mo | $475,000 | $197 | 36 |
Match score weights: distance 35% · size 25% · config 20% · recency 20%. Top-matched comps best support the ARV.
Projected returns pro-forma
-3.0% appreciation · 6.45% rent growth · sell at horizon
- IRR
- -18.5%
- Equity multiple
- 0.33×
- Total profit
- $-70,991
- Equity at exit
- $56,659
- IRR
- -5.5%
- Equity multiple
- 0.59×
- Total profit
- $-43,425
- Equity at exit
- $32,855
Cash invested: $106,400 (down + closing). Projections, not guarantees.
Landlord ↔ Tenant lean methodology
- Overall (STATE)
- 28 Tenant-Leaning
- State Washington
- 28 Tenant-Leaning · D+8
- County
- — inherits STATE
- City
- — inherits STATE
ZIP-level market 98908
- Rents YoY
- 6.5%
- Active inventory
- 326
- Price-to-rent
- 11.6×
Monthly cashflow live
- Estimated rent
- $2,739 medium interval (Pro) →
- Mortgage (P&I)
- −$1,993
- Tax from tax record
- −$314 /mo · $3,773/yr
- Insurance
- −$158
- HOA
- −$0
- Vacancy / Maint / Mgmt
- −$575
- Net cashflow
- $-301
Break-even live
UW: 25.0% down · 7.5% · 30yr · 1.5% tax · 5.0% vac · 8.0% maint · 8.0% mgmt
Financing live
Cash to close
- Down payment
- $95,000
- Closing costs
- $11,400
- Reserves months
- —
- Total cash needed
- —
Loan-product check · same deal, 3 products live
Conventional
25% down · 7.5% · 30yr
- Down + closing
- —
- Monthly P&I
- —
- Monthly cashflow
- —
- DSCR
- —
- Eligible?
- —
Personal DTI + credit; lowest rate.
DSCR
20% down · 8.5% · 30yr
- Down + closing
- —
- Monthly P&I
- —
- Monthly cashflow
- —
- DSCR
- —
- Eligible?
- —
No personal income docs; deal must DSCR.
Hard money
10% down · 12.0% · 12mo
- Down + closing
- —
- Monthly P&I
- —
- Monthly cashflow
- —
- DSCR
- —
- Eligible?
- —
Short-term bridge; refi at stabilization.
Rent comps 4 comps
| Address | Beds | Baths | Sqft | Rent | $/sqft | DOM | Units | Dist |
|---|---|---|---|---|---|---|---|---|
| 4402 Tayhill Way Yakima, WA | 3.0 | 2.0 | 1589 | $3,200 | $2.01 | 43d | 1 | 0.32mi |
| 305 N 50th Ave Yakima, WA | 3.0 | 2.0 | 1794 | $2,300 | $1.28 | 21d | 1 | 0.91mi |
| 710 N 29th Ave #1 Yakima, WA | 3.0 | 2.5 | 1512 | $1,850 | $1.22 | 43d | 1 | 1.15mi |
| 6601 Cherry Ridge Ct Yakima, WA | 3.0 | 2.0 | 2231 | $3,000 | $1.34 | 13d | 1 | 1.39mi |
Listing history 1 events
-
2026-05-11$380,000 Active 1044-char remark
ⓘ Source: listings_history table (triggers on properties + properties_extension) + one-shot
backfill from property_details.listing_events for pre-trigger history.
Tax reassessment forecast WA · Resets to sale price
- Current annual tax
- $3,773 · $314/mo
- Projected year-2 tax
- $3,773 · $314/mo
- Expected delta
- $0/yr ($0/mo · 0.0%)
ⓘ Screening estimate from a state-policy table — verify with the county assessor before closing.
Climate risk First Street
- Flood 1/10 Low FEMA zone X (unshaded) · 0% chance over 30 yrs
- Wildfire 5/10 Major
- Heat 4/10 Moderate 7 d/yr ≥97°F today · 13 d/yr by 30 yrs out
- Wind 1/10 Low
- Air quality 9/10 Extreme 14 unhealthy d/yr today · 16 by 30 yrs out
Nearby sold comps map
Loading sold comps map…
Walkable amenities ~0.75 mi
Loading nearby amenities…
Taxation est. · year 1
- Rental income
- $32,873
- − Mortgage interest
- −$21,286
- − Property taxes
- −$3,773
- − Insurance
- −$1,900
- − Repairs & maintenance
- −$2,630
- − Management
- −$2,630
- − Depreciation
- −$11,055
- Taxable loss
- −$10,400
- Est. tax savings @ 24.0%
- +$2,496
- After-tax cash flow
- $-1,120/yr
For passive investors: Depreciation is non-cash, so a rental often shows a tax loss while cash-flowing — sheltering income. Rental losses are passive: they offset passive income freely, and up to $25,000/yr can offset ordinary (W-2) income if you actively participate and your MAGI is under $100k (phasing out to $0 by $150k); unused losses carry forward. On sale, claimed depreciation is recaptured at up to 25%, and gains may owe capital-gains tax (a 1031 exchange can defer both). Figures are a year-1 estimate at your 24.0% rate — not tax advice; consult a CPA.
Schools (NCES district)
- District
- Yakima School District
- NCES district ID
- 5310110
- Math proficiency
- 34% ▼ -1.00%
- Reading proficiency
- 42% ▬ 0.00%
- Median HH income
- $36,538
- Composite
- 34.04/100
- National rank
- #10305
- State rank
- #238 of 291 in WA
Livability — Yakima
- Score
- 80/100
- State rank
- #98
- US rank
- #1912
Category grades
Schools grade is shown separately in the Schools card above.
Census & demographics
- Census place
- Yakima, WA
- County
- Yakima County · 134,789 people
- City population
- 115,918
- Metro
- Yakima, WA
- Population (ZIP)
- 38,060
- Household income
- $84,197
- Rent vs Own
- Severe rent burden
- 1265.0
Population outlook (Yakima County) Hauer SSP2
- Today (2025)
- 256,514 people
- By 2030
- 259,403 · +1.1%
- By 2040
- 265,677 · +3.6%
- By 2050
- 273,061 · +6.5%
- By 2075
- 296,991 · +15.8%
- By 2100
- 315,291 · +22.9%
Race, ethnicity, and origin ACS 2023
- Neighborhood character
- Predominantly White (68%)
- Race & ethnicity
- White 68% Hispanic / Latino 24% Two or more races 12% Asian 2%
- Hispanic origin (detail)
- Mexican 22%
- Common ancestry
- Portuguese 4% Italian 3% Lithuanian 2%
- Foreign-born
- 7% · Canada, China, South Korea
- Languages at home
- 82% English-only · Spanish 16% German/W. Germanic 1%
Political lean MEDSL · Yakima
- 2024 margin
- R (+14.3) · D 41.6% · R 55.9% · Other 2.5%
- 2008→2024 swing
- -3.8pp toward R · 2008: -10.6pp · 2024: -14.3pp
- All cycles
- 2024: R+14.3 2020: R+7.7 2016: R+15.4 2012: R+15.1 2008: R+10.6
Not yet ingested
- Civics
- —
Market trends
- HPI YoY
- ▼ -337.28%
- Current HPI
- 258.8688
- Rent YoY
- ▲ 6.45%
- Metro
- Yakima, WA
- State GDP YoY
- ▲ 4.65%
- F500 in state
- 22
Industry mix (Fortune 500 HQ in WA)
| Industry | F500 HQs | Revenue |
|---|---|---|
| Retail | 2 | $269B |
|
||
| Technology / Retail | 1 | $638B |
|
||
| Technology | 1 | $245B |
|
||
| Telecommunications | 1 | $38B |
|
||
| Food / Beverage | 1 | $36B |
|
||
| Automotive / Trucks | 1 | $34B |
|
||
Price history
+7.9% since first listed4 events — show timeline
- 2026-05-29 Sold (Public Records) $410,000 Public Records
- 2026-05-29 Sold (MLS) $410,000 YAMLS
- 2026-05-19 Pending — YAMLS
- 2026-05-11 Listed $380,000 YAMLS
Property tax history
+4.3%/yrLatest (2026): $3,773 · -6.5% YoY. Source: county tax records.
Cash-flow waterfall
monthlySold comps — $/sqft
last 12 mo · ≤1 miLoading sold comps…