 🌊 Lakefront
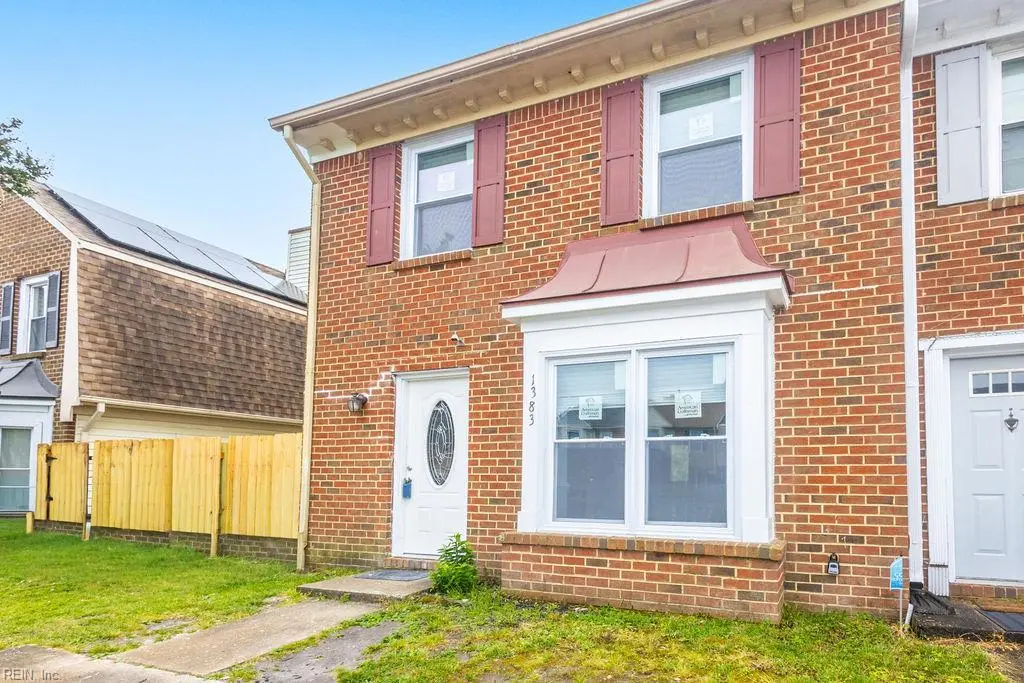
1383 Battleford Dr · Virginia Beach, VA
Flood risk 1/10 · Minimal
- FEMA flood zone
- X (unshaded)
- Chance of flooding over 30 yrs
- 0.0%
- Est. flood insurance / yr
- $507 – $1,088
Fire risk 4/10 · Minor
- Est. fire insurance / yr
- $666 – $1,236
Heat risk 9/10 · Severe
- Hot days now (above 105°F)
- 7 days/yr
- Hot days in 30 yrs
- 16 days/yr
Wind risk 8/10 · Major
- Chance of severe wind over 30 yrs
- 80.0%
Air-quality risk 5/10 · Moderate
- Unhealthy air days now
- 7 days/yr
- Unhealthy air days in 30 yrs
- 7 days/yr
Risk factors via First Street. Map © Google.
Why this score? — see what drove the D- grade
The composite is a weighted blend of 9 inputs, each scored 0–100. Each bar is that input's sub-score; the figure is the points it added to the 100-point composite (weight × sub-score).
- Cash flow +10.8/30.0
- Schools +6.4/10.0
- ARV discount +4.6/15.0
- Livability +4.2/5.0
- Rent growth +4.1/5.0
- DSCR +3.1/10.0
- Condition / age +2.5/5.0
- 1% rule +2.4/10.0
- Appreciation +0.0/10.0
$305,000
🖨 Deal sheet 📄 Offer letter ✓ Due diligence
Listing remarks
Lakefront end-unit living with fresh 2026 renovations throughout! Enjoy beautiful water views from this updated home featuring a brand-new kitchen, granite countertops, all new flooring, renovated bathrooms, new windows, and new hot water heater. Major updates continue with a new roof installed in 2025 for added peace of mind. Move-in ready and packed with modern upgrades—don’t miss this one!
Key facts
- 2 parking spots
- Built 1987
- Listed 16 days
Property features AI
Finance
- HOA & community: No HOA fees listed
Exterior
- Parking: Driveway with 2 parking spaces
- Utilities: City/County water; City/County sewer; Electric water heater; Electric service
- Home design: Attached townhouse; End unit; 2 stories; Slab foundation
- Construction: Vinyl siding; Asphalt shingle roof
- Exterior features: Deck; Patio; Back yard with picket fence; Waterfront on a lake
Interior
- Kitchen: Dishwasher; Microwave; Electric range; Refrigerator
- Bedrooms: No bedroom with full bathroom on first floor
- Flooring: Carpet; Ceramic; Laminate
- Bathrooms: 1 full bath; 1 half bath
- Heating & cooling: Natural gas heating; Central air conditioning
- Interior features: Cable hookup; Ceiling fan; Wood-burning fireplace; Scuttle access; Walk-in closet
- Laundry & utility: Washer; Utility closet
Neighborhood map
What this means for you Summary
Snapshot
- This is a 3-bed/2.5-bath townhouse listed at $305k.
Deal economics
- At list price, monthly cash flow is $-139 ($-2k/yr) — negative.
- To cash-flow at today's rent, offer at most $280k (8.1% below list).
- To meet the 1% rule (rent ≥ 1% of price), the offer needs to be $227k (25.7% below list).
- Recommended offer: $227k (25.7% below list) — sets the bar for 1% rule.
- Cap rate 5.7% vs local median 3.5% in Virginia Beach — top-decile yield for the area; either an underpriced asset or a hidden risk that comps aren't pricing in. Stress-test before assuming the spread holds.
Location & tenants
- Location reads 83/100 on livability (#38 in VA, #880 nationally) — a professional / high-income tenant draw. Strengths: amenities A+, employment A+, housing A+; Watch: cost of living C-, commute F.
- Va Beach City Public School District (urban): math 69% / reading 78% proficiency, ranked #10 of 131 in VA (top 8%) — strong family-tenant draw, lease renewals of 3-5y typical.
- Zoned schools: Glenwood Elementary (math 72% / reading 81%, grade A, #195 of 1,108 statewide, top 18%, 986 students, 44% FRL); Salem High (math 79% / reading 90%, grade A, #23 of 319 statewide, top 8%, 1,650 students, 36% FRL).
- Market conditions: Rents rising fast (+6.4%/yr); 225 active listings in the ZIP; 24 comparable units currently listed for rent nearby; rentals at typical pace (median 20d on market — plan ~3-4 weeks tenant-placement turnaround); solid renter incomes; 666 units permitted in Virginia Beach city in 2024 (347 in 5+ unit buildings).
Forward outlook
- Local home prices are declining (-3.0%/yr); year-one equity from $2k of loan paydown is wiped out by about $9k of value loss. Plan a longer hold.
- Virginia Beach County population projected at +6% by 2050 — modest demand growth; plan on rents tracking national, not racing it.
Negotiation context
- It's been on market 16 days — a 2% lower offer ($300k) is reasonable based on typical stale-listing flexibility.
- 4 sale attempts since 9y ago with the ask held roughly flat each time — persistent listings suggest the price (not the market) is what's stuck; bring a comps-based counter.
- Current owner paid $110k; list at $305k implies a 177% gain — meaningful room to come down on a strong offer.
Risks & watch-outs
- Climate carrying-cost: severe wind risk, 80% chance of damaging wind over 30y; extreme-heat days projected 7→16/yr by 2055 (HVAC capex compounding) — expect insurance premiums to compound above CPI over the hold.
Questions for the listing agent
- What do current leases actually rent for vs. the listed asking? Can we see a recent rent roll and the last 12 months of T-12 income?
- Is there a deadline driving the sale (1031 exchange, divorce, estate, relocation)? That informs how much negotiation room exists.
- Schools are A-rated — typically a magnet for longer-tenancy family renters. What's the average tenant stay here, and is there a school-zone premium baked into asking?
- The area grade is low — what's the realistic commute time and amenity access for the typical tenant pool here? Any planned neighborhood developments (good or bad) we should know about?
- This sits on a lake — are riparian / water-frontage rights deeded with the parcel? Any dock permits, shoreline easements, or HOA water-use restrictions?
- What's the documented flood / surge / shoreline-erosion history here (FEMA AND non-FEMA — e.g., storm surge, creek backup, septic-field saturation)?
- Any water-quality or seasonal algae-bloom issues that affect tenant satisfaction or short-term-rental demand?
- What's the average days-on-market for RENTAL listings here right now (not sales)? A rising rental-DOM trend means longer vacancies and softer asking-rent achievability than the comps imply.
- What's the recent tenant-quality profile in this submarket — average credit score on applications, eviction rate, late-payment / NSF rate, and stable-employment percentage? A property-management company in the area should have these aggregated.
- How much new for-sale + rental construction is in the pipeline within 1–3 miles? Heavy new supply typically softens prices + rents 12–24 months out; constrained supply supports both.
Investment metrics
- 1% rule
- 0.74% ✗
- Cap rate
- 5.74%
- Cash-on-cash
- -1.96%
- DSCR
- 0.91
- GRM
- 11.2
CMA / ARV
- ARV (on-the-fly)
- $286,632
- Comps found
- 12
Show comp detail 12 sales within ~0.75 mi
| Address | Dist | Beds/Ba | Sqft | Sold | Price | $/sf | Match |
|---|---|---|---|---|---|---|---|
| 1336 Hafford Rd | 0.10mi | 3/2.5 | 1,418 (+7%) | 1mo | $276,000 | $195 | 83 |
| 1375 Longlac Rd | 0.10mi | 3/2.5 | 1,230 (-7%) | 2mo | $279,900 | $228 | 81 |
| 1360 Battleford Dr | 0.06mi | 3/1.5 | 1,247 (-6%) | 4mo | $275,000 | $221 | 80 |
| 4920 April Ave | 0.32mi | 2/2.5 (-1) | 1,356 (+2%) | 5mo | $230,000 | $170 | 72 |
| 1374 Orillia Rd | 0.17mi | 3/2.5 | 1,480 (+12%) | 6mo | $260,000 | $176 | 67 |
| 2122 Lyndora Rd | 0.45mi | 3/2.5 | 1,440 (+8%) | 2mo | $310,000 | $215 | 63 |
| 5200 Settlers Park Dr | 0.60mi | 2/2.5 (-1) | 1,360 (+2%) | 4mo | $294,000 | $216 | 59 |
| 5226 Westhaven Cres | 0.66mi | 2/2.5 (-1) | 1,360 (+2%) | 2mo | $294,900 | $217 | 59 |
| 1558 Jameson Dr | 0.69mi | 3/2.5 | 1,376 (+4%) | 5mo | $310,000 | $225 | 58 |
| 5210 Westhaven Cres | 0.63mi | 2/2.5 (-1) | 1,400 (+6%) | 0mo | $290,000 | $207 | 56 |
| 2081 Lyndora Rd | 0.39mi | 3/2.0 | 1,160 (-13%) | 7mo | $272,000 | $234 | 53 |
| 5276 Settlers Park Dr | 0.74mi | 2/2.5 (-1) | 1,510 (+14%) | 6mo | $285,000 | $189 | 32 |
Match score weights: distance 35% · size 25% · config 20% · recency 20%. Top-matched comps best support the ARV.
Projected returns pro-forma
-3.0% appreciation · 6.36% rent growth · sell at horizon
- IRR
- -16.2%
- Equity multiple
- 0.41×
- Total profit
- $-50,465
- Equity at exit
- $45,476
- IRR
- -3.2%
- Equity multiple
- 0.76×
- Total profit
- $-20,882
- Equity at exit
- $26,371
Cash invested: $85,400 (down + closing). Projections, not guarantees.
Landlord ↔ Tenant lean methodology
- Overall (STATE)
- 55 Moderately Landlord-Leaning
- State Virginia
- 55 Moderately Landlord-Leaning · D+2
- County
- — inherits STATE
- City
- — inherits STATE
ZIP-level market 23464
- Rents YoY
- 6.4%
- Active inventory
- 225
- Price-to-rent
- 11.2×
Monthly cashflow live
- Estimated rent
- $2,265 high interval (Pro) →
- Mortgage (P&I)
- −$1,599
- Tax from tax record
- −$202 /mo · $2,428/yr
- Insurance
- −$127
- HOA
- −$0
- Vacancy / Maint / Mgmt
- −$476
- Net cashflow
- $-139
Break-even live
UW: 25.0% down · 7.5% · 30yr · 1.5% tax · 5.0% vac · 8.0% maint · 8.0% mgmt
Financing live
Cash to close
- Down payment
- $76,250
- Closing costs
- $9,150
- Reserves months
- —
- Total cash needed
- —
Loan-product check · same deal, 3 products live
Conventional
25% down · 7.5% · 30yr
- Down + closing
- —
- Monthly P&I
- —
- Monthly cashflow
- —
- DSCR
- —
- Eligible?
- —
Personal DTI + credit; lowest rate.
DSCR
20% down · 8.5% · 30yr
- Down + closing
- —
- Monthly P&I
- —
- Monthly cashflow
- —
- DSCR
- —
- Eligible?
- —
No personal income docs; deal must DSCR.
Hard money
10% down · 12.0% · 12mo
- Down + closing
- —
- Monthly P&I
- —
- Monthly cashflow
- —
- DSCR
- —
- Eligible?
- —
Short-term bridge; refi at stabilization.
Rent comps 24 comps
| Address | Beds | Baths | Sqft | Rent | $/sqft | DOM | Units | Dist |
|---|---|---|---|---|---|---|---|---|
| 1355 Battleford Dr Virginia Beach, VA | 2.0 | 2.5 | 1335 | $1,875 | $1.40 | 23d | 1 | 0.06mi |
| 1332 Gravenhurst Cir Virginia Beach, VA | 3.0 | 2.5 | 1505 | $2,295 | $1.52 | 1d | 1 | 0.11mi |
| 1424 Marmora Rd Virginia Beach, VA | 3.0 | 2.0 | 1300 | $2,650 | $2.04 | 4d | 1 | 0.13mi |
| 1547 Heritage Ave Virginia Beach, VA | 3.0 | 2.5 | 1665 | $2,295 | $1.38 | 23d | 1 | 0.38mi |
| 1520 Oak Knoll Ln Virginia Beach, VA | 3.0 | 2.5 | 1300 | $2,400 | $1.85 | 23d | 1 | 0.46mi |
| 5104 Settlers Park Dr Virginia Beach, VA | 3.0 | 2.5 | 1540 | $2,200 | $1.43 | 14d | 1 | 0.59mi |
| 1521 Jameson Dr Virginia Beach, VA | 3.0 | 2.5 | 1496 | $1,895 | $1.27 | 23d | 1 | 0.75mi |
| 1563 Jameson Dr Virginia Beach, VA | 3.0 | 2.5 | 1334 | $2,200 | $1.65 | 3d | 1 | 0.75mi |
| 1407 Rand Ct Virginia Beach, VA | 2.0 | 2.0 | 1014 | $1,695 | $1.67 | 23d | 1 | 0.84mi |
| 1422 Deerpond Ln Virginia Beach, VA | 2.0 | 2.0 | 1015 | $1,695 | $1.67 | 21d | 1 | 0.91mi |
| 1420 Deerpond Ln Virginia Beach, VA | 2.0 | 2.0 | 1014 | $1,695 | $1.67 | 23d | 1 | 0.92mi |
| 4708 Glencoe Ln Virginia Beach, VA | 3.0 | 2.5 | 1760 | $2,400 | $1.36 | 23d | 1 | 0.95mi |
| 5326 Lake Victoria Arch Virginia Beach, VA | 2.0 | 2.5 | 1202 | $1,675 | $1.39 | 23d | 1 | 0.95mi |
| 5326 Lake Victoria Arch Virginia Beach, VA | 2.0 | 2.5 | 1202 | $1,675 | $1.39 | 19d | 1 | 0.95mi |
| 4718 Greenlaw Dr Virginia Beach, VA | 3.0 | 2.5 | 1760 | $2,150 | $1.22 | 17d | 1 | 1.00mi |
| 5112 Edon Hall Ln Virginia Beach, VA | 3.0 | 2.5 | 1445 | $2,295 | $1.59 | 14d | 1 | 1.02mi |
| 1749 Lacrosse Dr Virginia Beach, VA | 1.0–2.0 | 1.0–2.0 | 905 | $2,189 | $2.42 | 1d | 7 | 1.09mi |
| 5129 Earlston Ln Virginia Beach, VA | 4.0 | 2.0 | 1200 | $800 | $0.67 | 17d | 1 | 1.12mi |
| 5140 Glenwood Way Virginia Beach, VA | 3.0 | 2.5 | 1450 | $2,195 | $1.51 | 21d | 1 | 1.17mi |
| 4220 Derby Wharf Dr Virginia Beach, VA | 3.0 | 2.0 | 1503 | $2,395 | $1.59 | 23d | 1 | 1.27mi |
| 5036 Glenwood Way Virginia Beach, VA | 3.0 | 2.5 | 1455 | $2,495 | $1.71 | 7d | 1 | 1.28mi |
| 4244 Spruce Knob Rd Virginia Beach, VA | 3.0 | 3.0 | 1710 | $2,700 | $1.58 | 14d | 1 | 1.31mi |
| 4353 Cattail Ln #28 Virginia Beach, VA | 3.0 | 2.5 | 1695 | $2,600 | $1.53 | 10d | 1 | 1.46mi |
| 1548 Beachview Dr Virginia Beach, VA | 4.0 | 2.0 | 1800 | $2,800 | $1.56 | 14d | 1 | 1.49mi |
Listing history 21 events
-
2026-06-10status $305,000 Under Contract 16 DOM
-
2026-06-09days on market $305,000 Active 16 DOM
-
2026-06-08days on market $305,000 Active 15 DOM
-
2026-06-07days on market $305,000 Active 14 DOM
-
2026-06-03days on market $305,000 Active 10 DOM
-
2026-06-02days on market $305,000 Active 9 DOM
-
2026-06-01days on market $305,000 Active 8 DOM
-
2026-05-31days on market $305,000 Active 7 DOM
-
2026-05-25$305,000 Active
-
2026-05-22$305,000
-
2018-02-16soldstatus $110,000
-
2018-02-06status Under Contract
-
2017-06-19price $125,000
-
2017-06-19$125,000 Active
-
2017-06-19historical
-
2017-02-23price $100,000
-
2017-02-17price $120,000
-
2017-02-02price $130,000
-
2017-01-23price $150,000
-
2017-01-12$160,000 Active
-
2002-05-29soldstatus $81,000
ⓘ Source: listings_history table (triggers on properties + properties_extension) + one-shot
backfill from property_details.listing_events for pre-trigger history.
Tax reassessment forecast VA · Resets to sale price
- Current annual tax
- $2,428 · $202/mo
- Projected year-2 tax
- $2,501 · $208/mo
- Expected delta
- +$73/yr (+$6/mo · 3.0%)
ⓘ Screening estimate from a state-policy table — verify with the county assessor before closing.
Climate risk First Street
- Flood 1/10 Low FEMA zone X (unshaded) · 0% chance over 30 yrs
- Wildfire 4/10 Moderate
- Heat 9/10 Extreme 7 d/yr ≥105°F today · 16 d/yr by 30 yrs out
- Wind 8/10 Severe 80% chance of damaging wind over 30 yrs
- Air quality 5/10 Major 7 unhealthy d/yr today · 7 by 30 yrs out
Nearby sold comps map
Loading sold comps map…
Walkable amenities ~0.75 mi
Loading nearby amenities…
Taxation est. · year 1
- Rental income
- $27,181
- − Mortgage interest
- −$17,085
- − Property taxes
- −$2,428
- − Insurance
- −$1,525
- − Repairs & maintenance
- −$2,174
- − Management
- −$2,174
- − Depreciation
- −$8,873
- Taxable loss
- −$7,078
- Est. tax savings @ 24.0%
- +$1,699
- After-tax cash flow
- $25/yr
For passive investors: Depreciation is non-cash, so a rental often shows a tax loss while cash-flowing — sheltering income. Rental losses are passive: they offset passive income freely, and up to $25,000/yr can offset ordinary (W-2) income if you actively participate and your MAGI is under $100k (phasing out to $0 by $150k); unused losses carry forward. On sale, claimed depreciation is recaptured at up to 25%, and gains may owe capital-gains tax (a 1031 exchange can defer both). Figures are a year-1 estimate at your 24.0% rate — not tax advice; consult a CPA.
Schools (NCES district)
- District
- Va Beach City Public School District
- NCES district ID
- 5103840
- Math proficiency
- 69% ▼ -19.00%
- Reading proficiency
- 78% ▼ -7.00%
- Median HH income
- $66,452
- Composite
- 63.81/100
- National rank
- #594
- State rank
- #10 of 131 in VA
Livability — Virginia Beach
- Score
- 83/100
- State rank
- #38
- US rank
- #880
Category grades
Schools grade is shown separately in the Schools card above.
Census & demographics
- Census place
- Virginia Beach, VA
- County
- Virginia Beach City · 448,227 people
- City population
- 448,227
- Metro
- Virginia Beach-Norfolk-Newport News, VA-NC
- Population (ZIP)
- 75,061
- Household income
- $92,468
- Rent vs Own
- Severe rent burden
- 1929.0
Population outlook (Virginia Beach County) Hauer SSP2
- Today (2025)
- 480,401 people
- By 2030
- 491,221 · +2.3%
- By 2040
- 504,882 · +5.1%
- By 2050
- 508,847 · +5.9%
- By 2075
- 504,831 · +5.1%
- By 2100
- 465,867 · -3.0%
Race, ethnicity, and origin ACS 2023
- Neighborhood character
- Diverse neighborhood (Simpson 0.68)
- Race & ethnicity
- White 50% Black 23% Asian 10% Two or more races 9% Hispanic / Latino 9%
- Hispanic origin (detail)
- Mexican 2% Puerto Rican 3%
- Common ancestry
- Slovak 2% Lithuanian 2% Italian 2%
- Foreign-born
- 11% · Canada, Vietnam, China
- Languages at home
- 85% English-only · Tagalog/Filipino 5% Spanish 5% Other Asian/Pacific 1%
Political lean MEDSL · Virginia Beach
- 2024 margin
- Toss-up / Even · D 50.7% · R 48.0% · Other 1.3%
- 2008→2024 swing
- +3.4pp toward D · 2008: -0.7pp · 2024: 2.6pp
- All cycles
- 2024: D+2.6 2020: D+5.4 2016: R+4.5 2012: R+2.5 2008: R+0.7
Not yet ingested
- Civics
- —
Market trends
- HPI YoY
- ▼ -271.27%
- Current HPI
- 324.1854
- Rent YoY
- ▲ 6.36%
- Metro
- Virginia Beach-Norfolk-Newport News, VA-NC
- State GDP YoY
- ▲ 2.40%
- F500 in state
- 50
Industry mix (Fortune 500 HQ in VA)
| Industry | F500 HQs | Revenue |
|---|---|---|
| Aerospace / Defense | 4 | $236B |
|
||
| Technology / Defense | 3 | $32B |
|
||
| Financial Services | 2 | $176B |
|
||
| Utilities | 2 | $27B |
|
||
| Insurance | 2 | $25B |
|
||
| Technology | 2 | $15B |
|
||
Price history
+276.5% since first listed13 events — show timeline
- 2026-05-25 Listed $305,000 REINMLS
- 2026-05-22 Listed $305,000 REINMLS
- 2018-02-16 Sold (Public Records) $110,000 Public Records
- 2018-02-06 Pending — REINMLS
- 2017-06-19 Price Changed $125,000 REINMLS
- 2017-06-19 Listed $125,000 REINMLS
- 2017-06-19 Listing Removed — REINMLS
- 2017-02-23 Price Changed $100,000 REINMLS
- 2017-02-17 Price Changed $120,000 REINMLS
- 2017-02-02 Price Changed $130,000 REINMLS
- 2017-01-23 Price Changed $150,000 REINMLS
- 2017-01-12 Listed $160,000 REINMLS
- 2002-05-29 Sold (Public Records) $81,000 Public Records
Property tax history
+5.3%/yrLatest (2025): $2,428 · +9.3% YoY. Source: county tax records.
Cash-flow waterfall
monthlySold comps — $/sqft
last 12 mo · ≤1 miLoading sold comps…