6727 Tinnin Rd · Ridgetop, TN
Flood risk 1/10 · Minimal
- FEMA flood zone
- X (unshaded)
- Chance of flooding over 30 yrs
- 0.0%
- Est. flood insurance / yr
- $473 – $860
Fire risk 4/10 · Minor
- Est. fire insurance / yr
- $949 – $1,763
Heat risk 5/10 · Moderate
- Hot days now (above 105°F)
- 7 days/yr
- Hot days in 30 yrs
- 20 days/yr
Wind risk 3/10 · Minor
- Chance of severe wind over 30 yrs
- 7.0%
Air-quality risk 2/10 · Minimal
- Unhealthy air days now
- 0 days/yr
- Unhealthy air days in 30 yrs
- 1 days/yr
Risk factors via First Street. Map © Google.
Why this score? — see what drove the D grade
The composite is a weighted blend of 9 inputs, each scored 0–100. Each bar is that input's sub-score; the figure is the points it added to the 100-point composite (weight × sub-score).
- Cash flow +14.3/30.0
- ARV discount +7.5/15.0
- DSCR +4.3/10.0
- Rent growth +3.5/5.0
- Livability +3.2/5.0
- 1% rule +2.7/10.0
- Condition / age +2.5/5.0
- Schools +2.2/10.0
- Appreciation +0.0/10.0
$239,900
🖨 Deal sheet 📄 Offer letter ✓ Due diligence
Listing remarks
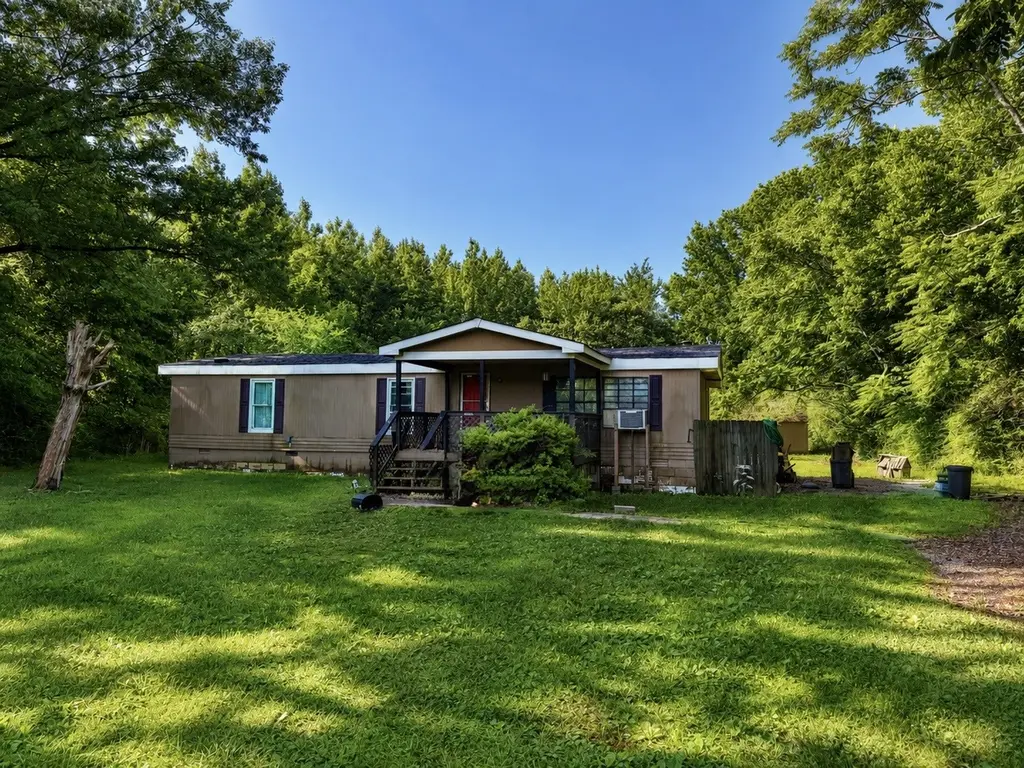
Nice opportunity to acquire 1.8 acres in the Goodlettsville/Ridgetop area, the property currently features a manufactured home on foundation in need of a little TLC, offering the potential to renovate and make it your own, use as an investment, or remove and build the custom home you've always envisioned! Plenty of room for gardens, a workshop or recreational vehicles. Conveniently located with easy access to Downtown Nashville (only 20 miles) while still enjoying the charm of country living. Storage shed in the rear will stay. Concrete pad beside the home for a future garage or to use as a large patio for entertaining, all appliances in the home will remain, Your possibilities await! This
Key facts
- 1.8 acres
- Room for gardens
- Shed in the rear
Tags
Property features AI
Finance
- Other: Living area reported as 1,196 (assessor)
- Financial info: $688 annual tax (as reported)
Exterior
- Parking: No covered parking listed; No total parking spaces listed
- Utilities: Public water available; Septic tank sewer; Water service available
- Home design: Manufactured on land (residential); Single-story
- Construction: Vinyl siding; Existing construction
- Exterior features: Covered porch; Level lot
Interior
- Kitchen: Range
- Bedrooms: 3 bedrooms (all on the main level)
- Flooring: Carpet; Vinyl
- Bathrooms: 2 full bathrooms
- Heating & cooling: No heating specified; No cooling specified
- Interior features: Range included; Crawl space basement
Neighborhood map
What this means for you Summary
Snapshot
- This is a 3-bed/1.5-bath manufactured listed at $240k.
Deal economics
- At list price, monthly cash flow is $44 ($527/yr) — positive.
- The deal already cash-flows at list — no discount required.
- To meet the 1% rule (rent ≥ 1% of price), the offer needs to be $185k (23.0% below list).
- Recommended offer: $185k (23.0% below list) — sets the bar for 1% rule.
Location & tenants
- Location reads 64/100 on livability (#166 in TN) — a middle-class / working-renter tenant base. Strengths: crime A+, cost of living A+, housing A+; Watch: amenities F, commute F, health & safety F.
- Robertson County (rural): math 22% / reading 26% proficiency, ranked #82 of 139 in TN (top 59%) — low school quality limits family demand, transient renter base, plan for 1-2y turnover.
- Zoned schools: Watauga Elementary (math 42% / reading 37%, grade F, #231 of 952 statewide, top 26%, 341 students, 0% FRL); Greenbrier High School (math 15% / reading 22%, grade F, #208 of 332 statewide, top 63%, 812 students, 0% FRL) — zoned schools average 0% FRL vs 42% district-wide (42 pts lower); this property's tenant base skews higher-income than the district average.
- Market conditions: Rents rising fast (+4.2%/yr); 234 active listings in the ZIP; 8 comparable units currently listed for rent nearby; rentals lingering (median 44d on market — plan ~5-8 weeks vacancy on turnover, expect pricing pressure); 62% of comp listings sitting > 30 days — soft ceiling on asking rent; solid renter incomes; 983 units permitted in Robertson County in 2024 (0 in 5+ unit buildings).
Forward outlook
- Local home prices are declining (-3.0%/yr); year-one equity from $2k of loan paydown is wiped out by about $7k of value loss. Plan a longer hold.
- Robertson County population projected at +7% by 2050 — modest demand growth; plan on rents tracking national, not racing it.
Negotiation context
- Only 4 days on market — expect competitive offers; lowballing is unlikely to land.
- Current owner paid $90k; list at $240k implies a 167% gain — meaningful room to come down on a strong offer.
Risks & watch-outs
- Climate carrying-cost: extreme-heat days projected 7→20/yr by 2055 (HVAC capex compounding) — expect insurance premiums to compound above CPI over the hold.
Questions for the listing agent
- Built in 1976 — when were the roof, HVAC, electrical panel, plumbing, and water heater last replaced?
- Is there a deadline driving the sale (1031 exchange, divorce, estate, relocation)? That informs how much negotiation room exists.
- Schools are D-rated, which usually means shorter tenancies and higher turnover. Who's the typical renter profile here, and what's been the actual vacancy rate?
- The area grade is low — what's the realistic commute time and amenity access for the typical tenant pool here? Any planned neighborhood developments (good or bad) we should know about?
- What's the average days-on-market for RENTAL listings here right now (not sales)? A rising rental-DOM trend means longer vacancies and softer asking-rent achievability than the comps imply.
- What's the recent tenant-quality profile in this submarket — average credit score on applications, eviction rate, late-payment / NSF rate, and stable-employment percentage? A property-management company in the area should have these aggregated.
- How much new for-sale + rental construction is in the pipeline within 1–3 miles? Heavy new supply typically softens prices + rents 12–24 months out; constrained supply supports both.
Investment metrics
- 1% rule
- 0.77% ✗
- Cap rate
- 6.51%
- Cash-on-cash
- 0.78%
- DSCR
- 1.03
- GRM
- 10.8
CMA / ARV
No comps found within radius.
Projected returns pro-forma
-3.0% appreciation · 4.17% rent growth · sell at horizon
- IRR
- -14.0%
- Equity multiple
- 0.49×
- Total profit
- $-34,000
- Equity at exit
- $35,770
- IRR
- -3.7%
- Equity multiple
- 0.74×
- Total profit
- $-17,254
- Equity at exit
- $20,742
Cash invested: $67,172 (down + closing). Projections, not guarantees.
Landlord ↔ Tenant lean methodology
- Overall (STATE)
- 87 Strongly Landlord-Friendly
- State Tennessee
- 87 Strongly Landlord-Friendly · R+13
- County
- — inherits STATE
- City
- — inherits STATE
ZIP-level market 37072
- Home prices YoY
- -27.9%
- Rents YoY
- 4.2%
- Active inventory
- 234
- Price-to-rent
- 10.8×
Monthly cashflow live
- Estimated rent
- $1,847 high interval (Pro) →
- Mortgage (P&I)
- −$1,258
- Tax from tax record
- −$57 /mo · $688/yr
- Insurance
- −$100
- HOA
- −$0
- Vacancy / Maint / Mgmt
- −$388
- Net cashflow
- $44
Break-even live
UW: 25.0% down · 7.5% · 30yr · 1.5% tax · 5.0% vac · 8.0% maint · 8.0% mgmt
Financing live
Cash to close
- Down payment
- $59,975
- Closing costs
- $7,197
- Reserves months
- —
- Total cash needed
- —
Loan-product check · same deal, 3 products live
Conventional
25% down · 7.5% · 30yr
- Down + closing
- —
- Monthly P&I
- —
- Monthly cashflow
- —
- DSCR
- —
- Eligible?
- —
Personal DTI + credit; lowest rate.
DSCR
20% down · 8.5% · 30yr
- Down + closing
- —
- Monthly P&I
- —
- Monthly cashflow
- —
- DSCR
- —
- Eligible?
- —
No personal income docs; deal must DSCR.
Hard money
10% down · 12.0% · 12mo
- Down + closing
- —
- Monthly P&I
- —
- Monthly cashflow
- —
- DSCR
- —
- Eligible?
- —
Short-term bridge; refi at stabilization.
Rent comps 8 comps
| Address | Beds | Baths | Sqft | Rent | $/sqft | DOM | Units | Dist |
|---|---|---|---|---|---|---|---|---|
| 2034 Lake Rd Greenbrier, TN | 2.0 | 1.0 | 1500 | $1,700 | $1.13 | 3d | 1 | 0.32mi |
| 2034 Lake Rd Greenbrier, TN | 2.0 | 1.0 | 1500 | $1,700 | $1.13 | 43d | 1 | 0.32mi |
| 407 Hazel Dr Greenbrier, TN | 3.0 | 1.0 | 980 | $1,700 | $1.73 | 43d | 1 | 0.48mi |
| 109 Obryan St Goodlettsville, TN | 2.0 | 1.0 | 1250 | $1,850 | $1.48 | 23d | 1 | 1.00mi |
| 2045 Highway 41 S Greenbrier, TN | 2.0 | 2.0 | 920 | $1,180 | $1.28 | 7d | 1 | 1.39mi |
| 2045 Highway 41 S Greenbrier, TN | 2.0–3.0 | 2.0 | 973 | $1,695 | $1.74 | 43d | 10 | 1.39mi |
| 2045 U.S. 41 Unit C-01 Greenbrier, TN | 3.0 | 2.0 | 1026 | $1,275 | $1.24 | 43d | 1 | 1.45mi |
| 2045 U.S. 41 Unit G-08 Greenbrier, TN | 2.0 | 2.0 | 920 | $1,180 | $1.28 | 43d | 1 | 1.45mi |
Listing history 7 events
-
2026-06-18days on market $239,900 Active 4 DOM
-
2026-06-17days on market $239,900 Active 3 DOM
-
2026-06-16days on market $239,900 Active 2 DOM
-
2026-06-15statusdays on market $239,900 Active 1 DOM
-
2026-06-13days on market $239,900 Coming Soon 2 DOM
-
2026-06-13remarks 699-char remark
-
2026-06-13$239,900 Coming Soon 1 DOM
ⓘ Source: listings_history table (triggers on properties + properties_extension) + one-shot
backfill from property_details.listing_events for pre-trigger history.
Tax reassessment forecast TN · Resets to sale price
- Current annual tax
- $688 · $57/mo
- Projected year-2 tax
- $1,703 · $142/mo
- Expected delta
- +$1,015/yr (+$85/mo · 147.6%)
ⓘ Screening estimate from a state-policy table — verify with the county assessor before closing.
Climate risk First Street
- Flood 1/10 Low FEMA zone X (unshaded) · 0% chance over 30 yrs
- Wildfire 4/10 Moderate
- Heat 5/10 Major 7 d/yr ≥105°F today · 20 d/yr by 30 yrs out
- Wind 3/10 Moderate 7% chance of damaging wind over 30 yrs
- Air quality 2/10 Low 0 unhealthy d/yr today · 1 by 30 yrs out
Nearby sold comps map
Loading sold comps map…
Walkable amenities ~0.75 mi
Loading nearby amenities…
Taxation est. · year 1
- Rental income
- $22,166
- − Mortgage interest
- −$13,438
- − Property taxes
- −$688
- − Insurance
- −$1,200
- − Repairs & maintenance
- −$1,773
- − Management
- −$1,773
- − Depreciation
- −$6,979
- Taxable loss
- −$3,685
- Est. tax savings @ 24.0%
- +$884
- After-tax cash flow
- $1,411/yr
For passive investors: Depreciation is non-cash, so a rental often shows a tax loss while cash-flowing — sheltering income. Rental losses are passive: they offset passive income freely, and up to $25,000/yr can offset ordinary (W-2) income if you actively participate and your MAGI is under $100k (phasing out to $0 by $150k); unused losses carry forward. On sale, claimed depreciation is recaptured at up to 25%, and gains may owe capital-gains tax (a 1031 exchange can defer both). Figures are a year-1 estimate at your 24.0% rate — not tax advice; consult a CPA.
Schools (NCES district)
- District
- Robertson County
- NCES district ID
- 4703600
- Math proficiency
- 22% ▼ -11.00%
- Reading proficiency
- 26% ▼ -5.00%
- Median HH income
- $53,503
- Composite
- 21.55/100
- National rank
- #8313
- State rank
- #82 of 139 in TN
Livability — Ridgetop
- Score
- 64/100
- State rank
- #166
- US rank
- #14349
Category grades
Schools grade is shown separately in the Schools card above.
Census & demographics
- Census place
- Ridgetop, TN
- County
- Sumner County · 196,654 people
- Metro
- Nashville-Davidson--Murfreesboro--Franklin, TN
- Population (ZIP)
- 32,208
- Household income
- $78,123
- Rent vs Own
- Severe rent burden
- 1013.0
Population outlook (Robertson County) Hauer SSP2
- Today (2025)
- 72,786 people
- By 2030
- 74,478 · +2.3%
- By 2040
- 76,948 · +5.7%
- By 2050
- 77,618 · +6.6%
- By 2075
- 77,545 · +6.5%
- By 2100
- 72,836 · +0.1%
Race, ethnicity, and origin ACS 2023
- Neighborhood character
- Diverse neighborhood (Simpson 0.55)
- Race & ethnicity
- White 64% Black 17% Hispanic / Latino 10% Two or more races 9% Asian 2%
- Hispanic origin (detail)
- Mexican 7% Puerto Rican 1%
- Common ancestry
- Italian 3% Slovak 2% Serbian 2%
- Foreign-born
- 6% · Canada
- Languages at home
- 91% English-only · Spanish 7% Other Indo-European 1% Other Asian/Pacific 1%
Political lean MEDSL · Robertson
- 2024 margin
- Solid R (+50.9) · D 24.0% · R 74.9% · Other 1.1%
- 2008→2024 swing
- -19.8pp toward R · 2008: -31.1pp · 2024: -50.9pp
- All cycles
- 2024: R+50.9 2020: R+47.0 2016: R+47.2 2012: R+35.6 2008: R+31.1
Not yet ingested
- Civics
- —
Market trends
- HPI YoY
- ▼ -110.17%
- Current HPI
- 284.0523
- Rent YoY
- ▲ 4.17%
- Metro
- Nashville-Davidson--Murfreesboro--Franklin, TN
- State GDP YoY
- ▲ 2.78%
- F500 in state
- 22
Industry mix (Fortune 500 HQ in TN)
| Industry | F500 HQs | Revenue |
|---|---|---|
| Healthcare | 3 | $91B |
|
||
| Retail | 3 | $72B |
|
||
| Transportation / Logistics | 1 | $88B |
|
||
| Paper / Packaging | 1 | $19B |
|
||
| Insurance | 1 | $13B |
|
||
| Energy | 1 | $12B |
|
||
Price history
+379.8% since first listed5 events — show timeline
- 2026-06-11 Coming Soon $239,900 REALTRACS as Distributed by MLS Grid
- 2022-07-21 Sold (Public Records) $90,000 Public Records
- 2019-11-05 Sold (Public Records) $440,000 Public Records
- 2015-07-07 Sold (Public Records) $50,000 Public Records
- 1989-08-02 Sold (Public Records) $50,000 Public Records
Property tax history
+6.9%/yrLatest (2025): $688 · +0.1% YoY. Source: county tax records.
Cash-flow waterfall
monthlySold comps — $/sqft
last 12 mo · ≤1 miLoading sold comps…