27 Litchfield Tpke · New Preston, CT
Flood risk 1/10 · Minimal
- FEMA flood zone
- X
- Chance of flooding over 30 yrs
- 0.0%
- Est. flood insurance / yr
- $473 – $860
Fire risk 4/10 · Minor
- Est. fire insurance / yr
- $829 – $1,539
Heat risk 4/10 · Minor
- Hot days now (above 95°F)
- 7 days/yr
- Hot days in 30 yrs
- 15 days/yr
Wind risk 4/10 · Minor
- Chance of severe wind over 30 yrs
- 17.0%
Air-quality risk 2/10 · Minimal
- Unhealthy air days now
- 1 days/yr
- Unhealthy air days in 30 yrs
- 2 days/yr
Risk factors via First Street. Map © Google.
Why this score? — see what drove the B grade
The composite is a weighted blend of 9 inputs, each scored 0–100. Each bar is that input's sub-score; the figure is the points it added to the 100-point composite (weight × sub-score).
- Cash flow +22.4/30.0
- ARV discount +15.0/15.0
- DSCR +7.2/10.0
- Schools +6.3/10.0
- Appreciation +5.9/10.0
- 1% rule +5.2/10.0
- Livability +3.5/5.0
- Rent growth +2.5/5.0
- Condition / age +2.5/5.0
$475,000
🖨 Deal sheet 📄 Offer letter ✓ Due diligence
Listing remarks
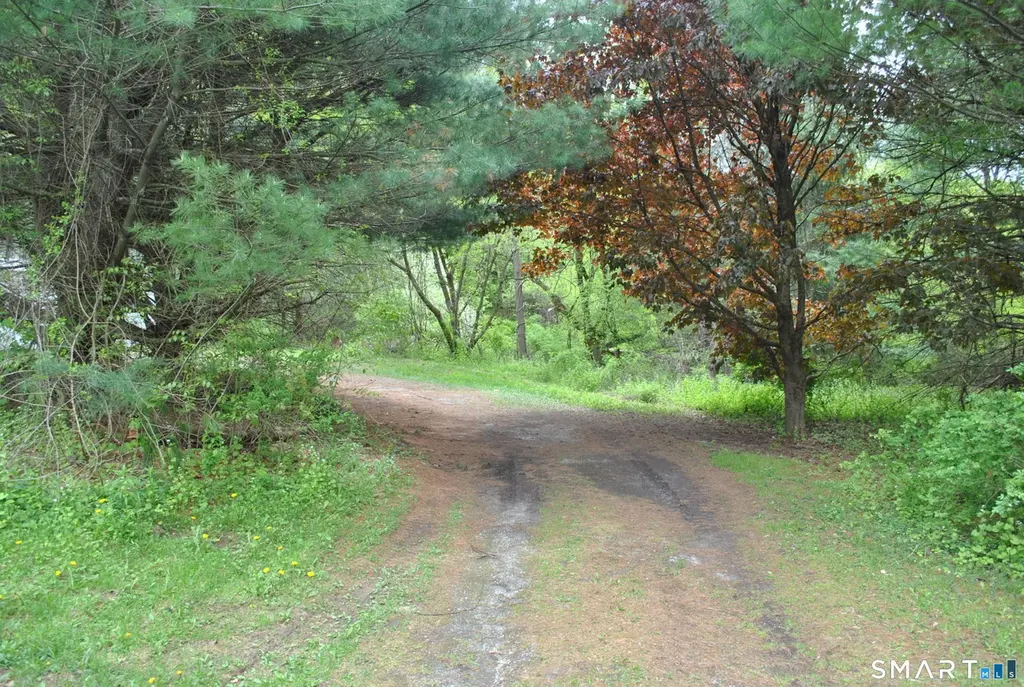
Bring your imagination to 27 Litchfield Turnpike in New Preston. Turn this three-bedroom home on over 5.8 acres into your own. Home is being sold "As Is". In-law apartment over the garage. Plenty of open land and fields. The home is set off the main road to ensure some privacy. Close to Lake Waramaug, Hopkins Inn, Hopkins Vineyard, Washington Depot, New Preston, Marbledale and more. This is a great opportunity to revive this home and add great value.
Key facts
- In-law apartment
- Open land
- Privacy
Tags
Property features AI
Finance
- Other: Property located in Connecticut, Litchfield County; Nearby amenities: golf course, lake, library, medical facilities, private schools
Exterior
- Parking: Attached garage; 2-car garage
- Utilities: Private well water; Septic sewage; Electric service
- Home design: Single-family home for sale
- Construction: Frame construction; Concrete foundation; Asphalt shingle roof; Aluminum siding
- Exterior features: Deck; Gutters; Lightly wooded, treed, level lot
Interior
- Kitchen: Oven/Range; Range hood; Refrigerator; Dishwasher
- Bedrooms: 3 bedrooms
- Bathrooms: 3 full bathrooms; 1 half bathroom
- Heating & cooling: Electric baseboard heat; Electric domestic hot water
- Interior features: 8 total rooms; Full, partially finished walk-out basement with concrete floor, interior and garage access, and heating; Has attic with access via hatch; In-law apartment possible with over-garage access; One fireplace
- Laundry & utility: Washer and dryer included; Laundry room on lower level
Neighborhood map
What this means for you Summary
Snapshot
- This is a 3-bed/3.5-bath single-family listed at $475k.
Deal economics
- At list price, monthly cash flow is $795 ($10k/yr) — positive.
- The deal already cash-flows at list — no discount required.
- Meets the 1% rule at list price ($5k rent vs $475k).
- Recommended offer: $468k (1.5% below list) — sets the bar for market timing.
- Cap rate 8.3% vs local median 4.0% in New Preston — top-decile yield for the area; either an underpriced asset or a hidden risk that comps aren't pricing in. Stress-test before assuming the spread holds.
Location & tenants
- Location reads 69/100 on livability (#105 in CT) — a middle-class / working-renter tenant base. Strengths: crime A+, employment A+, housing A+; Watch: amenities F, commute F, cost of living F.
- Regional School District 12 (rural): math 64% / reading 77% proficiency, ranked #20 of 153 in CT (top 13%) — strong family-tenant draw, lease renewals of 3-5y typical; only 8% free/reduced lunch — higher-income household profile.
- Zoned schools: Washington Primary School (math 64% / reading 84%, grade A, #44 of 553 statewide, top 10%, 162 students, 25% FRL); Shepaug Valley School (math 61% / reading 76%, grade B, #23 of 194 statewide, top 12%, 494 students, 21% FRL) — zoned schools average 23% FRL vs 8% district-wide (15 pts higher); higher-poverty schools than district average — tighter screening recommended.
- Market conditions: 14 active listings in the ZIP; 154 units permitted in Northwest Hills Planning Region in 2024 (6 in 5+ unit buildings).
Forward outlook
- In year one you build about $12k of equity ($3k loan paydown + $9k appreciation (1.9% local appreciation)).
- At projected returns (1.9% appreciation + 3.0% rent growth), your $133k cash investment doubles in ~6 years — after that, you're playing with house money.
- By year 3, paydown + projected appreciation supports a ~$31k cash-out refi (75% LTV) — recoverable capital for the next deal without selling this one.
Negotiation context
- It's been on market 30 days — a 2% lower offer ($468k) is reasonable based on typical stale-listing flexibility.
- 4 sale attempts since 29y ago with the ask held roughly flat each time — persistent listings suggest the price (not the market) is what's stuck; bring a comps-based counter.
Questions for the listing agent
- Is there a deadline driving the sale (1031 exchange, divorce, estate, relocation)? That informs how much negotiation room exists.
- What's the average days-on-market for RENTAL listings here right now (not sales)? A rising rental-DOM trend means longer vacancies and softer asking-rent achievability than the comps imply.
- What's the recent tenant-quality profile in this submarket — average credit score on applications, eviction rate, late-payment / NSF rate, and stable-employment percentage? A property-management company in the area should have these aggregated.
- How much new for-sale + rental construction is in the pipeline within 1–3 miles? Heavy new supply typically softens prices + rents 12–24 months out; constrained supply supports both.
Investment metrics
- 1% rule
- 1.02% ✓
- Cap rate
- 8.30%
- Cash-on-cash
- 7.18%
- DSCR
- 1.32
- GRM
- 8.2
CMA / ARV
- ARV (median comp)
- $910,599
- List price
- $475,000
- Delta
- -47.84%
- Verdict
- UNDERPRICED
- Comps
- 3 within 1.0 mi
Show comp detail 1 sale within ~0.75 mi
| Address | Dist | Beds/Ba | Sqft | Sold | Price | $/sf | Match |
|---|---|---|---|---|---|---|---|
| 112 Christian St | 0.42mi | 3/2.5 | 1,848 (+10%) | 23mo | $1,201,000 | $650 | 42 |
Match score weights: distance 35% · size 25% · config 20% · recency 20%. Top-matched comps best support the ARV.
Projected returns pro-forma
1.88% appreciation · 3.0% rent growth · sell at horizon
- IRR
- 11.3%
- Equity multiple
- 1.60×
- Total profit
- $80,332
- Equity at exit
- $184,371
- IRR
- 14.2%
- Equity multiple
- 2.89×
- Total profit
- $250,710
- Equity at exit
- $263,225
Cash invested: $133,000 (down + closing). Projections, not guarantees.
Landlord ↔ Tenant lean methodology
- Overall (STATE)
- 27 Tenant-Leaning
- State Connecticut
- 27 Tenant-Leaning · D+7
- County
- — inherits STATE
- City
- — inherits STATE
ZIP-level market 06777
- Home prices YoY
- 0.7%
- Active inventory
- 14
- Price-to-rent
- 8.2×
Monthly cashflow live
- Estimated rent
- $4,833 medium interval (Pro) →
- Mortgage (P&I)
- −$2,491
- Tax from tax record
- −$334 /mo · $4,010/yr
- Insurance
- −$198
- HOA
- −$0
- Vacancy / Maint / Mgmt
- −$1,015
- Net cashflow
- $795
Break-even live
UW: 25.0% down · 7.5% · 30yr · 1.5% tax · 5.0% vac · 8.0% maint · 8.0% mgmt
Financing live
Cash to close
- Down payment
- $118,750
- Closing costs
- $14,250
- Reserves months
- —
- Total cash needed
- —
Loan-product check · same deal, 3 products live
Conventional
25% down · 7.5% · 30yr
- Down + closing
- —
- Monthly P&I
- —
- Monthly cashflow
- —
- DSCR
- —
- Eligible?
- —
Personal DTI + credit; lowest rate.
DSCR
20% down · 8.5% · 30yr
- Down + closing
- —
- Monthly P&I
- —
- Monthly cashflow
- —
- DSCR
- —
- Eligible?
- —
No personal income docs; deal must DSCR.
Hard money
10% down · 12.0% · 12mo
- Down + closing
- —
- Monthly P&I
- —
- Monthly cashflow
- —
- DSCR
- —
- Eligible?
- —
Short-term bridge; refi at stabilization.
Listing history 18 events
-
2026-06-13statusdays on market $475,000 Under Contract 30 DOM
-
2026-06-10days on market $475,000 Under Contract - Continue to Show 29 DOM
-
2026-06-09days on market $475,000 Under Contract - Continue to Show 28 DOM
-
2026-06-08days on market $475,000 Under Contract - Continue to Show 27 DOM
-
2026-06-07days on market $475,000 Under Contract - Continue to Show 26 DOM
-
2026-06-05days on market $475,000 Under Contract - Continue to Show 23 DOM
-
2026-06-03days on market $475,000 Under Contract - Continue to Show 22 DOM
-
2026-06-02days on market $475,000 Under Contract - Continue to Show 21 DOM
-
2026-06-01days on market $475,000 Under Contract - Continue to Show 20 DOM
-
2026-05-31days on market $475,000 Under Contract - Continue to Show 19 DOM
-
2026-05-30days on market $475,000 Under Contract - Continue to Show 18 DOM
-
2026-05-12$475,000 Active 464-char remark
-
1999-07-07soldstatus $217,500
-
1998-08-06$229,900
-
1998-04-20historical
-
1998-04-20historical
-
1997-11-18$264,000
-
1997-11-17$264,000
ⓘ Source: listings_history table (triggers on properties + properties_extension) + one-shot
backfill from property_details.listing_events for pre-trigger history.
Tax reassessment forecast CT · Partial reset (capped growth)
- Current annual tax
- $4,010 · $334/mo
- Projected year-2 tax
- $7,088 · $591/mo
- Expected delta
- +$3,078/yr (+$256/mo · 76.7%)
ⓘ Screening estimate from a state-policy table — verify with the county assessor before closing.
Climate risk First Street
- Flood 1/10 Low FEMA zone X · 0% chance over 30 yrs
- Wildfire 4/10 Moderate
- Heat 4/10 Moderate 7 d/yr ≥95°F today · 15 d/yr by 30 yrs out
- Wind 4/10 Moderate 17% chance of damaging wind over 30 yrs
- Air quality 2/10 Low 1 unhealthy d/yr today · 2 by 30 yrs out
Nearby sold comps map
Loading sold comps map…
Walkable amenities ~0.75 mi
Loading nearby amenities…
Taxation est. · year 1
- Rental income
- $58,000
- − Mortgage interest
- −$26,607
- − Property taxes
- −$4,010
- − Insurance
- −$2,375
- − Repairs & maintenance
- −$4,640
- − Management
- −$4,640
- − Depreciation
- −$13,818
- Taxable income
- $1,910
- Est. tax owed @ 24.0%
- −$458
- After-tax cash flow
- $9,086/yr
For passive investors: Depreciation is non-cash, so a rental often shows a tax loss while cash-flowing — sheltering income. Rental losses are passive: they offset passive income freely, and up to $25,000/yr can offset ordinary (W-2) income if you actively participate and your MAGI is under $100k (phasing out to $0 by $150k); unused losses carry forward. On sale, claimed depreciation is recaptured at up to 25%, and gains may owe capital-gains tax (a 1031 exchange can defer both). Figures are a year-1 estimate at your 24.0% rate — not tax advice; consult a CPA.
Schools (NCES district)
- District
- Regional School District 12
- NCES district ID
- 0903530
- Math proficiency
- 64% ▼ -9.00%
- Reading proficiency
- 77% ▬ 0.00%
- Median HH income
- $86,065
- Composite
- 63.18/100
- National rank
- #638
- State rank
- #20 of 153 in CT
Livability — New Preston
- Score
- 69/100
- State rank
- #105
- US rank
- #9031
Category grades
Schools grade is shown separately in the Schools card above.
Census & demographics
- City population
- 1,802
- Population (ZIP)
- 1,802
Population outlook (Northwest Hills County) Hauer SSP2
- By 2040
- 118,998
Race, ethnicity, and origin ACS 2023
- Neighborhood character
- Predominantly White (85%)
- Race & ethnicity
- White 85% Two or more races 11% Hispanic / Latino 10% Asian 3%
- Hispanic origin (detail)
- Common ancestry
- Romanian 9% Lithuanian 5% Slovak 2%
- Foreign-born
- 8% · Canada, China
- Languages at home
- 92% English-only · French/Haitian/Cajun 4% Other Asian/Pacific 3% Other Indo-European 1%
Political lean MEDSL · Northwest Hills
- 2024 margin
- Toss-up / Even · D 48.6% · R 49.9% · Other 1.6%
- All cycles
- 2024: R+1.3
Not yet ingested
- Civics
- —
Market trends
- HPI YoY
- ▲ 1.88%
- Current HPI
- 269.6504
- Rent YoY
- —
- Metro
- —
- State GDP YoY
- ▲ 1.06%
- F500 in state
- 38
Industry mix (Fortune 500 HQ in CT)
| Industry | F500 HQs | Revenue |
|---|---|---|
| Industrial Machinery | 4 | $38B |
|
||
| Insurance | 3 | $71B |
|
||
| Financial Services | 2 | $25B |
|
||
| Transportation / Logistics | 2 | $18B |
|
||
| Healthcare | 1 | $247B |
|
||
| Telecommunications | 1 | $55B |
|
||
Price history
+100.8% since first listed10 events — show timeline
- 2026-06-12 Sold (MLS) $530,000 Smart MLS
- 2026-06-11 Pending — Smart MLS
- 2026-05-19 Contingent — Smart MLS
- 2026-05-12 Listed $475,000 Smart MLS
- 1999-07-07 Sold (MLS) $217,500 Smart MLS
- 1998-08-06 Listed $229,900 Smart MLS
- 1998-04-20 Listing Removed — Smart MLS
- 1998-04-20 Listing Removed — Smart MLS
- 1997-11-18 Listed $264,000 Smart MLS
- 1997-11-17 Listed $264,000 Smart MLS
Property tax history
+0.8%/yrLatest (2023): $4,010 · +0.0% YoY. Source: county tax records.
Cash-flow waterfall
monthlySold comps — $/sqft
last 12 mo · ≤1 miLoading sold comps…