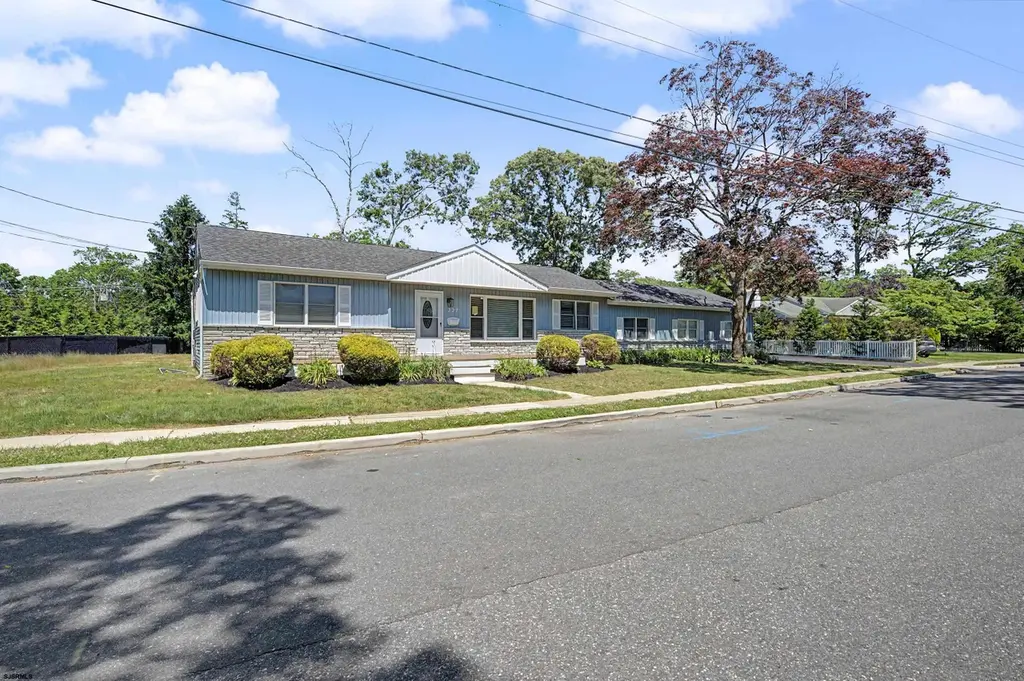
227 W Glencove Ave · Northfield, NJ
Flood risk 1/10 · Minimal
- FEMA flood zone
- X
- Chance of flooding over 30 yrs
- 0.0%
- Est. flood insurance / yr
- $507 – $1,088
Fire risk 4/10 · Minor
- Est. fire insurance / yr
- $526 – $976
Heat risk 8/10 · Major
- Hot days now (above 99°F)
- 7 days/yr
- Hot days in 30 yrs
- 16 days/yr
Wind risk 8/10 · Major
- Chance of severe wind over 30 yrs
- 80.0%
Air-quality risk 2/10 · Minimal
- Unhealthy air days now
- 1 days/yr
- Unhealthy air days in 30 yrs
- 2 days/yr
Risk factors via First Street. Map © Google.
Why this score? — see what drove the B- grade
The composite is a weighted blend of 9 inputs, each scored 0–100. Each bar is that input's sub-score; the figure is the points it added to the 100-point composite (weight × sub-score).
- Cash flow +27.1/30.0
- ARV discount +11.0/15.0
- DSCR +9.4/10.0
- 1% rule +7.7/10.0
- Schools +3.9/10.0
- Livability +3.8/5.0
- Rent growth +2.5/5.0
- Condition / age +2.5/5.0
- Appreciation +0.0/10.0
$549,777
🖨 Deal sheet 📄 Offer letter ✓ Due diligence
Listing remarks
Welcome to this beautifully updated 4-bedroom, 2.5-bath rancher in desirable Northfield! This spacious home offers comfortable one-floor living with a renovated kitchen featuring modern finishes and plenty of space for cooking and entertaining. Enjoy the convenience of an attached garage, a large driveway with ample parking, and an extra-large backyard perfect for gatherings, pets, gardening, or simply relaxing outdoors. With generous living spaces and thoughtful updates throughout, this home combines comfort, functionality, and room to grow. Conveniently located near Northfield school, shopping, dining, and just a short drive to the shore
Key facts
- Large driveway
- Attached garage
- Renovated kitchen
Tags
Property features AI
Exterior
- Parking: Attached one-car garage; Exterior parking for three or more cars
- Utilities: Public water; Public sewer; Gas water heater
- Home design: Single-family residence (R-1 zoning); Over 25 years old
- Construction: Vinyl exterior
- Exterior features: Vinyl siding; Patio; Curbs; Sidewalks; Paved road; Blacktop driveway
Interior
- Kitchen: Dishwasher; Gas stove; Refrigerator; Eat-in kitchen; Dining area
- Bedrooms: Master bedroom on first floor
- Bathrooms: 2 full bathrooms; 1 half bathroom
- Heating & cooling: Forced air heating; Natural gas
- Interior features: Carbon monoxide detector; Smoke and fire alarm; Wood-burning fireplace in family room
- Laundry & utility: Washer; Dryer; Dedicated laundry/utility room
Neighborhood map
What this means for you Summary
Snapshot
- This is a 4-bed/2.5-bath single-family listed at $550k.
Deal economics
- At list price, monthly cash flow is $2k ($19k/yr) — positive.
- The deal already cash-flows at list — no discount required.
- Meets the 1% rule at list price ($7k rent vs $550k).
- Cap rate 9.7% vs local median 5.5% in Northfield — top-decile yield for the area; either an underpriced asset or a hidden risk that comps aren't pricing in. Stress-test before assuming the spread holds.
Location & tenants
- Location reads 75/100 on livability (#155 in NJ, #3,997 nationally) — a middle-class / working-renter tenant base. Strengths: crime A+, employment A+, housing A+; Watch: amenities F, commute F, cost of living D-.
- Northfield City School District (suburban): math 32% / reading 55% proficiency, ranked #196 of 472 in NJ (top 42%) — families likely to look elsewhere, expect single-tenant / working-renter base with shorter leases; only 15% free/reduced lunch — higher-income household profile.
- Market conditions: 45 active listings in the ZIP; 1 comparable units currently listed for rent nearby; 672 units permitted in Atlantic County in 2024 (258 in 5+ unit buildings).
Forward outlook
- Local home prices are declining (-3.0%/yr); year-one equity from $4k of loan paydown is wiped out by about $16k of value loss. Plan a longer hold.
- Atlantic County population projected at -12% by 2050 — secular population decline; favor cash flow + early exit over multi-decade hold.
- At projected returns (-3.0% appreciation + 3.0% rent growth), your $154k cash investment doubles in ~10 years — after that, you're playing with house money.
Negotiation context
- Only 10 days on market — expect competitive offers; lowballing is unlikely to land.
- Current owner paid $350k; list at $550k implies a 57% gain — meaningful room to come down on a strong offer.
Risks & watch-outs
- Watch-outs: built in 1958 — expect roof / HVAC / electrical / plumbing capex.
- Climate carrying-cost: severe wind risk, 80% chance of damaging wind over 30y; extreme-heat days projected 7→16/yr by 2055 (HVAC capex compounding) — expect insurance premiums to compound above CPI over the hold.
Questions for the listing agent
- Built in 1958 — when were the roof, HVAC, electrical panel, plumbing, and water heater last replaced?
- Is there a deadline driving the sale (1031 exchange, divorce, estate, relocation)? That informs how much negotiation room exists.
- Schools are B-rated — typically a magnet for longer-tenancy family renters. What's the average tenant stay here, and is there a school-zone premium baked into asking?
- What's the average days-on-market for RENTAL listings here right now (not sales)? A rising rental-DOM trend means longer vacancies and softer asking-rent achievability than the comps imply.
- What's the recent tenant-quality profile in this submarket — average credit score on applications, eviction rate, late-payment / NSF rate, and stable-employment percentage? A property-management company in the area should have these aggregated.
- How much new for-sale + rental construction is in the pipeline within 1–3 miles? Heavy new supply typically softens prices + rents 12–24 months out; constrained supply supports both.
Investment metrics
- 1% rule
- 1.27% ✓
- Cap rate
- 9.70%
- Cash-on-cash
- 12.16%
- DSCR
- 1.54
- GRM
- 6.5
CMA / ARV
- ARV (on-the-fly)
- $595,722
- Comps found
- 12
Show comp detail 12 sales within ~0.75 mi
| Address | Dist | Beds/Ba | Sqft | Sold | Price | $/sf | Match |
|---|---|---|---|---|---|---|---|
| 625 Lexington Ct | 0.41mi | 4/2.5 | 2,242 (-3%) | 9mo | $599,000 | $267 | 69 |
| 2524 Cedarbridge Rd | 0.31mi | 3/2.5 (-1) | 2,400 (+4%) | 10mo | $650,000 | $271 | 65 |
| 602 Revere Ave | 0.26mi | 4/2.5 | 2,106 (-9%) | 13mo | $670,000 | $318 | 62 |
| 113 Parkwood Dr | 0.34mi | 3/3.0 (-1) | 2,106 (-9%) | 1mo | $542,500 | $258 | 62 |
| 2611 Cedarbridge Rd | 0.53mi | 4/2.5 | 2,500 (+8%) | 1mo | $551,000 | $220 | 60 |
| 110 E Oakcrest Ave | 0.55mi | 3/2.5 (-1) | 2,201 (-5%) | 1mo | $475,000 | $216 | 60 |
| 2300 Cedarbridge Rd | 0.29mi | 4/2.5 | 2,000 (-13%) | 13mo | $550,000 | $275 | 53 |
| 41 E Vernon Ave E | 0.47mi | 3/2.5 (-1) | 2,038 (-12%) | 1mo | $432,500 | $212 | 53 |
| 112 E Vernon Ave | 0.62mi | 5/2.5 (+1) | 2,160 (-6%) | 4mo | $437,000 | $202 | 52 |
| 130 Wilson Ave | 0.67mi | 4/4.0 | 2,400 (+4%) | 7mo | $929,000 | $387 | 50 |
| 116 Parkwood Dr | 0.38mi | 3/2.5 (-1) | 2,486 (+8%) | 18mo | $520,000 | $209 | 50 |
| 404 Cedarbrook Ln | 0.64mi | 4/3.0 | 2,600 (+13%) | 7mo | $625,000 | $240 | 41 |
Match score weights: distance 35% · size 25% · config 20% · recency 20%. Top-matched comps best support the ARV.
Projected returns pro-forma
-3.0% appreciation · 3.0% rent growth · sell at horizon
- IRR
- 1.8%
- Equity multiple
- 1.07×
- Total profit
- $10,435
- Equity at exit
- $81,974
- IRR
- 11.4%
- Equity multiple
- 1.90×
- Total profit
- $137,823
- Equity at exit
- $47,535
Cash invested: $153,938 (down + closing). Projections, not guarantees.
Landlord ↔ Tenant lean methodology
- Overall (STATE)
- 21 Tenant-Leaning
- State New Jersey
- 21 Tenant-Leaning · D+6
- County
- — inherits STATE
- City
- — inherits STATE
ZIP-level market 08225
- Home prices YoY
- -27.6%
- Active inventory
- 45
- Price-to-rent
- 6.5×
Monthly cashflow live
- Estimated rent
- $7,000 medium interval (Pro) →
- Mortgage (P&I)
- −$2,883
- Tax from tax record
- −$859 /mo · $10,303/yr
- Insurance
- −$229
- HOA
- −$0
- Vacancy / Maint / Mgmt
- −$1,470
- Net cashflow
- $1,559
Break-even live
UW: 25.0% down · 7.5% · 30yr · 1.5% tax · 5.0% vac · 8.0% maint · 8.0% mgmt
Financing live
Cash to close
- Down payment
- $137,444
- Closing costs
- $16,493
- Reserves months
- —
- Total cash needed
- —
Loan-product check · same deal, 3 products live
Conventional
25% down · 7.5% · 30yr
- Down + closing
- —
- Monthly P&I
- —
- Monthly cashflow
- —
- DSCR
- —
- Eligible?
- —
Personal DTI + credit; lowest rate.
DSCR
20% down · 8.5% · 30yr
- Down + closing
- —
- Monthly P&I
- —
- Monthly cashflow
- —
- DSCR
- —
- Eligible?
- —
No personal income docs; deal must DSCR.
Hard money
10% down · 12.0% · 12mo
- Down + closing
- —
- Monthly P&I
- —
- Monthly cashflow
- —
- DSCR
- —
- Eligible?
- —
Short-term bridge; refi at stabilization.
Rent comps 1 comps
| Address | Beds | Baths | Sqft | Rent | $/sqft | DOM | Units | Dist |
|---|---|---|---|---|---|---|---|---|
| 102 Julie Dr Northfield, NJ | 5.0 | 3.5 | 2860 | $7,000 | $2.45 | 43d | 1 | 0.84mi |
Listing history 8 events
-
2026-06-18days on market $549,777 Active 10 DOM
-
2026-06-17days on market $549,777 Active 9 DOM
-
2026-06-16days on market $549,777 Active 8 DOM
-
2026-06-15days on market $549,777 Active 7 DOM
-
2026-06-13days on market $549,777 Active 5 DOM
-
2026-06-12days on market $549,777 Active 4 DOM
-
2026-06-09remarks 647-char remark
-
2026-06-09$549,777 Active 1 DOM
ⓘ Source: listings_history table (triggers on properties + properties_extension) + one-shot
backfill from property_details.listing_events for pre-trigger history.
Tax reassessment forecast NJ · Partial reset (capped growth)
- Current annual tax
- $10,303 · $859/mo
- Projected year-2 tax
- $11,996 · $1,000/mo
- Expected delta
- +$1,693/yr (+$141/mo · 16.4%)
ⓘ Screening estimate from a state-policy table — verify with the county assessor before closing.
Climate risk First Street
- Flood 1/10 Low FEMA zone X · 0% chance over 30 yrs
- Wildfire 4/10 Moderate
- Heat 8/10 Severe 7 d/yr ≥99°F today · 16 d/yr by 30 yrs out
- Wind 8/10 Severe 80% chance of damaging wind over 30 yrs
- Air quality 2/10 Low 1 unhealthy d/yr today · 2 by 30 yrs out
Nearby sold comps map
Loading sold comps map…
Walkable amenities ~0.75 mi
Loading nearby amenities…
Taxation est. · year 1
- Rental income
- $84,000
- − Mortgage interest
- −$30,796
- − Property taxes
- −$10,303
- − Insurance
- −$2,749
- − Repairs & maintenance
- −$6,720
- − Management
- −$6,720
- − Depreciation
- −$15,994
- Taxable income
- $10,719
- Est. tax owed @ 24.0%
- −$2,573
- After-tax cash flow
- $16,139/yr
For passive investors: Depreciation is non-cash, so a rental often shows a tax loss while cash-flowing — sheltering income. Rental losses are passive: they offset passive income freely, and up to $25,000/yr can offset ordinary (W-2) income if you actively participate and your MAGI is under $100k (phasing out to $0 by $150k); unused losses carry forward. On sale, claimed depreciation is recaptured at up to 25%, and gains may owe capital-gains tax (a 1031 exchange can defer both). Figures are a year-1 estimate at your 24.0% rate — not tax advice; consult a CPA.
Schools (NCES district)
- District
- Northfield City School District
- NCES district ID
- 3411790
- Math proficiency
- 32% ▼ -21.00%
- Reading proficiency
- 55% ▲ 2.00%
- Median HH income
- $68,950
- Composite
- 39.12/100
- National rank
- #4039
- State rank
- #196 of 472 in NJ
Livability — Northfield
- Score
- 75/100
- State rank
- #155
- US rank
- #3997
Category grades
Schools grade is shown separately in the Schools card above.
Census & demographics
- Census place
- Northfield, NJ
- Population (ZIP)
- 8,427
Population outlook (Atlantic County) Hauer SSP2
- Today (2025)
- 268,948 people
- By 2030
- 264,497 · -1.7%
- By 2040
- 252,261 · -6.2%
- By 2050
- 237,846 · -11.6%
- By 2075
- 210,650 · -21.7%
- By 2100
- 180,234 · -33.0%
Race, ethnicity, and origin ACS 2023
- Neighborhood character
- Predominantly White (74%)
- Race & ethnicity
- White 74% Hispanic / Latino 11% Asian 9% Two or more races 7% Black 3%
- Hispanic origin (detail)
- Mexican 1% Puerto Rican 3% Dominican 2%
- Common ancestry
- Romanian 6% Lithuanian 3% Italian 2%
- Foreign-born
- 15% · Canada, China
- Languages at home
- 79% English-only · Spanish 6% Other Indo-European 6% Chinese 3%
Political lean MEDSL · Atlantic
- 2024 margin
- Toss-up / Even · D 47.7% · R 50.7% · Other 1.6%
- 2008→2024 swing
- -18.1pp toward R · 2008: 15.1pp · 2024: -3.0pp
- All cycles
- 2024: R+3.0 2020: D+6.7 2016: D+6.2 2012: D+17.2 2008: D+15.1
Not yet ingested
- Civics
- —
Market trends
- HPI YoY
- ▼ -115.85%
- Current HPI
- 304.5862
- Rent YoY
- —
- Metro
- —
- State GDP YoY
- ▲ 2.05%
- F500 in state
- 34
Industry mix (Fortune 500 HQ in NJ)
| Industry | F500 HQs | Revenue |
|---|---|---|
| Consumer Goods | 3 | $31B |
|
||
| Pharmaceuticals | 2 | $153B |
|
||
| Technology | 2 | $21B |
|
||
| Insurance | 2 | $20B |
|
||
| Healthcare | 2 | $19B |
|
||
| Financial Services | 1 | $70B |
|
||
Price history
+57.1% since first listed3 events — show timeline
- 2026-06-08 Listed $549,777 SJSRMLS
- 2026-05-04 Sold (Public Records) $350,000 Public Records
- 1996-03-19 Sold (Public Records) $1 Public Records
Property tax history
+2.4%/yrLatest (2025): $10,303 · +5.2% YoY. Source: county tax records.
Cash-flow waterfall
monthlySold comps — $/sqft
last 12 mo · ≤1 miLoading sold comps…