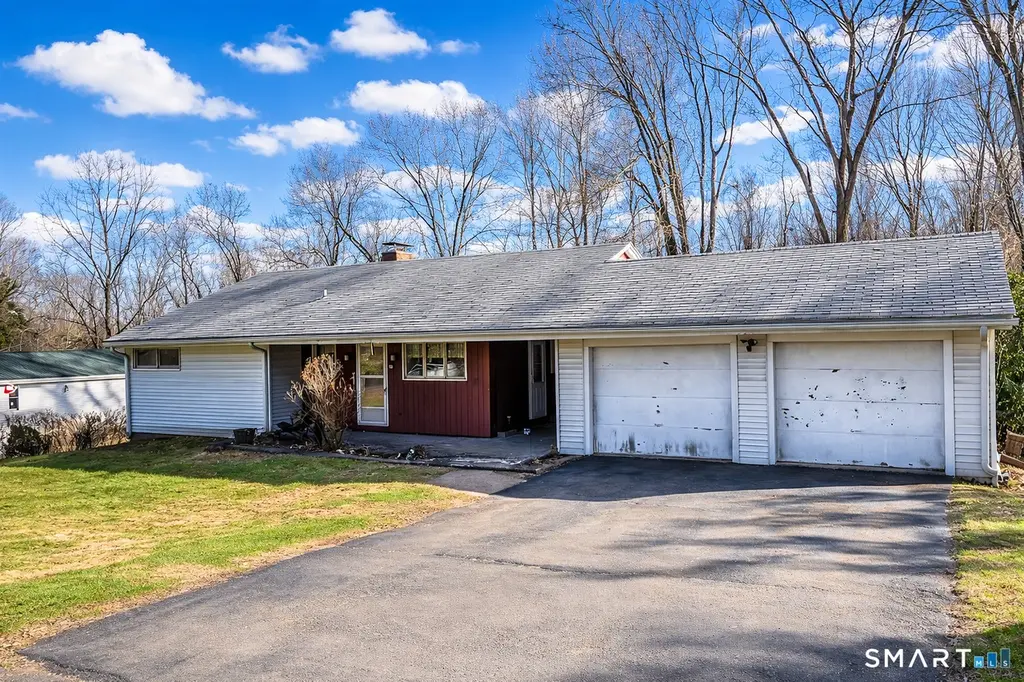
169 Cedar St · Middletown, CT
Flood risk 1/10 · Minimal
- FEMA flood zone
- X (unshaded)
- Chance of flooding over 30 yrs
- 0.0%
- Est. flood insurance / yr
- $473 – $860
Fire risk 2/10 · Minimal
- Est. fire insurance / yr
- $829 – $1,539
Heat risk 5/10 · Moderate
- Hot days now (above 98°F)
- 7 days/yr
- Hot days in 30 yrs
- 16 days/yr
Wind risk 6/10 · Moderate
- Chance of severe wind over 30 yrs
- 27.0%
Air-quality risk 3/10 · Minor
- Unhealthy air days now
- 3 days/yr
- Unhealthy air days in 30 yrs
- 4 days/yr
Risk factors via First Street. Map © Google.
Why this score? — see what drove the C+ grade
The composite is a weighted blend of 9 inputs, each scored 0–100. Each bar is that input's sub-score; the figure is the points it added to the 100-point composite (weight × sub-score).
- Cash flow +17.4/30.0
- ARV discount +15.0/15.0
- Appreciation +5.9/10.0
- DSCR +5.4/10.0
- Schools +5.2/10.0
- 1% rule +4.7/10.0
- Livability +4.0/5.0
- Rent growth +2.5/5.0
- Condition / age +2.5/5.0
$296,000
🖨 Deal sheet (PDF) 📄 Offer letter ✓ Due diligence
Listing remarks MLS
One floor living on lovely half acre lot. Spacious 1600 sf ranch. Large liv rm w/fp, eat in kit, formal din rm, two huge br, hw floors, newer furnace and hw heater, addl fp in full bsmt. Needs updating. This house has great potential! Sold as is.
Key facts
- 0.46 acre lot
- 2 garage spots
- Built 1958
Property features AI
Exterior
- Parking: Attached 2-car garage
- Utilities: Private well water; Septic sewage system; Oil fuel tank located in basement
- Home design: Single-family home
- Construction: Frame construction; Concrete foundation
- Exterior features: Patio; Level lot; Aluminum siding; Asphalt shingle roof
Interior
- Kitchen: Electric cooktop; Wall oven; Refrigerator
- Bedrooms: 2 bedrooms
- Bathrooms: 1 full bathroom
- Heating & cooling: Hot water heating (oil-fired); Wall air conditioning unit
- Interior features: Full basement; Attic with hatch access; One fireplace; Total of 5 rooms
- Laundry & utility: Laundry in lower level
Neighborhood map
What this means for you Summary
Snapshot
- This is a 2-bed/1.0-bath single-family listed at $296k.
Deal economics
- At list price, monthly cash flow is $222 ($3k/yr) — positive.
- The deal already cash-flows at list — no discount required.
- To meet the 1% rule (rent ≥ 1% of price), the offer needs to be $286k (3.4% below list).
- Recommended offer: $278k (6.0% below list) — sets the bar for market timing.
- Cap rate 7.2% vs local median 3.7% in Middletown — top-decile yield for the area; either an underpriced asset or a hidden risk that comps aren't pricing in. Stress-test before assuming the spread holds.
Location & tenants
- Location reads 81/100 on livability (#17 in CT, #1,390 nationally) — a professional / high-income tenant draw. Strengths: crime A+, amenities A+, health & safety A+; Watch: commute F.
- Regional School District 13 (rural): math 49% / reading 62% proficiency, ranked #52 of 153 in CT (top 34%) — acceptable for families but not a draw, mixed tenant base, ~2y average lease; only 6% free/reduced lunch — higher-income household profile.
- Zoned schools: John Lyman School (math 62% / reading 67%, grade B, #118 of 553 statewide, top 23%, 182 students, 12% FRL); Coginchaug Regional High School (math 52% / reading 77%, grade B-, #33 of 194 statewide, top 18%, 384 students, 16% FRL).
- Market conditions: 6 active listings in the ZIP; 4 comparable units currently listed for rent nearby; rentals at typical pace (median 15d on market — plan ~3-4 weeks tenant-placement turnaround); 278 units permitted in Lower Connecticut River Valley Planning Region in 2024 (89 in 5+ unit buildings).
Forward outlook
- In year one you build about $7k of equity ($2k loan paydown + $5k appreciation (1.8% local appreciation)).
- At projected returns (1.8% appreciation + 3.0% rent growth), your $83k cash investment doubles in ~7 years — after that, you're playing with house money.
- By year 5, paydown + projected appreciation supports a ~$33k cash-out refi (75% LTV) — recoverable capital for the next deal without selling this one.
Negotiation context
- It's been on market 79 days — a 6% lower offer ($278k) is reasonable based on typical stale-listing flexibility.
- 2 sale attempts since 12y ago with the ask held roughly flat each time — persistent listings suggest the price (not the market) is what's stuck; bring a comps-based counter.
- Current owner paid $184k; list at $296k implies a 61% gain — meaningful room to come down on a strong offer.
Risks & watch-outs
- Watch-outs: built in 1958 — expect roof / HVAC / electrical / plumbing capex.
- Climate carrying-cost: major wind risk, 27% chance of damaging wind over 30y; extreme-heat days projected 7→16/yr by 2055 (HVAC capex compounding) — expect insurance premiums to compound above CPI over the hold.
Questions for the listing agent
- It's been on market 79 days. Have you received any prior offers? Is the seller open to a 6% concession, seller financing, or rate buy-down credit?
- Built in 1958 — when were the roof, HVAC, electrical panel, plumbing, and water heater last replaced?
- Why hasn't it sold? Are there any deal-killer items the seller is aware of (foundation, flood, title, zoning, code violations)?
- Is there a deadline driving the sale (1031 exchange, divorce, estate, relocation)? That informs how much negotiation room exists.
- What's the average days-on-market for RENTAL listings here right now (not sales)? A rising rental-DOM trend means longer vacancies and softer asking-rent achievability than the comps imply.
- What's the recent tenant-quality profile in this submarket — average credit score on applications, eviction rate, late-payment / NSF rate, and stable-employment percentage? A property-management company in the area should have these aggregated.
- How much new for-sale + rental construction is in the pipeline within 1–3 miles? Heavy new supply typically softens prices + rents 12–24 months out; constrained supply supports both.
Investment metrics
- 1% rule
- 0.97% ✗
- Cap rate
- 7.19%
- Cash-on-cash
- 3.21%
- DSCR
- 1.14
- GRM
- 8.6
CMA / ARV
- ARV (on-the-fly)
- $369,112
- Comps found
- 3
Show comp detail 3 sales within ~0.75 mi
| Address | Dist | Beds/Ba | Sqft | Sold | Price | $/sf | Match |
|---|---|---|---|---|---|---|---|
| 2 Oxford Dr | 0.30mi | 3/1.0 (+1) | 1,576 (-1%) | 12mo | $359,900 | $228 | 69 |
| 4 Aresco Dr | 0.65mi | 2/1.0 | 1,468 (-8%) | 12mo | $340,000 | $232 | 47 |
| 200 Peters Ln | 0.46mi | 3/2.0 (+1) | 1,467 (-8%) | 21mo | $380,000 | $259 | 39 |
Match score weights: distance 35% · size 25% · config 20% · recency 20%. Top-matched comps best support the ARV.
Projected returns pro-forma
1.8% appreciation · 3.0% rent growth · sell at horizon
- IRR
- 7.1%
- Equity multiple
- 1.38×
- Total profit
- $31,422
- Equity at exit
- $113,521
- IRR
- 10.6%
- Equity multiple
- 2.40×
- Total profit
- $116,218
- Equity at exit
- $161,027
Cash invested: $82,880 (down + closing). Projections, not guarantees.
Landlord ↔ Tenant lean methodology
- Overall (STATE)
- 27 Tenant-Leaning
- State Connecticut
- 27 Tenant-Leaning · D+7
- County
- — inherits STATE
- City
- — inherits STATE
ZIP-level market 06481
- Home prices YoY
- 1.1%
- Active inventory
- 6
- Price-to-rent
- 8.6×
Monthly cashflow live
- Estimated rent
- $2,860 medium interval (Pro) →
- Mortgage (P&I)
- −$1,552
- Tax from tax record
- −$362 /mo · $4,343/yr
- Insurance
- −$123
- HOA
- −$0
- Vacancy / Maint / Mgmt
- −$601
- Net cashflow
- $222
Break-even live
Sensitivity live
| Price | -10% $389 | -5% $306 | +0% $222 | +5% $138 | +10% $54 |
|---|---|---|---|---|---|
| Rent | -10% $-4 | -5% $109 | +0% $222 | +5% $335 | +10% $448 |
| Rate | -1.0pp $371 | -0.5pp $297 | base $222 | +0.5pp $145 | +1.0pp $67 |
UW: 25.0% down · 7.5% · 30yr · 1.5% tax · 5.0% vac · 8.0% maint · 8.0% mgmt
Financing live
Cash to close
- Down payment
- $74,000
- Closing costs
- $8,880
- Reserves months
- —
- Total cash needed
- —
Loan-product check · same deal, 3 products live
Conventional
25% down · 7.5% · 30yr
- Down + closing
- —
- Monthly P&I
- —
- Monthly cashflow
- —
- DSCR
- —
- Eligible?
- —
Personal DTI + credit; lowest rate.
DSCR
20% down · 8.5% · 30yr
- Down + closing
- —
- Monthly P&I
- —
- Monthly cashflow
- —
- DSCR
- —
- Eligible?
- —
No personal income docs; deal must DSCR.
Hard money
10% down · 12.0% · 12mo
- Down + closing
- —
- Monthly P&I
- —
- Monthly cashflow
- —
- DSCR
- —
- Eligible?
- —
Short-term bridge; refi at stabilization.
Rent comps 4 comps
| Address | Beds | Baths | Sqft | Rent | $/sqft | DOM | Units | Dist |
|---|---|---|---|---|---|---|---|---|
| 204 Ross Rd Rockfall, CT | 2.0 | 2.0 | 1140 | $1,900 | $1.67 | 11d | 1 | 0.77mi |
| 121 Cherry Hill Rd Middlefield, CT | 3.0 | 1.0 | 1068 | $2,500 | $2.34 | 24d | 1 | 1.10mi |
| 6 Nancy Ln Unit 1261565P Middlefield, CT | 2.0 | 1.5 | 1194 | $4,876 | $4.08 | 15d | 1 | 1.28mi |
| 207 George St Middletown, CT | 1.0–2.0 | 1.0–2.0 | 949 | $2,717 | $2.86 | 3d | 23 | 1.38mi |
Listing history 16 events
-
2026-06-14statusdays on market $296,000 Under Contract 79 DOM
-
2026-06-10days on market $296,000 Under Contract - Continue to Show 78 DOM
-
2026-06-09days on market $296,000 Under Contract - Continue to Show 77 DOM
-
2026-06-08days on market $296,000 Under Contract - Continue to Show 76 DOM
-
2026-06-07days on market $296,000 Under Contract - Continue to Show 75 DOM
-
2026-06-05days on market $296,000 Under Contract - Continue to Show 72 DOM
-
2026-06-03days on market $296,000 Under Contract - Continue to Show 71 DOM
-
2026-06-03days on market $296,000 Under Contract - Continue to Show 70 DOM
-
2026-06-01days on market $296,000 Under Contract - Continue to Show 69 DOM
-
2026-05-31days on market $296,000 Under Contract - Continue to Show 68 DOM
-
2026-03-30historical Under Contract - Continue to Show
-
2026-03-25$296,000 Active
-
2026-03-16historical $296,000
-
2014-05-09soldstatus $184,000 246-char remark
Show marketing remark (246 chars)
One floor living on lovely half acre lot. Spacious 1600 sf ranch. Large liv rm w/fp, eat in kit, formal din rm, two huge br, hw floors, newer furnace and hw heater, addl fp in full bsmt. Needs updating. This house has great potential! Sold as is.
-
2014-05-09soldstatus $184,000
Show marketing remark (246 chars)
One floor living on lovely half acre lot. Spacious 1600 sf ranch. Large liv rm w/fp, eat in kit, formal din rm, two huge br, hw floors, newer furnace and hw heater, addl fp in full bsmt. Needs updating. This house has great potential! Sold as is.
-
2014-03-18$185,000 246-char remark
Show marketing remark (246 chars)
One floor living on lovely half acre lot. Spacious 1600 sf ranch. Large liv rm w/fp, eat in kit, formal din rm, two huge br, hw floors, newer furnace and hw heater, addl fp in full bsmt. Needs updating. This house has great potential! Sold as is.
ⓘ Source: listings_history table (triggers on properties + properties_extension) + one-shot
backfill from property_details.listing_events for pre-trigger history.
Tax reassessment forecast CT · Partial reset (capped growth)
- Current annual tax
- $4,343 · $362/mo
- Projected year-2 tax
- $5,339 · $445/mo
- Expected delta
- +$996/yr (+$83/mo · 22.9%)
ⓘ Screening estimate from a state-policy table — verify with the county assessor before closing.
Climate risk First Street
- Flood 1/10 Low FEMA zone X (unshaded) · 0% chance over 30 yrs
- Wildfire 2/10 Low
- Heat 5/10 Major 7 d/yr ≥98°F today · 16 d/yr by 30 yrs out
- Wind 6/10 Major 27% chance of damaging wind over 30 yrs
- Air quality 3/10 Moderate 3 unhealthy d/yr today · 4 by 30 yrs out
Nearby sold comps map
Loading sold comps map…
Walkable amenities ~0.75 mi
Loading nearby amenities…
Taxation est. · year 1
- Rental income
- $34,318
- − Mortgage interest
- −$16,581
- − Property taxes
- −$4,343
- − Insurance
- −$1,480
- − Repairs & maintenance
- −$2,745
- − Management
- −$2,745
- − Depreciation
- −$8,611
- Taxable loss
- −$2,187
- Est. tax savings @ 24.0%
- +$525
- After-tax cash flow
- $3,186/yr
For passive investors: Depreciation is non-cash, so a rental often shows a tax loss while cash-flowing — sheltering income. Rental losses are passive: they offset passive income freely, and up to $25,000/yr can offset ordinary (W-2) income if you actively participate and your MAGI is under $100k (phasing out to $0 by $150k); unused losses carry forward. On sale, claimed depreciation is recaptured at up to 25%, and gains may owe capital-gains tax (a 1031 exchange can defer both). Figures are a year-1 estimate at your 24.0% rate — not tax advice; consult a CPA.
Schools (NCES district)
- District
- Regional School District 13
- NCES district ID
- 0903535
- Math proficiency
- 49% ▼ -13.00%
- Reading proficiency
- 62% ▼ -10.00%
- Median HH income
- $101,259
- Composite
- 52.2/100
- National rank
- #1606
- State rank
- #52 of 153 in CT
Livability — Middletown
- Score
- 81/100
- State rank
- #17
- US rank
- #1390
Category grades
Schools grade is shown separately in the Schools card above.
Census & demographics
- City population
- 46,720
- Population (ZIP)
- 1,644
Population outlook (Lower Connecticut River Valley County) Hauer SSP2
- By 2040
- 188,651
Race, ethnicity, and origin ACS 2023
- Neighborhood character
- Predominantly White (86%)
- Race & ethnicity
- White 86% Asian 9% Two or more races 4% Hispanic / Latino 2%
- Common ancestry
- Romanian 17% Scotch-Irish 9% Serbian 9%
- Foreign-born
- 9% · Vietnam, Canada, Guatemala
- Languages at home
- 89% English-only · Other Indo-European 4% Spanish 2% Vietnamese 2%
Political lean MEDSL · Lower Connecticut River Valley
- 2024 margin
- D (+13.4) · D 55.9% · R 42.4% · Other 1.7%
- All cycles
- 2024: D+13.4
Not yet ingested
- Civics
- —
Market trends
- HPI YoY
- ▲ 1.80%
- Current HPI
- 163.8225
- Rent YoY
- —
- Metro
- —
- State GDP YoY
- ▲ 1.06%
- F500 in state
- 38
Industry mix (Fortune 500 HQ in CT)
| Industry | F500 HQs | Revenue |
|---|---|---|
| Industrial Machinery | 4 | $38B |
|
||
| Insurance | 3 | $71B |
|
||
| Financial Services | 2 | $25B |
|
||
| Transportation / Logistics | 2 | $18B |
|
||
| Healthcare | 1 | $247B |
|
||
| Telecommunications | 1 | $55B |
|
||
Price history
+60.0% since first listed6 events — show timeline
- 2026-03-30 Contingent — Smart MLS
- 2026-03-25 Listed $296,000 Smart MLS
- 2026-03-16 Coming Soon $296,000 Smart MLS
- 2014-05-09 Sold (Public Records) $184,000 Public Records
- 2014-05-09 Sold (MLS) $184,000 Smart MLS
- 2014-03-18 Listed $185,000 Smart MLS
Property tax history
-0.9%/yrLatest (2023): $4,343 · +2.5% YoY. Source: county tax records.
Cash-flow waterfall
monthlySold comps — $/sqft
last 12 mo · ≤1 miLoading sold comps…