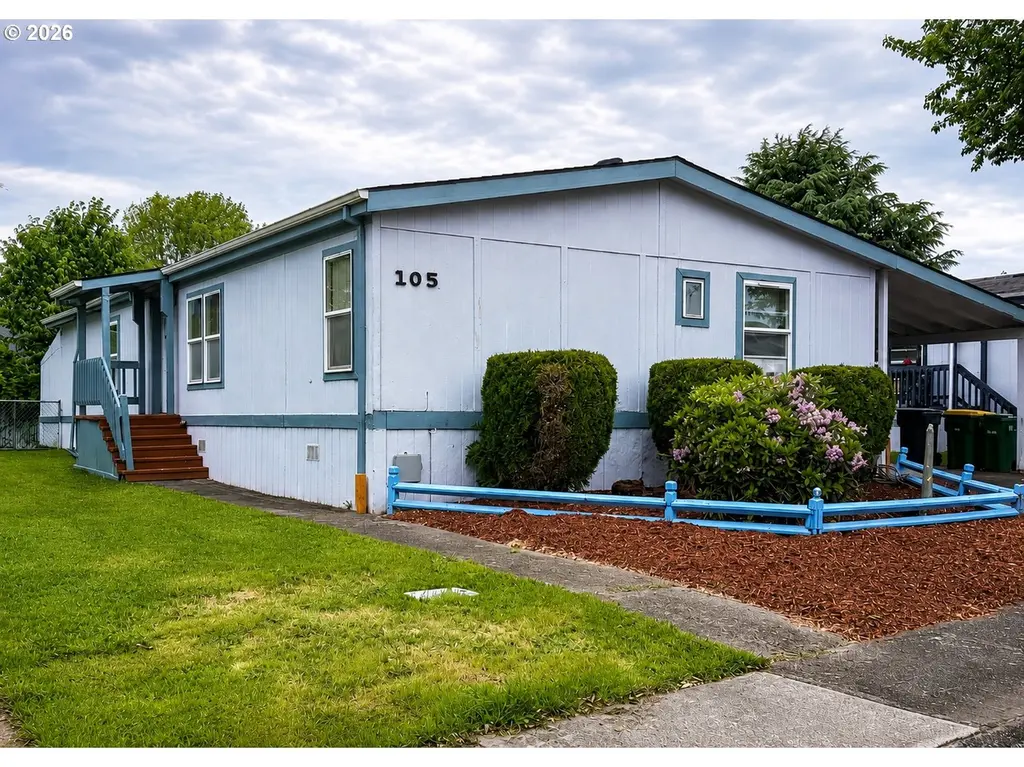
3300 Main St #105 · Forest Grove, OR
Flood risk 1/10 · Minimal
- FEMA flood zone
- X (unshaded)
- Chance of flooding over 30 yrs
- 0.0%
- Est. flood insurance / yr
- $507 – $1,088
Fire risk 3/10 · Minor
- Est. fire insurance / yr
- $498 – $926
Heat risk 3/10 · Minor
- Hot days now (above 93°F)
- 7 days/yr
- Hot days in 30 yrs
- 14 days/yr
Wind risk 1/10 · Minimal
- Chance of severe wind over 30 yrs
- —
Air-quality risk 7/10 · Major
- Unhealthy air days now
- 9 days/yr
- Unhealthy air days in 30 yrs
- 10 days/yr
Risk factors via First Street. Map © Google.
Why this score? — see what drove the C+ grade
The composite is a weighted blend of 9 inputs, each scored 0–100. Each bar is that input's sub-score; the figure is the points it added to the 100-point composite (weight × sub-score).
- Cash flow +28.2/30.0
- DSCR +10.0/10.0
- 1% rule +6.8/10.0
- ARV discount +6.2/15.0
- Livability +4.0/5.0
- Schools +3.6/10.0
- Rent growth +2.5/5.0
- Condition / age +2.5/5.0
- Appreciation +0.0/10.0
$140,000
🖨 Deal sheet 📄 Offer letter ✓ Due diligence
Listing remarks
Opportunity awaits in Quail Run Estates! This 3-bedroom, 2-bath, 1,080 SF double-wide manufactured home offers a functional floor plan and plenty of potential. Seller updated the electrical panel. Home has a skylight, primary suite with walk-in steam shower, and roof is approximately 6-7 years old. Enjoy the covered breezeway leading to a detached shop with wood stove insert, plus additional storage under the carport. Fully fenced yard. Space rent is $1,030/month and includes water and sewer. Basic cable provided through the park. Conveniently located near Forest Grove High School, public transportation, and downtown Forest Grove. Home sold AS-IS.
Key facts
- Covered breezeway
- Skylight
- Fully fenced yard
Tags
Property features AI
Finance
- Other: Located in Quail Run Estates (park); Lot rent listed monthly
- HOA & community: Community provides water and sewer
Exterior
- Parking: Carport; On-street parking
- Security: Security features: Unknown
- Utilities: Public water; Public sewer; Electricity and wood burning fuel options; Internet service: other
- Home design: Manufactured home in a park; One-level living; Fixer condition
- Construction: Built in 1993; T-111 siding; Composition roof; Block foundation
- Exterior features: Fenced yard; Outbuilding; Tool shed; Workshop
Interior
- Kitchen: Free-standing range; Free-standing refrigerator
- Bedrooms: Primary bedroom on main level; Second bedroom on main level; Third bedroom on main level
- Flooring: Vinyl flooring
- Bathrooms: Two full bathrooms (both on the main level)
- Heating & cooling: Forced-air heating; No central cooling; Hot water: electric
- Interior features: Skylights; Vinyl flooring; Double-pane windows; Washer and dryer present; Wood-burning stove fireplace
- Laundry & utility: Utility room on main level; Washer and dryer
Neighborhood map
What this means for you Summary
Snapshot
- This is a 2-bed/2.0-bath manufactured listed at $140k.
Deal economics
- At list price, monthly cash flow is $443 ($5k/yr) — positive.
- The deal already cash-flows at list — no discount required.
- Meets the 1% rule at list price ($2k rent vs $140k).
- Recommended offer: $138k (1.5% below list) — sets the bar for market timing.
- Cap rate 10.1% vs local median 2.5% in Forest Grove — top-decile yield for the area; either an underpriced asset or a hidden risk that comps aren't pricing in. Stress-test before assuming the spread holds.
Location & tenants
- Location reads 80/100 on livability (#55 in OR, #1,748 nationally) — a professional / high-income tenant draw. Strengths: commute A+, housing A+, health & safety A+; Watch: cost of living D, amenities D-.
- Forest Grove SD 15 (suburban): math 32% / reading 46% proficiency, ranked #111 of 183 in OR (top 61%) — families likely to look elsewhere, expect single-tenant / working-renter base with shorter leases.
- Zoned schools: Harvey Clarke Elementary School (425 students, 32% FRL); Neil Armstrong Middle School (math 24% / reading 75%, grade C, #26 of 128 statewide, top 21%, 826 students, 48% FRL); Forest Grove High School (1,977 students, 41% FRL).
- Market conditions: Rents soft (-0.0%/yr); 209 active listings in the ZIP; 20 comparable units currently listed for rent nearby; rentals at typical pace (median 20d on market — plan ~3-4 weeks tenant-placement turnaround); solid renter incomes; 2,224 units permitted in Washington County in 2024 (242 in 5+ unit buildings).
Forward outlook
- Local home prices are declining (-3.0%/yr); year-one equity from $968 of loan paydown is wiped out by about $4k of value loss. Plan a longer hold.
- Washington County population projected at +33% by 2050 — long-run rental-demand tailwind backs the buy-and-hold thesis.
Negotiation context
- It's been on market 16 days — a 2% lower offer ($138k) is reasonable based on typical stale-listing flexibility.
- Current owner paid $27k; list at $140k implies a 418% gain — meaningful room to come down on a strong offer.
Questions for the listing agent
- Is there a deadline driving the sale (1031 exchange, divorce, estate, relocation)? That informs how much negotiation room exists.
- What's the average days-on-market for RENTAL listings here right now (not sales)? A rising rental-DOM trend means longer vacancies and softer asking-rent achievability than the comps imply.
- What's the recent tenant-quality profile in this submarket — average credit score on applications, eviction rate, late-payment / NSF rate, and stable-employment percentage? A property-management company in the area should have these aggregated.
- How much new for-sale + rental construction is in the pipeline within 1–3 miles? Heavy new supply typically softens prices + rents 12–24 months out; constrained supply supports both.
Investment metrics
- 1% rule
- 1.18% ✓
- Cap rate
- 10.09%
- Cash-on-cash
- 13.55%
- DSCR
- 1.60
- GRM
- 7.0
CMA / ARV
- ARV (on-the-fly)
- $136,080
- Comps found
- 6
Show comp detail 6 sales within ~0.75 mi
| Address | Dist | Beds/Ba | Sqft | Sold | Price | $/sf | Match |
|---|---|---|---|---|---|---|---|
| 3300 Main St #110 | 0.00mi | 3/2.0 (+1) | 1,188 (+10%) | 6mo | $147,500 | $124 | 73 |
| 3300 Main St #41 | 0.00mi | 3/2.0 (+1) | 1,188 (+10%) | 8mo | $134,270 | $113 | 72 |
| 3300 Main St #120 | 0.10mi | 3/2.0 (+1) | 1,188 (+10%) | 9mo | $150,000 | $126 | 66 |
| 3300 Main St #139 | 0.10mi | 2/2.0 | 1,232 (+14%) | 8mo | $167,650 | $136 | 65 |
| 3300 Main St #62 | 0.00mi | 3/2.0 (+1) | 1,188 (+10%) | 16mo | $149,900 | $126 | 65 |
| 3300 Main St #64 | 0.05mi | 3/2.0 (+1) | 1,188 (+10%) | 24mo | $170,000 | $143 | 56 |
Match score weights: distance 35% · size 25% · config 20% · recency 20%. Top-matched comps best support the ARV.
Projected returns pro-forma
-3.0% appreciation · 0.0% rent growth · sell at horizon
- IRR
- 0.4%
- Equity multiple
- 1.02×
- Total profit
- $614
- Equity at exit
- $20,874
- IRR
- 7.0%
- Equity multiple
- 1.46×
- Total profit
- $17,917
- Equity at exit
- $12,105
Cash invested: $39,200 (down + closing). Projections, not guarantees.
Landlord ↔ Tenant lean methodology
- Overall (STATE)
- 28 Tenant-Leaning
- State Oregon
- 28 Tenant-Leaning · D+6
- County
- — inherits STATE
- City
- — inherits STATE
ZIP-level market 97116
- Rents YoY
- -0.0%
- Active inventory
- 209
- Price-to-rent
- 7.0×
Monthly cashflow live
- Estimated rent
- $1,657 high interval (Pro) →
- Mortgage (P&I)
- −$734
- Tax from tax record
- −$74 /mo · $889/yr
- Insurance
- −$58
- HOA
- −$0
- Vacancy / Maint / Mgmt
- −$348
- Net cashflow
- $443
Break-even live
UW: 25.0% down · 7.5% · 30yr · 1.5% tax · 5.0% vac · 8.0% maint · 8.0% mgmt
Financing live
Cash to close
- Down payment
- $35,000
- Closing costs
- $4,200
- Reserves months
- —
- Total cash needed
- —
Loan-product check · same deal, 3 products live
Conventional
25% down · 7.5% · 30yr
- Down + closing
- —
- Monthly P&I
- —
- Monthly cashflow
- —
- DSCR
- —
- Eligible?
- —
Personal DTI + credit; lowest rate.
DSCR
20% down · 8.5% · 30yr
- Down + closing
- —
- Monthly P&I
- —
- Monthly cashflow
- —
- DSCR
- —
- Eligible?
- —
No personal income docs; deal must DSCR.
Hard money
10% down · 12.0% · 12mo
- Down + closing
- —
- Monthly P&I
- —
- Monthly cashflow
- —
- DSCR
- —
- Eligible?
- —
Short-term bridge; refi at stabilization.
Rent comps 20 comps
| Address | Beds | Baths | Sqft | Rent | $/sqft | DOM | Units | Dist |
|---|---|---|---|---|---|---|---|---|
| 2736 Main St Forest Grove, OR | 2.0 | 1.5 | 900 | $1,449 | $1.61 | 1d | 1 | 0.46mi |
| 2327 Turnbull Ct Forest Grove, OR | 3.0 | 2.5 | 1447 | $2,295 | $1.59 | 23d | 1 | 0.79mi |
| 1907 23rd Ave Unit 6 Forest Grove, OR | 1.0 | 1.0 | 700 | $1,150 | $1.64 | 7d | 1 | 0.82mi |
| 2564 Hawthorne St Forest Grove, OR | 1.0–2.0 | 1.0–2.0 | 878 | $1,695 | $1.93 | 23d | 2 | 0.89mi |
| 1509 22nd Ave Apt 8 Forest Grove, OR | 2.0 | 1.0 | 832 | $1,500 | $1.80 | 20d | 1 | 0.99mi |
| 1509 22nd Ave Forest Grove, OR | 2.0 | 1.0 | 832 | $1,500 | $1.80 | 1d | 1 | 0.99mi |
| 1733 21st Ave Unit A Forest Grove, OR | 3.0 | 1.0 | 850 | $1,700 | $2.00 | 23d | 1 | 1.03mi |
| 1733 21st Ave Unit C Forest Grove, OR | 2.0 | 1.0 | 706 | $1,500 | $2.12 | 43d | 1 | 1.03mi |
| 2223 Hawthorne St Apt C Forest Grove, OR | 2.0 | 1.0 | 760 | $1,395 | $1.84 | 7d | 1 | 1.14mi |
| 2528 21st Ave Unit 6 Forest Grove, OR | 2.0 | 1.0 | 850 | $1,450 | $1.71 | 43d | 1 | 1.19mi |
| 2737 Maywood Dr Forest Grove, OR | 2.0 | 1.0 | 950 | $2,095 | $2.21 | 43d | 1 | 1.22mi |
| 2825 Pacific Ave Apt E Forest Grove, OR | 2.0 | 1.5 | 1000 | $1,600 | $1.60 | 2d | 1 | 1.34mi |
| 1719 Main St Unit 2 Forest Grove, OR | 2.0 | 1.5 | 1250 | $1,495 | $1.20 | 23d | 1 | 1.36mi |
| 1718 Birch St Unit A Forest Grove, OR | 2.0 | 1.0 | 875 | $1,575 | $1.80 | 7d | 1 | 1.37mi |
| 1806 Elm St Unit 5 Forest Grove, OR | 2.0 | 1.0 | 920 | $1,295 | $1.41 | 23d | 1 | 1.37mi |
| 40074 NW Verboort Rd Forest Grove, OR | 2.0 | 1.0 | 932 | $1,895 | $2.03 | 14d | 1 | 1.43mi |
| 1655 Douglas St Apt 10 Forest Grove, OR | 2.0 | 1.5 | 850 | $1,795 | $2.11 | 7d | 1 | 1.47mi |
| 1655 Douglas St Apt 3 Forest Grove, OR | 2.0 | 1.0 | 800 | $1,699 | $2.12 | 43d | 1 | 1.49mi |
| 3220 22nd Ave Forest Grove, OR | 1.0–2.0 | 1.0 | 691 | $1,595 | $2.31 | 1d | 3 | 1.49mi |
| 2840 19th Ave Unit 7 Forest Grove, OR | 3.0 | 2.5 | 1250 | $2,500 | $2.00 | 1d | 1 | 1.49mi |
Listing history 12 events
-
2026-06-18days on market $140,000 Active 16 DOM
-
2026-06-17price $140,000 Active 15 DOM
-
2026-06-17days on market $150,000 Active 15 DOM
-
2026-06-16days on market $150,000 Active 14 DOM
-
2026-06-15days on market $150,000 Active 13 DOM
-
2026-06-13days on market $150,000 Active 11 DOM
-
2026-06-09days on market $150,000 Active 7 DOM
-
2026-06-08days on market $150,000 Active 6 DOM
-
2026-06-07days on market $150,000 Active 5 DOM
-
2026-06-05days on market $150,000 Active 2 DOM
-
2026-06-03remarks 655-char remark
-
2026-06-03$150,000 Active 1 DOM
ⓘ Source: listings_history table (triggers on properties + properties_extension) + one-shot
backfill from property_details.listing_events for pre-trigger history.
Tax reassessment forecast OR · Resets to sale price
- Current annual tax
- $889 · $74/mo
- Projected year-2 tax
- $1,358 · $113/mo
- Expected delta
- +$469/yr (+$39/mo · 52.7%)
ⓘ Screening estimate from a state-policy table — verify with the county assessor before closing.
Climate risk First Street
- Flood 1/10 Low FEMA zone X (unshaded) · 0% chance over 30 yrs
- Wildfire 3/10 Moderate
- Heat 3/10 Moderate 7 d/yr ≥93°F today · 14 d/yr by 30 yrs out
- Wind 1/10 Low
- Air quality 7/10 Severe 9 unhealthy d/yr today · 10 by 30 yrs out
Nearby sold comps map
Loading sold comps map…
Walkable amenities ~0.75 mi
Loading nearby amenities…
Taxation est. · year 1
- Rental income
- $19,888
- − Mortgage interest
- −$7,842
- − Property taxes
- −$889
- − Insurance
- −$700
- − Repairs & maintenance
- −$1,591
- − Management
- −$1,591
- − Depreciation
- −$4,073
- Taxable income
- $3,202
- Est. tax owed @ 24.0%
- −$768
- After-tax cash flow
- $4,544/yr
For passive investors: Depreciation is non-cash, so a rental often shows a tax loss while cash-flowing — sheltering income. Rental losses are passive: they offset passive income freely, and up to $25,000/yr can offset ordinary (W-2) income if you actively participate and your MAGI is under $100k (phasing out to $0 by $150k); unused losses carry forward. On sale, claimed depreciation is recaptured at up to 25%, and gains may owe capital-gains tax (a 1031 exchange can defer both). Figures are a year-1 estimate at your 24.0% rate — not tax advice; consult a CPA.
Schools (NCES district)
- District
- Forest Grove SD 15
- NCES district ID
- 4105160
- Math proficiency
- 32% ▼ -4.00%
- Reading proficiency
- 46% ▼ -4.00%
- Median HH income
- $52,159
- Composite
- 36.31/100
- National rank
- #9395
- State rank
- #111 of 183 in OR
Livability — Forest Grove
- Score
- 80/100
- State rank
- #55
- US rank
- #1748
Category grades
Schools grade is shown separately in the Schools card above.
Census & demographics
- Census place
- Forest Grove, OR
- County
- Washington County · 583,254 people
- City population
- 29,800
- Metro
- Portland-Vancouver-Hillsboro, OR-WA
- Population (ZIP)
- 29,800
- Household income
- $92,613
- Rent vs Own
- Severe rent burden
- 1124.0
Population outlook (Washington County) Hauer SSP2
- Today (2025)
- 674,042 people
- By 2030
- 721,804 · +7.1%
- By 2040
- 812,732 · +20.6%
- By 2050
- 895,143 · +32.8%
- By 2075
- 1,058,806 · +57.1%
- By 2100
- 1,131,692 · +67.9%
Race, ethnicity, and origin ACS 2023
- Neighborhood character
- Majority White (64%)
- Race & ethnicity
- White 64% Hispanic / Latino 27% Two or more races 12% Black 2% Asian 2%
- Hispanic origin (detail)
- Mexican 24%
- Common ancestry
- Italian 4% Portuguese 4% Iranian 3%
- Foreign-born
- 12% · Canada, China
- Languages at home
- 78% English-only · Spanish 19%
Political lean MEDSL · Washington
- 2024 margin
- Solid D (+34.0) · D 65.3% · R 31.3% · Other 3.4%
- 2008→2024 swing
- +11.8pp toward D · 2008: 22.1pp · 2024: 34.0pp
- All cycles
- 2024: D+34.0 2020: D+34.6 2016: D+26.7 2012: D+17.5 2008: D+22.1
Not yet ingested
- Civics
- —
Market trends
- HPI YoY
- ▼ -440.45%
- Current HPI
- 286.6018
- Rent YoY
- ▬ -0.02%
- Metro
- Portland-Vancouver-Hillsboro, OR-WA
- State GDP YoY
- ▲ 2.05%
- F500 in state
- 2
Industry mix (Fortune 500 HQ in OR)
| Industry | F500 HQs | Revenue |
|---|---|---|
| Consumer Goods | 1 | $51B |
|
||
Price history
+454.7% since first listed2 events — show timeline
- 2026-06-02 Listed $150,000 RMLS
- 1993-01-28 Sold (Public Records) $27,043 Public Records
Property tax history
+2.6%/yrLatest (2025): $889 · +2.7% YoY. Source: county tax records.
Cash-flow waterfall
monthlySold comps — $/sqft
last 12 mo · ≤1 miLoading sold comps…