293 Bray Rd · Bliss, NY
Flood risk 1/10 · Minimal
- FEMA flood zone
- X
- Chance of flooding over 30 yrs
- 0.0%
- Est. flood insurance / yr
- $507 – $1,088
Fire risk 2/10 · Minimal
- Est. fire insurance / yr
- $691 – $1,283
Heat risk 1/10 · Minimal
- Hot days now (above 88°F)
- 7 days/yr
- Hot days in 30 yrs
- 16 days/yr
Wind risk 1/10 · Minimal
- Chance of severe wind over 30 yrs
- —
Air-quality risk 1/10 · Minimal
- Unhealthy air days now
- 0 days/yr
- Unhealthy air days in 30 yrs
- 0 days/yr
Risk factors via First Street. Map © Google.
Why this score? — see what drove the C- grade
The composite is a weighted blend of 9 inputs, each scored 0–100. Each bar is that input's sub-score; the figure is the points it added to the 100-point composite (weight × sub-score).
- Cash flow +17.3/30.0
- Appreciation +7.8/10.0
- ARV discount +7.5/15.0
- DSCR +5.4/10.0
- Schools +4.4/10.0
- 1% rule +4.1/10.0
- Livability +2.9/5.0
- Rent growth +2.5/5.0
- Condition / age +2.5/5.0
$155,000
🖨 Deal sheet (PDF) 📄 Offer letter ✓ Due diligence
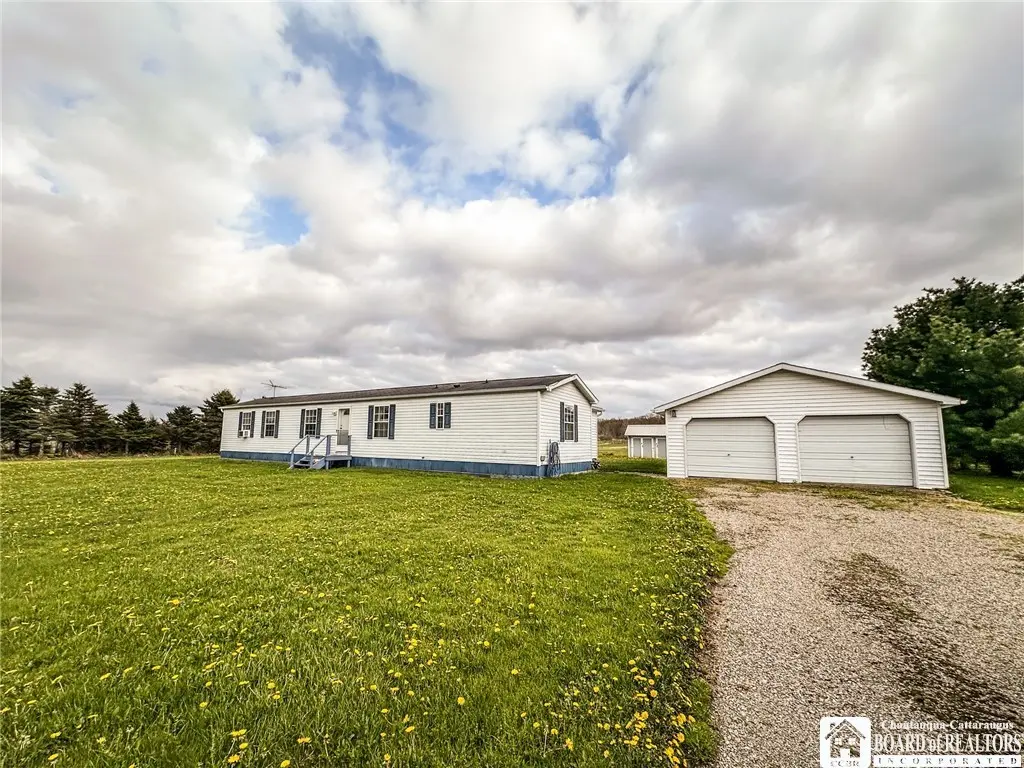
Listing remarks
This 2 bedroom, 2 full bath home is set back off the road on 2 acres of land! The foyer offers a place to set your shoes and jackets that's out of sight. Sip coffee in the sunroom while enjoying the view of your land. The spacious living room is perfect for relaxing or entertaining. The primary bedroom has it's own full bath plus a walk in closet. The second bedroom was used as an office by the previous owner. Brand new flooring has been installed in the foyer, sunroom, hallway, main bath and second bedroom! This home has the serenity of rural living while being just a short drive from all that the Village of Arcade has to offer.
Key facts
- 1.9 acre lot
- 2 garage spots
- Built 1997
Property features AI
Exterior
- Parking: Detached garage with electricity; 2 garage spaces
- Utilities: Electric service with circuit breakers; Well water; Septic tank
- Home design: Single-wide mobile home; One story; Resale condition; City street frontage
- Construction: Vinyl siding
- Exterior features: Gravel driveway; Shed(s)/storage
Interior
- Kitchen: Electric oven; Electric range; Dishwasher; Refrigerator; Eat-in kitchen
- Bedrooms: Two main-level bedrooms
- Flooring: Carpet; Laminate; Vinyl; Varies
- Bathrooms: Two full bathrooms (both on the main level)
- Heating & cooling: Electric forced-air heating
- Interior features: Ceiling fan(s); Entrance foyer; Eat-in kitchen; Separate/formal living room; Bath in primary bedroom; Main level primary bedroom
- Laundry & utility: Washer and dryer on the main level
Neighborhood map
What this means for you Summary
Snapshot
- This is a 2-bed/2.0-bath manufactured listed at $155k.
Deal economics
- At list price, monthly cash flow is $115 ($1k/yr) — positive.
- The deal already cash-flows at list — no discount required.
- To meet the 1% rule (rent ≥ 1% of price), the offer needs to be $141k (8.9% below list).
- Recommended offer: $141k (8.9% below list) — sets the bar for 1% rule.
Location & tenants
- Location reads 58/100 on livability (#1,065 in NY) — a working-class tenant base; expect higher turnover. Strengths: cost of living A+, housing A+; Watch: crime F, amenities F, commute F.
- Yorkshire-Pioneer Central School District (town): math 50% / reading 54% proficiency, ranked #358 of 590 in NY (top 61%) — acceptable for families but not a draw, mixed tenant base, ~2y average lease.
- Zoned schools: Arcade Elementary School (math 52% / reading 57%, grade C, #908 of 2,108 statewide, top 46%, 515 students, 45% FRL); Pioneer Middle School (math 35% / reading 52%, grade D, #366 of 729 statewide, top 51%, 662 students, 52% FRL); Pioneer Senior High School (math 98% / reading 95%, grade A+, #59 of 1,100 statewide, top 6%, 658 students, 42% FRL).
- Zoned-school proficiency averages 65% at this address vs 52% district-wide (+13 pts) — the actual schools serving this property are materially stronger than the Yorkshire-Pioneer Central School District average implies; a family-tenant draw the district grade alone would hide.
- Market conditions: 41 active listings in the ZIP; 128 units permitted in Cattaraugus County in 2024 (21 in 5+ unit buildings).
Forward outlook
- In year one you build about $10k of equity ($1k loan paydown + $9k appreciation (5.7% local appreciation)).
- Cattaraugus County population projected at -28% by 2050 — secular population decline; favor cash flow + early exit over multi-decade hold.
- At projected returns (5.7% appreciation + 3.0% rent growth), your $43k cash investment doubles in ~4 years — after that, you're playing with house money.
- By year 4, paydown + projected appreciation supports a ~$33k cash-out refi (75% LTV) — recoverable capital for the next deal without selling this one.
Negotiation context
- Only 6 days on market — expect competitive offers; lowballing is unlikely to land.
- 2 sale attempts with the ask held roughly flat each time — persistent listings suggest the price (not the market) is what's stuck; bring a comps-based counter.
- Current owner paid $66k; list at $155k implies a 135% gain — meaningful room to come down on a strong offer.
Questions for the listing agent
- Is there a deadline driving the sale (1031 exchange, divorce, estate, relocation)? That informs how much negotiation room exists.
- Schools are F-rated, which usually means shorter tenancies and higher turnover. Who's the typical renter profile here, and what's been the actual vacancy rate?
- Crime grade is F in this area — have there been break-ins, vandalism, or insurance claims at this property in the last 3 years? What carrier currently insures it and at what premium?
- What's the average days-on-market for RENTAL listings here right now (not sales)? A rising rental-DOM trend means longer vacancies and softer asking-rent achievability than the comps imply.
- What's the recent tenant-quality profile in this submarket — average credit score on applications, eviction rate, late-payment / NSF rate, and stable-employment percentage? A property-management company in the area should have these aggregated.
- How much new for-sale + rental construction is in the pipeline within 1–3 miles? Heavy new supply typically softens prices + rents 12–24 months out; constrained supply supports both.
Investment metrics
- 1% rule
- 0.91% ✗
- Cap rate
- 7.18%
- Cash-on-cash
- 3.17%
- DSCR
- 1.14
- GRM
- 9.1
CMA / ARV
No comps found within radius.
Projected returns pro-forma
5.65% appreciation · 3.0% rent growth · sell at horizon
- IRR
- 17.1%
- Equity multiple
- 2.12×
- Total profit
- $48,810
- Equity at exit
- $94,016
- IRR
- 17.0%
- Equity multiple
- 4.20×
- Total profit
- $138,734
- Equity at exit
- $167,614
Cash invested: $43,400 (down + closing). Projections, not guarantees.
Landlord ↔ Tenant lean methodology
- Overall (STATE)
- 15 Strongly Tenant-Friendly
- State New York
- 15 Strongly Tenant-Friendly · D+10
- County
- — inherits STATE
- City
- — inherits STATE
ZIP-level market 14009
- Home prices YoY
- 2.0%
- Active inventory
- 41
- Price-to-rent
- 9.1×
Monthly cashflow live
- Estimated rent
- $1,413 medium interval (Pro) →
- Mortgage (P&I)
- −$813
- Tax from tax record
- −$124 /mo · $1,489/yr
- Insurance
- −$65
- HOA
- −$0
- Vacancy / Maint / Mgmt
- −$297
- Net cashflow
- $115
Break-even live
Sensitivity live
| Price | -10% $202 | -5% $158 | +0% $115 | +5% $71 | +10% $27 |
|---|---|---|---|---|---|
| Rent | -10% $3 | -5% $59 | +0% $115 | +5% $170 | +10% $226 |
| Rate | -1.0pp $193 | -0.5pp $154 | base $115 | +0.5pp $74 | +1.0pp $34 |
UW: 25.0% down · 7.5% · 30yr · 1.5% tax · 5.0% vac · 8.0% maint · 8.0% mgmt
Financing live
Cash to close
- Down payment
- $38,750
- Closing costs
- $4,650
- Reserves months
- —
- Total cash needed
- —
Loan-product check · same deal, 3 products live
Conventional
25% down · 7.5% · 30yr
- Down + closing
- —
- Monthly P&I
- —
- Monthly cashflow
- —
- DSCR
- —
- Eligible?
- —
Personal DTI + credit; lowest rate.
DSCR
20% down · 8.5% · 30yr
- Down + closing
- —
- Monthly P&I
- —
- Monthly cashflow
- —
- DSCR
- —
- Eligible?
- —
No personal income docs; deal must DSCR.
Hard money
10% down · 12.0% · 12mo
- Down + closing
- —
- Monthly P&I
- —
- Monthly cashflow
- —
- DSCR
- —
- Eligible?
- —
Short-term bridge; refi at stabilization.
Listing history 8 events
-
2026-05-12status Pending 637-char remark
-
2026-05-06$155,000 Active 637-char remark
-
2025-11-19status Pending
-
2025-11-18historical
-
2025-11-01price $155,000
-
2025-10-13$165,000 Active
-
2007-09-07soldstatus $66,000
-
2001-08-24soldstatus $6,500
ⓘ Source: listings_history table (triggers on properties + properties_extension) + one-shot
backfill from property_details.listing_events for pre-trigger history.
Tax reassessment forecast NY · Partial reset (capped growth)
- Current annual tax
- $1,489 · $124/mo
- Projected year-2 tax
- $2,054 · $171/mo
- Expected delta
- +$565/yr (+$47/mo · 38.0%)
ⓘ Screening estimate from a state-policy table — verify with the county assessor before closing.
Climate risk First Street
- Flood 1/10 Low FEMA zone X · 0% chance over 30 yrs
- Wildfire 2/10 Low
- Heat 1/10 Low 7 d/yr ≥88°F today · 16 d/yr by 30 yrs out
- Wind 1/10 Low
- Air quality 1/10 Low 0 unhealthy d/yr today · 0 by 30 yrs out
Nearby sold comps map
Loading sold comps map…
Walkable amenities ~0.75 mi
Loading nearby amenities…
Taxation est. · year 1
- Rental income
- $16,953
- − Mortgage interest
- −$8,682
- − Property taxes
- −$1,489
- − Insurance
- −$775
- − Repairs & maintenance
- −$1,356
- − Management
- −$1,356
- − Depreciation
- −$4,509
- Taxable loss
- −$1,215
- Est. tax savings @ 24.0%
- +$292
- After-tax cash flow
- $1,667/yr
For passive investors: Depreciation is non-cash, so a rental often shows a tax loss while cash-flowing — sheltering income. Rental losses are passive: they offset passive income freely, and up to $25,000/yr can offset ordinary (W-2) income if you actively participate and your MAGI is under $100k (phasing out to $0 by $150k); unused losses carry forward. On sale, claimed depreciation is recaptured at up to 25%, and gains may owe capital-gains tax (a 1031 exchange can defer both). Figures are a year-1 estimate at your 24.0% rate — not tax advice; consult a CPA.
Schools (NCES district)
- District
- Yorkshire-Pioneer Central School District
- NCES district ID
- 3608970
- Math proficiency
- 50% ▼ -17.00%
- Reading proficiency
- 54% ▼ -1.00%
- Median HH income
- $45,735
- Composite
- 44.02/100
- National rank
- #2885
- State rank
- #358 of 590 in NY
Livability — Bliss
- Score
- 58/100
- State rank
- #1065
- US rank
- #21289
Category grades
Schools grade is shown separately in the Schools card above.
Census & demographics
- City population
- 1,606
- Population (ZIP)
- 5,787
Population outlook (Cattaraugus County) Hauer SSP2
- Today (2025)
- 71,623 people
- By 2030
- 67,751 · -5.4%
- By 2040
- 59,488 · -16.9%
- By 2050
- 51,601 · -28.0%
- By 2075
- 35,025 · -51.1%
- By 2100
- 21,243 · -70.3%
Race, ethnicity, and origin ACS 2023
- Neighborhood character
- Predominantly White (94%)
- Race & ethnicity
- White 94% Two or more races 3% Asian 2%
- Common ancestry
- Romanian 9% Iranian 2% Subsaharan African 1%
- Foreign-born
- 2% · Canada
- Languages at home
- 96% English-only · Tagalog/Filipino 2% Other Asian/Pacific 1%
Political lean MEDSL · Cattaraugus
- 2024 margin
- Solid R (+32.8) · D 33.6% · R 66.4%
- 2008→2024 swing
- -22.2pp toward R · 2008: -10.6pp · 2024: -32.8pp
- All cycles
- 2024: R+32.8 2020: R+29.5 2016: R+34.4 2012: R+13.4 2008: R+10.6
Not yet ingested
- Civics
- —
Market trends
- HPI YoY
- ▲ 5.65%
- Current HPI
- 281.8451
- Rent YoY
- —
- Metro
- —
- State GDP YoY
- ▲ 2.60%
- F500 in state
- 92
Industry mix (Fortune 500 HQ in NY)
| Industry | F500 HQs | Revenue |
|---|---|---|
| Financial Services | 10 | $950B |
|
||
| Consumer Goods | 9 | $162B |
|
||
| Insurance | 4 | $225B |
|
||
| Telecommunications | 2 | $144B |
|
||
| Pharmaceuticals | 2 | $112B |
|
||
| Media / Entertainment | 2 | $69B |
|
||
Price history
+2284.6% since first listed8 events — show timeline
- 2026-05-12 Pending — UNYREIS
- 2026-05-06 Listed $155,000 UNYREIS
- 2025-11-19 Pending — UNYREIS
- 2025-11-18 Listing Removed — UNYREIS
- 2025-11-01 Price Changed $155,000 UNYREIS
- 2025-10-13 Listed $165,000 UNYREIS
- 2007-09-07 Sold (Public Records) $66,000 Public Records
- 2001-08-24 Sold (Public Records) $6,500 Public Records
Property tax history
+7.6%/yrLatest (2025): $1,489 · +0.8% YoY. Source: county tax records.
Cash-flow waterfall
monthlySold comps — $/sqft
last 12 mo · ≤1 miLoading sold comps…