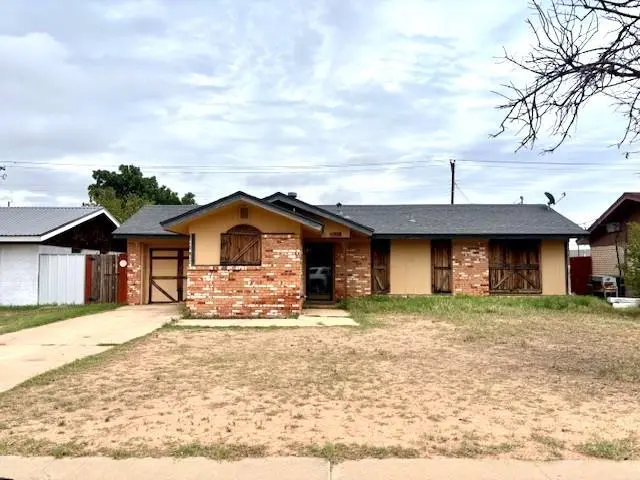
3705 La Junta · Big Spring, TX
Flood risk 1/10 · Minimal
- FEMA flood zone
- X (unshaded)
- Chance of flooding over 30 yrs
- 0.0%
- Est. flood insurance / yr
- $507 – $1,088
Fire risk 10/10 · Severe
- Est. fire insurance / yr
- $1,222 – $2,270
Heat risk 6/10 · Moderate
- Hot days now (above 102°F)
- 7 days/yr
- Hot days in 30 yrs
- 22 days/yr
Wind risk 2/10 · Minimal
- Chance of severe wind over 30 yrs
- 4.0%
Air-quality risk 1/10 · Minimal
- Unhealthy air days now
- 0 days/yr
- Unhealthy air days in 30 yrs
- 0 days/yr
Risk factors via First Street. Map © Google.
Why this score? — see what drove the D- grade
The composite is a weighted blend of 9 inputs, each scored 0–100. Each bar is that input's sub-score; the figure is the points it added to the 100-point composite (weight × sub-score).
- ARV discount +15.0/15.0
- Cash flow +7.1/30.0
- Livability +3.1/5.0
- 1% rule +2.5/10.0
- Rent growth +2.5/5.0
- Schools +2.5/10.0
- Condition / age +2.5/5.0
- DSCR +1.3/10.0
- Appreciation +0.0/10.0
$185,000
🖨 Deal sheet (PDF) 📄 Offer letter ✓ Due diligence
Listing remarks
This 3 bedroom, 2 bath is the perfect starter home. Relax in the cozy oversized living room with a fireplace and enjoy the open floorplan. A fully fenced, low maintenance backyard. This home is full of possibilities and ready to make your own!
Key facts
- 6,882 sq ft lot
- Garage
- Built 1963
Property features AI
Exterior
- Parking: Detached or attached garage with 1 car space
- Utilities: Public water; Public sewer
- Home design: Single-family residence; One story
- Construction: Brick veneer exterior; Composition roof; Slab foundation
- Exterior features: Wood fence; Lot in Wasson Place subdivision
Interior
- Flooring: Carpet; Tile
- Bathrooms: Two full bathrooms
- Heating & cooling: Central air; Ceiling fans
- Interior features: Gas water heater; Fireplace in the living room
Neighborhood map
What this means for you Summary
Snapshot
- This is a 3-bed/2.0-bath single-family listed at $185k.
Deal economics
- At list price, monthly cash flow is $-265 ($-3k/yr) — negative.
- To cash-flow at today's rent, offer at most $138k (25.3% below list).
- To meet the 1% rule (rent ≥ 1% of price), the offer needs to be $140k (24.6% below list).
- Recommended offer: $138k (25.3% below list) — sets the bar for cash-flow.
Location & tenants
- Location reads 62/100 on livability (#948 in TX) — a middle-class / working-renter tenant base. Strengths: cost of living A+, housing A+, health & safety A+; Watch: employment C-, crime F, amenities F.
- Big Spring ISD (town): math 29% / reading 30% proficiency, ranked #641 of 826 in TX (top 78%) — low school quality limits family demand, transient renter base, plan for 1-2y turnover; 63% free/reduced lunch — lower-income household profile, screen leases tightly.
- Zoned schools: Marcy El (360 students, 76% FRL); Big Spring J H (math 25% / reading 34%, grade F, #1,077 of 1,662 statewide, top 66%, 516 students, 70% FRL); Big Spring H S (math 23% / reading 30%, grade F, #1,228 of 1,632 statewide, top 76%, 1,084 students, 67% FRL).
- Market conditions: 270 active listings in the ZIP; 2 comparable units currently listed for rent nearby; 69 units permitted in Howard County in 2024 (5 in 5+ unit buildings).
Forward outlook
- Local home prices are declining (-3.0%/yr); year-one equity from $1k of loan paydown is wiped out by about $6k of value loss. Plan a longer hold.
- Howard County population projected at +42% by 2050 — long-run rental-demand tailwind backs the buy-and-hold thesis.
Negotiation context
- It's been on market 53 days — a 3% lower offer ($179k) is reasonable based on typical stale-listing flexibility.
Risks & watch-outs
- Climate carrying-cost: severe wildfire risk; extreme-heat days projected 7→22/yr by 2055 (HVAC capex compounding) — expect insurance premiums to compound above CPI over the hold.
Questions for the listing agent
- What do current leases actually rent for vs. the listed asking? Can we see a recent rent roll and the last 12 months of T-12 income?
- It's been on market 53 days. Have you received any prior offers? Is the seller open to a 25% concession, seller financing, or rate buy-down credit?
- Built in 1963 — when were the roof, HVAC, electrical panel, plumbing, and water heater last replaced?
- Is there a deadline driving the sale (1031 exchange, divorce, estate, relocation)? That informs how much negotiation room exists.
- Schools are F-rated, which usually means shorter tenancies and higher turnover. Who's the typical renter profile here, and what's been the actual vacancy rate?
- Crime grade is F in this area — have there been break-ins, vandalism, or insurance claims at this property in the last 3 years? What carrier currently insures it and at what premium?
- The area grade is low — what's the realistic commute time and amenity access for the typical tenant pool here? Any planned neighborhood developments (good or bad) we should know about?
- What's the average days-on-market for RENTAL listings here right now (not sales)? A rising rental-DOM trend means longer vacancies and softer asking-rent achievability than the comps imply.
- What's the recent tenant-quality profile in this submarket — average credit score on applications, eviction rate, late-payment / NSF rate, and stable-employment percentage? A property-management company in the area should have these aggregated.
- How much new for-sale + rental construction is in the pipeline within 1–3 miles? Heavy new supply typically softens prices + rents 12–24 months out; constrained supply supports both.
Investment metrics
- 1% rule
- 0.75% ✗
- Cap rate
- 4.58%
- Cash-on-cash
- -6.13%
- DSCR
- 0.73
- GRM
- 11.0
CMA / ARV
- ARV (median comp)
- $259,826
- List price
- $185,000
- Delta
- -28.80%
- Verdict
- UNDERPRICED
- Comps
- 2 within 2.0 mi
Projected returns pro-forma
-3.0% appreciation · 3.0% rent growth · sell at horizon
- IRR
- -26.8%
- Equity multiple
- 0.10×
- Total profit
- $-46,753
- Equity at exit
- $27,584
- IRR
- -24.1%
- Equity multiple
- -0.20×
- Total profit
- $-62,103
- Equity at exit
- $15,995
Cash invested: $51,800 (down + closing). Projections, not guarantees.
Landlord ↔ Tenant lean methodology
- Overall (STATE)
- 87 Strongly Landlord-Friendly
- State Texas
- 87 Strongly Landlord-Friendly · R+5
- County
- — inherits STATE
- City
- — inherits STATE
ZIP-level market 79720
- Active inventory
- 270
- Price-to-rent
- 11.0×
Monthly cashflow live
- Estimated rent
- $1,396 medium interval (Pro) →
- Mortgage (P&I)
- −$970
- Tax from tax record
- −$320 /mo · $3,838/yr
- Insurance
- −$77
- HOA
- −$0
- Vacancy / Maint / Mgmt
- −$293
- Net cashflow
- $-265
Break-even live
Sensitivity live
| Price | -10% $-160 | -5% $-212 | +0% $-265 | +5% $-317 | +10% $-369 |
|---|---|---|---|---|---|
| Rent | -10% $-375 | -5% $-320 | +0% $-265 | +5% $-209 | +10% $-154 |
| Rate | -1.0pp $-171 | -0.5pp $-218 | base $-265 | +0.5pp $-313 | +1.0pp $-361 |
UW: 25.0% down · 7.5% · 30yr · 1.5% tax · 5.0% vac · 8.0% maint · 8.0% mgmt
Financing live
Cash to close
- Down payment
- $46,250
- Closing costs
- $5,550
- Reserves months
- —
- Total cash needed
- —
Loan-product check · same deal, 3 products live
Conventional
25% down · 7.5% · 30yr
- Down + closing
- —
- Monthly P&I
- —
- Monthly cashflow
- —
- DSCR
- —
- Eligible?
- —
Personal DTI + credit; lowest rate.
DSCR
20% down · 8.5% · 30yr
- Down + closing
- —
- Monthly P&I
- —
- Monthly cashflow
- —
- DSCR
- —
- Eligible?
- —
No personal income docs; deal must DSCR.
Hard money
10% down · 12.0% · 12mo
- Down + closing
- —
- Monthly P&I
- —
- Monthly cashflow
- —
- DSCR
- —
- Eligible?
- —
Short-term bridge; refi at stabilization.
Rent comps 2 comps
| Address | Beds | Baths | Sqft | Rent | $/sqft | DOM | Units | Dist |
|---|---|---|---|---|---|---|---|---|
| 3304 West St Big Spring, TX | 3.0 | 1.0 | 1520 | $1,119 | $0.74 | 4d | 1 | 0.55mi |
| 801 W Marcy Dr Big Spring, TX | 2.0 | 2.0 | 1276 | $1,166 | $0.91 | 14d | 1 | 1.43mi |
Listing history 25 events
-
2026-06-22days on market $185,000 Active 53 DOM
-
2026-06-21days on market $185,000 Active 52 DOM
-
2026-06-19days on market $185,000 Active 50 DOM
-
2026-06-18days on market $185,000 Active 49 DOM
-
2026-06-17days on market $185,000 Active 48 DOM
-
2026-06-16days on market $185,000 Active 47 DOM
-
2026-06-15days on market $185,000 Active 46 DOM
-
2026-06-14days on market $185,000 Active 44 DOM
-
2026-06-12days on market $185,000 Active 43 DOM
-
2026-06-09days on market $185,000 Active 40 DOM
-
2026-06-08days on market $185,000 Active 39 DOM
-
2026-06-07days on market $185,000 Active 38 DOM
-
2026-06-05days on market $185,000 Active 35 DOM
-
2026-06-02days on market $185,000 Active 33 DOM
-
2026-06-01days on market $185,000 Active 32 DOM
-
2026-05-31days on market $185,000 Active 31 DOM
-
2026-05-30days on market $185,000 Active 30 DOM
-
2026-04-30$185,000 Active 243-char remark
-
2022-10-10price $199,000
-
2022-08-29price $210,000
-
2019-04-23soldstatus
-
2018-05-18soldstatus
-
2017-11-30soldstatus
-
2001-06-21soldstatus
-
2000-02-17soldstatus
ⓘ Source: listings_history table (triggers on properties + properties_extension) + one-shot
backfill from property_details.listing_events for pre-trigger history.
Tax reassessment forecast TX · Resets to sale price
- Current annual tax
- $3,838 · $320/mo
- Projected year-2 tax
- $3,838 · $320/mo
- Expected delta
- $0/yr ($0/mo · -0.0%)
ⓘ Screening estimate from a state-policy table — verify with the county assessor before closing.
Climate risk First Street
- Flood 1/10 Low FEMA zone X (unshaded) · 0% chance over 30 yrs
- Wildfire 10/10 Extreme
- Heat 6/10 Major 7 d/yr ≥102°F today · 22 d/yr by 30 yrs out
- Wind 2/10 Low 4% chance of damaging wind over 30 yrs
- Air quality 1/10 Low 0 unhealthy d/yr today · 0 by 30 yrs out
Nearby sold comps map
Loading sold comps map…
Walkable amenities ~0.75 mi
Loading nearby amenities…
Taxation est. · year 1
- Rental income
- $16,747
- − Mortgage interest
- −$10,363
- − Property taxes
- −$3,838
- − Insurance
- −$925
- − Repairs & maintenance
- −$1,340
- − Management
- −$1,340
- − Depreciation
- −$5,382
- Taxable loss
- −$6,440
- Est. tax savings @ 24.0%
- +$1,546
- After-tax cash flow
- $-1,629/yr
For passive investors: Depreciation is non-cash, so a rental often shows a tax loss while cash-flowing — sheltering income. Rental losses are passive: they offset passive income freely, and up to $25,000/yr can offset ordinary (W-2) income if you actively participate and your MAGI is under $100k (phasing out to $0 by $150k); unused losses carry forward. On sale, claimed depreciation is recaptured at up to 25%, and gains may owe capital-gains tax (a 1031 exchange can defer both). Figures are a year-1 estimate at your 24.0% rate — not tax advice; consult a CPA.
Schools (NCES district)
- District
- Big Spring ISD
- NCES district ID
- 4810200
- Math proficiency
- 29% ▼ -1.00%
- Reading proficiency
- 30% ▲ 4.00%
- Median HH income
- $42,916
- Composite
- 25.11/100
- National rank
- #7529
- State rank
- #641 of 826 in TX
Livability — Big Spring
- Score
- 62/100
- State rank
- #948
- US rank
- #16886
Category grades
Schools grade is shown separately in the Schools card above.
Census & demographics
- Census place
- Big Spring, TX
- County
- Howard County · 29,936 people
- City population
- 29,936
- Metro
- Big Spring, TX
- Population (ZIP)
- 29,936
- Household income
- $68,785
- Rent vs Own
- Severe rent burden
- 638.0
Population outlook (Howard County) Hauer SSP2
- Today (2025)
- 43,396 people
- By 2030
- 46,792 · +7.8%
- By 2040
- 54,096 · +24.7%
- By 2050
- 61,707 · +42.2%
- By 2075
- 79,809 · +83.9%
- By 2100
- 87,385 · +101.4%
Race, ethnicity, and origin ACS 2023
- Neighborhood character
- Diverse neighborhood (Simpson 0.59)
- Race & ethnicity
- Hispanic / Latino 45% White 45% Two or more races 17% Black 5% Asian 1%
- Hispanic origin (detail)
- Mexican 37%
- Common ancestry
- Slovak 1% Italian 1% Lithuanian 1%
- Foreign-born
- 10% · Canada
- Languages at home
- 71% English-only · Spanish 28%
Political lean MEDSL · Howard
- 2024 margin
- Solid R (+62.8) · D 18.2% · R 81.1%
- 2008→2024 swing
- -16.6pp toward R · 2008: -46.3pp · 2024: -62.8pp
- All cycles
- 2024: R+62.8 2020: R+58.4 2016: R+56.0 2012: R+58.2 2008: R+46.3
Not yet ingested
- Civics
- —
Market trends
- HPI YoY
- ▼ -207.13%
- Current HPI
- 140.8159
- Rent YoY
- —
- Metro
- Big Spring, TX
- State GDP YoY
- ▲ 3.95%
- F500 in state
- 110
Industry mix (Fortune 500 HQ in TX)
| Industry | F500 HQs | Revenue |
|---|---|---|
| Energy | 16 | $1,198B |
|
||
| Technology | 5 | $198B |
|
||
| Engineering / Construction | 4 | $72B |
|
||
| Energy Services | 3 | $60B |
|
||
| Utilities | 3 | $41B |
|
||
| Healthcare | 2 | $330B |
|
||
Price history
-11.9% since first listed8 events — show timeline
- 2026-04-30 Listed $185,000 PBBOR
- 2022-10-10 Price Changed $199,000 PBBOR
- 2022-08-29 Price Changed $210,000 PBBOR
- 2019-04-23 Sold (Public Records) — Public Records
- 2018-05-18 Sold (Public Records) — Public Records
- 2017-11-30 Sold (Public Records) — Public Records
- 2001-06-21 Sold (Public Records) — Public Records
- 2000-02-17 Sold (Public Records) — Public Records
Property tax history
+4.9%/yrLatest (2025): $3,838 · +20.5% YoY. Source: county tax records.
Cash-flow waterfall
monthlySold comps — $/sqft
last 12 mo · ≤1 miLoading sold comps…