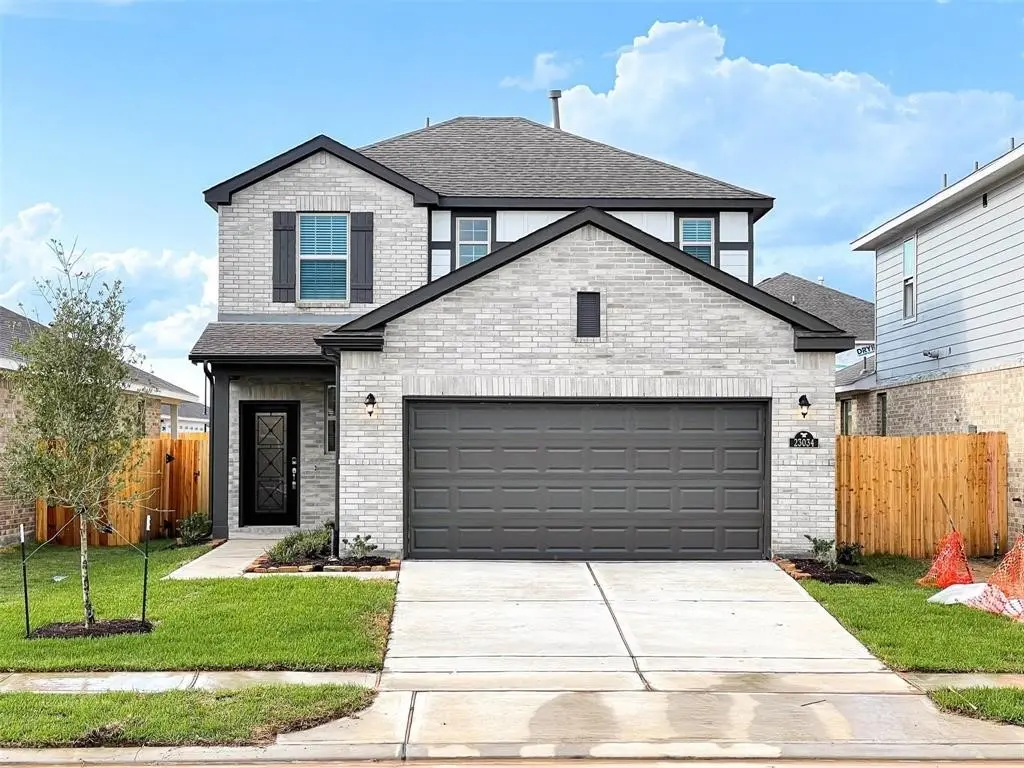
23034 True Fortune Dr · Houston, TX
Flood risk 4/10 · Minor
- FEMA flood zone
- X (unshaded)
- Chance of flooding over 30 yrs
- 0.22%
- Est. flood insurance / yr
- $507 – $1,088
Fire risk 4/10 · Minor
- Est. fire insurance / yr
- $1,222 – $2,270
Heat risk 8/10 · Major
- Hot days now (above 111°F)
- 7 days/yr
- Hot days in 30 yrs
- 22 days/yr
Wind risk 9/10 · Severe
- Chance of severe wind over 30 yrs
- 99.0%
Air-quality risk 2/10 · Minimal
- Unhealthy air days now
- 1 days/yr
- Unhealthy air days in 30 yrs
- 1 days/yr
Risk factors via First Street. Map © Google.
Why this score? — see what drove the D grade
The composite is a weighted blend of 9 inputs, each scored 0–100. Each bar is that input's sub-score; the figure is the points it added to the 100-point composite (weight × sub-score).
- ARV discount +15.0/15.0
- Cash flow +6.0/30.0
- Schools +5.7/10.0
- 1% rule +4.1/10.0
- Condition / age +4.0/5.0
- Livability +3.7/5.0
- Rent growth +2.3/5.0
- DSCR +0.4/10.0
- Appreciation +0.0/10.0
$300,000
🖨 Deal sheet (PDF) 📄 Offer letter ✓ Due diligence
Listing remarks MLS
Great standard features, including granite countertops in kitchen and all baths, 42 inch cabinets, whirlpool brand appliances, tankless water heater, full sod front and back with irrigation, home automation powered by Google, large walk-in showers, coach lights and more!
Key facts
- 4,800 sq ft lot
- 2 garage spots
- Built 2022
Property features AI
Finance
- Other: Lease not considered
- HOA & community: Community Solutions association; Annual association fee of $750
Exterior
- Parking: Attached 2-car garage
- Utilities: Public sewer
- Home design: Residential property; Built in 2022; Slab foundation
- Construction: Brick and wood siding construction; Composition roof
- Exterior features: Located in a subdivision
Interior
- Bedrooms: Primary bedroom on the first floor (approx. 13 x 16); Bedroom on second floor (approx. 11 x 15); Bedroom on second floor (approx. 12 x 10); Bedroom on second floor (approx. 11 x 11)
- Bathrooms: 2 full bathrooms; 1 half bathroom
- Heating & cooling: Central gas heating; Central electric air conditioning
- Interior features: 4 total rooms
Neighborhood map
What this means for you Summary
Snapshot
- This is a 4-bed/2.5-bath single-family listed at $300k. Condition is rated good.
Deal economics
- At list price, monthly cash flow is $-574 ($-7k/yr) — negative.
- To cash-flow at today's rent, offer at most $231k (22.9% below list).
- To meet the 1% rule (rent ≥ 1% of price), the offer needs to be $272k (9.3% below list).
- Recommended offer: $231k (22.9% below list) — sets the bar for cash-flow.
- Cap rate 4.0% vs local median 3.1% in Houston — meaningfully above typical; check what's discounted (condition, days-on-market, listing class) to confirm the premium yield is real.
Location & tenants
- Location reads 74/100 on livability (#184 in TX, #4,771 nationally) — a middle-class / working-renter tenant base. Strengths: amenities A+, cost of living A+, housing A+; Watch: crime F.
- Katy ISD (suburban): math 61% / reading 63% proficiency, ranked #29 of 826 in TX (top 4%) — acceptable for families but not a draw, mixed tenant base, ~2y average lease.
- Zoned schools: Robert King El (math 41% / reading 44%, grade F, #1,313 of 4,322 statewide, top 31%, 981 students, 68% FRL); Stockdick J H (math 41% / reading 51%, grade D+, #462 of 1,662 statewide, top 28%, 1,313 students, 55% FRL); Katy H S (math 62% / reading 74%, grade B, #150 of 1,632 statewide, top 10%, 3,330 students, 38% FRL) — zoned schools average 54% FRL vs 27% district-wide (26 pts higher); higher-poverty schools than district average — tighter screening recommended.
- Market conditions: Rents soft (-0.8%/yr); 2729 active listings in the ZIP; 33 comparable units currently listed for rent nearby; rentals at typical pace (median 18d on market — plan ~3-4 weeks tenant-placement turnaround); high-income renter base; 29,883 units permitted in Harris County in 2024 (8,621 in 5+ unit buildings).
Forward outlook
- Local home prices are declining (-3.0%/yr); year-one equity from $2k of loan paydown is wiped out by about $9k of value loss. Plan a longer hold.
- Harris County population projected at +47% by 2050 — long-run rental-demand tailwind backs the buy-and-hold thesis.
Negotiation context
- It's been on market 54 days — a 3% lower offer ($291k) is reasonable based on typical stale-listing flexibility.
- 7 sale attempts since 4y ago; this cycle's ask has dropped $35k (10%) from the opening price — seller is motivated, your offer sets the floor, not the list.
Risks & watch-outs
- Watch-outs: property tax is 3.9% of price.
- Climate carrying-cost: severe wind risk, 99% chance of damaging wind over 30y; extreme-heat days projected 7→22/yr by 2055 (HVAC capex compounding) — expect insurance premiums to compound above CPI over the hold.
Questions for the listing agent
- What do current leases actually rent for vs. the listed asking? Can we see a recent rent roll and the last 12 months of T-12 income?
- It's been on market 54 days. Have you received any prior offers? Is the seller open to a 23% concession, seller financing, or rate buy-down credit?
- Property tax is high relative to price — has the assessment been appealed recently, and will the sale trigger a re-assessment?
- What does the HOA fee cover, when was the last increase, and are there any pending special assessments or reserve-fund shortfalls?
- Is there a deadline driving the sale (1031 exchange, divorce, estate, relocation)? That informs how much negotiation room exists.
- Schools are D-rated, which usually means shorter tenancies and higher turnover. Who's the typical renter profile here, and what's been the actual vacancy rate?
- Crime grade is F in this area — have there been break-ins, vandalism, or insurance claims at this property in the last 3 years? What carrier currently insures it and at what premium?
- The area grade is low — what's the realistic commute time and amenity access for the typical tenant pool here? Any planned neighborhood developments (good or bad) we should know about?
- What's the average days-on-market for RENTAL listings here right now (not sales)? A rising rental-DOM trend means longer vacancies and softer asking-rent achievability than the comps imply.
- What's the recent tenant-quality profile in this submarket — average credit score on applications, eviction rate, late-payment / NSF rate, and stable-employment percentage? A property-management company in the area should have these aggregated.
- How much new for-sale + rental construction is in the pipeline within 1–3 miles? Heavy new supply typically softens prices + rents 12–24 months out; constrained supply supports both.
Investment metrics
- 1% rule
- 0.91% ✗
- Cap rate
- 4.00%
- Cash-on-cash
- -8.20%
- DSCR
- 0.64
- GRM
- 9.2
CMA / ARV
- ARV (median comp)
- $374,884
- List price
- $300,000
- Delta
- -19.98%
- Verdict
- UNDERPRICED
- Comps
- 20 within 1.0 mi
Show comp detail 12 sales within ~0.75 mi
| Address | Dist | Beds/Ba | Sqft | Sold | Price | $/sf | Match |
|---|---|---|---|---|---|---|---|
| 23110 True Fortune Dr | 0.06mi | 4/2.5 | 2,275 (-7%) | 5mo | $299,000 | $131 | 81 |
| 23214 Penstemon Trl | 0.47mi | 4/2.5 | 2,498 (+2%) | 7mo | $375,000 | $150 | 69 |
| 23231 Wise Walk Dr | 0.38mi | 4/2.5 | 2,166 (-12%) | 2mo | $320,000 | $148 | 61 |
| 23010 Needlegrass Rd | 0.67mi | 4/3.5 | 2,493 (+2%) | 4mo | $365,000 | $146 | 58 |
| 23611 Cinnamon Tree Ln | 0.72mi | 4/3.0 | 2,337 (-5%) | 2mo | $427,110 | $183 | 55 |
| 23538 Cinnamon Tree Ln | 0.75mi | 4/3.0 | 2,336 (-5%) | 1mo | $404,003 | $173 | 55 |
| 23511 Cinnamon Tree Ln | 0.75mi | 4/3.0 | 2,336 (-5%) | 1mo | $427,192 | $183 | 54 |
| 23606 Cinnamon Tree Ln | 0.70mi | 4/3.5 | 2,579 (+5%) | 1mo | $452,508 | $175 | 54 |
| 23623 Cinnamon Tree Ln | 0.75mi | 4/3.0 | 2,336 (-5%) | 2mo | $379,990 | $163 | 54 |
| 6010 Birchwood Cliff Trl | 0.57mi | 4/3.5 | 2,702 (+10%) | 0mo | $399,000 | $148 | 52 |
| 23619 Cinnamon Tree Ln | 0.75mi | 4/3.0 | 2,241 (-9%) | 1mo | $319,990 | $143 | 48 |
| 23610 Cinnamon Tree Ln | 0.71mi | 4/3.0 | 2,168 (-12%) | 2mo | $435,994 | $201 | 44 |
Match score weights: distance 35% · size 25% · config 20% · recency 20%. Top-matched comps best support the ARV.
Projected returns pro-forma
-3.0% appreciation · 0.0% rent growth · sell at horizon
- IRR
- -35.4%
- Equity multiple
- -0.10×
- Total profit
- $-92,702
- Equity at exit
- $44,731
- IRR
- -80.7%
- Equity multiple
- -0.87×
- Total profit
- $-156,831
- Equity at exit
- $25,939
Cash invested: $84,000 (down + closing). Projections, not guarantees.
Landlord ↔ Tenant lean methodology
- Overall (STATE)
- 87 Strongly Landlord-Friendly
- State Texas
- 87 Strongly Landlord-Friendly · R+5
- County
- — inherits STATE
- City
- — inherits STATE
ZIP-level market 77493
- Rents YoY
- -0.8%
- Active inventory
- 2729
- Price-to-rent
- 9.2×
Monthly cashflow live
- Estimated rent
- $2,722 high interval (Pro) →
- Mortgage (P&I)
- −$1,573
- Tax from tax record
- −$963 /mo · $11,561/yr
- Insurance
- −$125
- HOA
- −$63
- Vacancy / Maint / Mgmt
- −$572
- Net cashflow
- $-574
Break-even live
Sensitivity live
| Price | -10% $-404 | -5% $-489 | +0% $-574 | +5% $-659 | +10% $-744 |
|---|---|---|---|---|---|
| Rent | -10% $-789 | -5% $-681 | +0% $-574 | +5% $-466 | +10% $-359 |
| Rate | -1.0pp $-423 | -0.5pp $-498 | base $-574 | +0.5pp $-652 | +1.0pp $-731 |
UW: 25.0% down · 7.5% · 30yr · 1.5% tax · 5.0% vac · 8.0% maint · 8.0% mgmt
Financing live
Cash to close
- Down payment
- $75,000
- Closing costs
- $9,000
- Reserves months
- —
- Total cash needed
- —
Loan-product check · same deal, 3 products live
Conventional
25% down · 7.5% · 30yr
- Down + closing
- —
- Monthly P&I
- —
- Monthly cashflow
- —
- DSCR
- —
- Eligible?
- —
Personal DTI + credit; lowest rate.
DSCR
20% down · 8.5% · 30yr
- Down + closing
- —
- Monthly P&I
- —
- Monthly cashflow
- —
- DSCR
- —
- Eligible?
- —
No personal income docs; deal must DSCR.
Hard money
10% down · 12.0% · 12mo
- Down + closing
- —
- Monthly P&I
- —
- Monthly cashflow
- —
- DSCR
- —
- Eligible?
- —
Short-term bridge; refi at stabilization.
Rent comps 33 comps
| Address | Beds | Baths | Sqft | Rent | $/sqft | DOM | Units | Dist |
|---|---|---|---|---|---|---|---|---|
| 5710 Fresh View Ct Katy, TX | 4.0 | 2.5 | 2313 | $2,495 | $1.08 | 4d | 1 | 0.39mi |
| 23030 Cunningham Falls Trl Katy, TX | 1.0–3.0 | 1.0–2.0 | 1213 | $2,900 | $2.39 | 0d | 242 | 0.42mi |
| 5103 Visionary Dr Katy, TX | 3.0–4.0 | 2.0–2.5 | 1692 | $3,096 | $1.83 | 4d | 9 | 0.62mi |
| 22824 Frassino Pl Katy, TX | 4.0 | 2.5 | 2017 | $2,629 | $1.30 | 4d | 1 | 0.68mi |
| 22808 Terrazzo Dr Katy, TX | 4.0 | 2.5 | 2004 | $2,499 | $1.25 | 1d | 1 | 0.73mi |
| 22865 Terrazzo Dr Katy, TX | 4.0 | 2.5 | 2017 | $2,759 | $1.37 | 17d | 1 | 0.74mi |
| 22728 Terrazzo Dr Katy, TX | 3.0 | 2.5 | 1667 | $2,369 | $1.42 | 26d | 1 | 0.74mi |
| 22738 Terrazzo Dr Katy, TX | 4.0 | 3.0 | 1873 | $2,539 | $1.36 | 21d | 1 | 0.75mi |
| 22716 Terrazzo Dr Katy, TX | 4.0 | 3.0 | 1865 | $2,439 | $1.31 | 7d | 1 | 0.75mi |
| 22616 Terrazzo Dr Katy, TX | 4.0 | 3.0 | 1865 | $2,539 | $1.36 | 17d | 1 | 0.75mi |
| 22614 Terrazzo Dr Katy, TX | 4.0 | 3.0 | 1873 | $2,539 | $1.36 | 15d | 1 | 0.75mi |
| 22622 Terrazzo Dr Katy, TX | 4.0 | 3.0 | 1873 | $2,569 | $1.37 | 45d | 1 | 0.76mi |
| 22718 Terrazzo Dr Katy, TX | 4.0 | 3.0 | 1873 | $2,439 | $1.30 | 7d | 1 | 0.76mi |
| 22855 Terrazzo Dr Katy, TX | 3.0 | 2.5 | 1667 | $2,399 | $1.44 | 15d | 1 | 0.76mi |
| 22851 Terazzo Dr Katy, TX | 3.0–4.0 | 2.5–3.0 | 1740 | $3,304 | $1.90 | 0d | 1 | 0.76mi |
| 22624 Terrazzo Dr Katy, TX | 4.0 | 3.0 | 1865 | $2,569 | $1.38 | 45d | 1 | 0.76mi |
| 22722 Terrazzo Dr Katy, TX | 4.0 | 2.5 | 2017 | $2,559 | $1.27 | 19d | 1 | 0.76mi |
| 22720 Terrazzo Dr Katy, TX | 4.0 | 2.5 | 2004 | $2,559 | $1.28 | 19d | 1 | 0.77mi |
| 22626 Terrazzo Dr Katy, TX | 4.0 | 2.5 | 2004 | $2,699 | $1.35 | 45d | 1 | 0.77mi |
| 22628 Terrazzo Dr Katy, TX | 4.0 | 2.5 | 2017 | $2,659 | $1.32 | 17d | 1 | 0.78mi |
| 22737 Terrazzo Dr Katy, TX | 4.0 | 3.0 | 1873 | $2,649 | $1.41 | 45d | 1 | 0.78mi |
| 22719 Terrazzo Dr Katy, TX | 4.0 | 2.5 | 2004 | $2,559 | $1.28 | 19d | 1 | 0.79mi |
| 22717 Terrazzo Dr Katy, TX | 4.0 | 2.5 | 2017 | $2,629 | $1.30 | 7d | 1 | 0.79mi |
| 22713 Terrazzo Dr Katy, TX | 3.0 | 2.5 | 1667 | $2,419 | $1.45 | 15d | 1 | 0.81mi |
| 22615 Terrazzo Dr Katy, TX | 4.0 | 3.0 | 1865 | $2,569 | $1.38 | 45d | 1 | 0.82mi |
| 22613 Terrazzo Dr Katy, TX | 4.0 | 3.0 | 1873 | $2,569 | $1.37 | 45d | 1 | 0.83mi |
| 22611 Terrazzo Dr Katy, TX | 4.0 | 3.0 | 1865 | $2,569 | $1.38 | 45d | 1 | 0.84mi |
| 22700 Elyson Falls Dr Katy, TX | 2.0–4.0 | 2.0–3.0 | 1658 | $2,925 | $1.76 | 1d | 1 | 1.09mi |
| 4411 Andorno Dr Katy, TX | 4.0 | 2.0 | 2094 | $2,221 | $1.06 | 26d | 1 | 1.20mi |
| 5007 Royal Amber Ln Katy, TX | 4.0 | 3.0 | 2270 | $1,975 | $0.87 | 45d | 1 | 1.28mi |
| 22843 Castello Lakes Dr Katy, TX | 4.0 | 2.0 | 2036 | $2,148 | $1.06 | 24d | 1 | 1.32mi |
| 4110 Rapallo Ct Katy, TX | 4.0 | 3.0 | 2300 | $2,600 | $1.13 | 7d | 1 | 1.44mi |
| 24246 Palomino Sage Trl Katy, TX | 3.0 | 2.0 | 1860 | $2,305 | $1.24 | 46d | 1 | 1.48mi |
HOA detail
- Monthly dues
- $63 · $756/yr
- Likely covers
- waterpool
Listing history 28 events
-
2026-06-21days on market $300,000 Active 54 DOM
-
2026-06-18days on market $300,000 Active 51 DOM
-
2026-06-17days on market $300,000 Active 50 DOM
-
2026-06-16days on market $300,000 Active 49 DOM
-
2026-06-15days on market $300,000 Active 48 DOM
-
2026-06-13days on market $300,000 Active 46 DOM
-
2026-06-09days on market $300,000 Active 42 DOM
-
2026-06-08days on market $300,000 Active 41 DOM
-
2026-06-07pricedays on market $300,000 Active 40 DOM
-
2026-06-04days on market $335,000 Active 37 DOM
-
2026-06-03days on market $335,000 Active 36 DOM
-
2026-06-02days on market $335,000 Active 35 DOM
-
2026-06-01days on market $335,000 Active 34 DOM
-
2026-05-31days on market $335,000 Active 33 DOM
-
2026-04-28$335,000 Active 447-char remark
-
2025-04-22historical $2,350
-
2025-03-08$2,350
-
2025-03-07historical $2,500
-
2025-01-24$2,500
-
2025-01-20historical $2,500
-
2025-01-07$2,500
-
2025-01-07historical $2,500
-
2024-11-19$2,500
-
2024-11-16historical $2,500
-
2024-09-28$2,500
-
2022-06-30soldstatus Sold 271-char remark
Show marketing remark (271 chars)
Great standard features, including granite countertops in kitchen and all baths, 42 inch cabinets, whirlpool brand appliances, tankless water heater, full sod front and back with irrigation, home automation powered by Google, large walk-in showers, coach lights and more!
-
2022-04-12status Pending 271-char remark
Show marketing remark (271 chars)
Great standard features, including granite countertops in kitchen and all baths, 42 inch cabinets, whirlpool brand appliances, tankless water heater, full sod front and back with irrigation, home automation powered by Google, large walk-in showers, coach lights and more!
-
2022-04-12$370,597 Active 271-char remark
Show marketing remark (271 chars)
Great standard features, including granite countertops in kitchen and all baths, 42 inch cabinets, whirlpool brand appliances, tankless water heater, full sod front and back with irrigation, home automation powered by Google, large walk-in showers, coach lights and more!
ⓘ Source: listings_history table (triggers on properties + properties_extension) + one-shot
backfill from property_details.listing_events for pre-trigger history.
Tax reassessment forecast TX · Resets to sale price
- Current annual tax
- $11,561 · $963/mo
- Projected year-2 tax
- $11,561 · $963/mo
- Expected delta
- $0/yr ($0/mo · 0.0%)
ⓘ Screening estimate from a state-policy table — verify with the county assessor before closing.
Climate risk First Street
- Flood 4/10 Moderate FEMA zone X (unshaded) · 22% chance over 30 yrs
- Wildfire 4/10 Moderate
- Heat 8/10 Severe 7 d/yr ≥111°F today · 22 d/yr by 30 yrs out
- Wind 9/10 Extreme 99% chance of damaging wind over 30 yrs
- Air quality 2/10 Low 1 unhealthy d/yr today · 1 by 30 yrs out
Nearby sold comps map
Loading sold comps map…
Walkable amenities ~0.75 mi
Loading nearby amenities…
Taxation est. · year 1
- Rental income
- $32,669
- − Mortgage interest
- −$16,805
- − Property taxes
- −$11,561
- − Insurance
- −$1,500
- − Repairs & maintenance
- −$2,614
- − Management
- −$2,614
- − HOA
- −$756
- − Depreciation
- −$8,727
- Taxable loss
- −$11,907
- Est. tax savings @ 24.0%
- +$2,858
- After-tax cash flow
- $-4,029/yr
For passive investors: Depreciation is non-cash, so a rental often shows a tax loss while cash-flowing — sheltering income. Rental losses are passive: they offset passive income freely, and up to $25,000/yr can offset ordinary (W-2) income if you actively participate and your MAGI is under $100k (phasing out to $0 by $150k); unused losses carry forward. On sale, claimed depreciation is recaptured at up to 25%, and gains may owe capital-gains tax (a 1031 exchange can defer both). Figures are a year-1 estimate at your 24.0% rate — not tax advice; consult a CPA.
Condition & rehab AI · 12 photos
This well-maintained, two-story home offers a good condition with modern features and a good curb appeal. It is ready for a new owner to move in and enjoy.
Value-add opportunities
- Both Painting exterior and interior walls — Fresh paint enhances curb appeal and interior aesthetics
- Both Landscaping improvements — Enhances curb appeal and adds value
- Both Replace carpet with hardwood or tile — Hardwood or tile flooring is more durable and adds value
- Both Install smart home automation — Modernizes home and adds value for potential buyers
Renovation cost estimate screening
Value-add ROI direction
- Both Painting exterior and interior walls — Fresh paint enhances curb appeal and interior aesthetics ↑
- Both Landscaping improvements — Enhances curb appeal and adds value ↑
- Both Replace carpet with hardwood or tile — Hardwood or tile flooring is more durable and adds value ↑
- Both Install smart home automation — Modernizes home and adds value for potential buyers ↑
ⓘ Cost ranges are severity-bucket heuristics (US national rule-of-thumb). Get contractor quotes + a written scope before underwriting a rehab budget.
Schools (NCES district)
- District
- Katy ISD
- NCES district ID
- 4825170
- Math proficiency
- 61% ▼ -7.00%
- Reading proficiency
- 63% ▼ -3.00%
- Median HH income
- $90,312
- Composite
- 56.59/100
- National rank
- #1146
- State rank
- #29 of 826 in TX
Livability — Houston
- Score
- 74/100
- State rank
- #184
- US rank
- #4771
Category grades
Schools grade is shown separately in the Schools card above.
Census & demographics
- County
- Harris County · 4,702,590 people
- City population
- 3,226,434
- Metro
- Houston-The Woodlands-Sugar Land, TX
- Population (ZIP)
- 71,484
- Household income
- $118,464
- Rent vs Own
- Severe rent burden
- 913.0
Population outlook (Harris County) Hauer SSP2
- Today (2025)
- 5,571,493 people
- By 2030
- 6,089,821 · +9.3%
- By 2040
- 7,142,806 · +28.2%
- By 2050
- 8,185,864 · +46.9%
- By 2075
- 10,574,329 · +89.8%
- By 2100
- 12,109,958 · +117.4%
Race, ethnicity, and origin ACS 2023
- Neighborhood character
- Highly diverse neighborhood (Simpson 0.73)
- Race & ethnicity
- White 36% Hispanic / Latino 33% Two or more races 16% Black 15% Asian 12%
- Hispanic origin (detail)
- Mexican 20%
- Common ancestry
- Lithuanian 2% Slovak 1% Italian 1%
- Foreign-born
- 21% · Canada, Vietnam, Jamaica
- Languages at home
- 64% English-only · Spanish 22% Vietnamese 5% French/Haitian/Cajun 4%
Political lean MEDSL · Harris
- 2024 margin
- Lean D (+5.5) · D 52.0% · R 46.4% · Other 1.6%
- 2008→2024 swing
- +3.9pp toward D · 2008: 1.6pp · 2024: 5.5pp
- All cycles
- 2024: D+5.5 2020: D+13.3 2016: D+12.4 2012: D+0.1 2008: D+1.6
Not yet ingested
- Civics
- —
Market trends
- HPI YoY
- ▼ -140.65%
- Current HPI
- 233.1683
- Rent YoY
- ▼ -0.80%
- Metro
- Houston-The Woodlands-Sugar Land, TX
- State GDP YoY
- ▲ 3.95%
- F500 in state
- 110
Industry mix (Fortune 500 HQ in TX)
| Industry | F500 HQs | Revenue |
|---|---|---|
| Energy | 16 | $1,198B |
|
||
| Technology | 5 | $198B |
|
||
| Engineering / Construction | 4 | $72B |
|
||
| Energy Services | 3 | $60B |
|
||
| Utilities | 3 | $41B |
|
||
| Healthcare | 2 | $330B |
|
||
Price history
-19.0% since first listed15 events — show timeline
- 2026-06-04 Price Changed $300,000 HARMLS
- 2026-04-28 Listed $335,000 HARMLS
- 2025-04-22 Rental Removed $2,350 HARMLS
- 2025-03-08 Listed for Rent $2,350 HARMLS
- 2025-03-07 Rental Removed $2,500 HARMLS
- 2025-01-24 Listed for Rent $2,500 HARMLS
- 2025-01-20 Rental Removed $2,500 HARMLS
- 2025-01-07 Listed for Rent $2,500 HARMLS
- 2025-01-07 Rental Removed $2,500 HARMLS
- 2024-11-19 Listed for Rent $2,500 HARMLS
- 2024-11-16 Rental Removed $2,500 HARMLS
- 2024-09-28 Listed for Rent $2,500 HARMLS
- 2022-06-30 Sold (MLS) — HARMLS
- 2022-04-12 Pending — HARMLS
- 2022-04-12 Listed $370,597 HARMLS
Property tax history
+100.4%/yrLatest (2025): $11,561 · +6.9% YoY. Source: county tax records.
Cash-flow waterfall
monthlySold comps — $/sqft
last 12 mo · ≤1 miLoading sold comps…