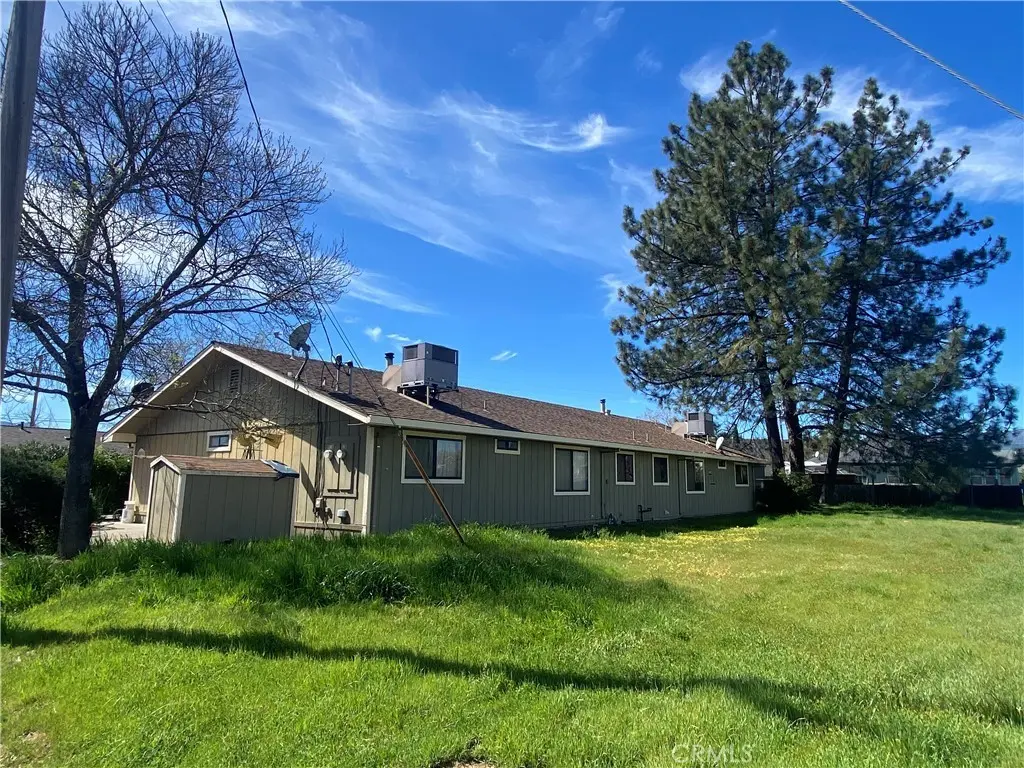
 Duplex
18735 Magnolia Ct · Hidden Valley Lake, CA
Flood risk 7/10 · Major
- FEMA flood zone
- AE
- Chance of flooding over 30 yrs
- 0.95%
- Est. flood insurance / yr
- $1,737 – $8,500
Fire risk 9/10 · Severe
- Est. fire insurance / yr
- $659 – $1,223
Heat risk 6/10 · Moderate
- Hot days now (above 101°F)
- 7 days/yr
- Hot days in 30 yrs
- 16 days/yr
Wind risk 1/10 · Minimal
- Chance of severe wind over 30 yrs
- —
Air-quality risk 10/10 · Severe
- Unhealthy air days now
- 34 days/yr
- Unhealthy air days in 30 yrs
- 35 days/yr
Risk factors via First Street. Map © Google.
Why this score? — see what drove the C- grade
The composite is a weighted blend of 9 inputs, each scored 0–100. Each bar is that input's sub-score; the figure is the points it added to the 100-point composite (weight × sub-score).
- Cash flow +15.1/30.0
- ARV discount +10.7/15.0
- Appreciation +5.1/10.0
- 1% rule +4.7/10.0
- DSCR +4.6/10.0
- Schools +2.9/10.0
- Livability +2.8/5.0
- Rent growth +2.5/5.0
- Condition / age +2.5/5.0
$329,900
🖨 Deal sheet 📄 Offer letter ✓ Due diligence
Multi-family units
County records classify this as Multi-Family (2-4 Unit). Listing-text estimate: 2 units. confirmed
Listing remarks MLS
Duplex opportunity! What a wonderful income opportunity on quiet cul-de-sac! This fully rented duplex with satisfied happy long-term tenants is truly a no brainer. Units have been well maintained in mostly original condition and each features 2 bedrooms, 2 baths and a 1 car garage with laundry hook ups. Easy maintenance property is about half driveway, for maximum parking and minimum upkeep.
Key facts
- 8,276 sq ft lot
- 2 garage spots
- Community pool
Neighborhood map
What this means for you Summary
Snapshot
- This is a 2 × 2-bed/2.0-bath units multifamily listed at $330k.
Deal economics
- At list price, monthly cash flow is $-320 ($-4k/yr) — negative. Per door: $-160/mo.
- To cash-flow at today's rent, offer at most $273k (17.1% below list).
- To meet the 1% rule (rent ≥ 1% of price), the offer needs to be $322k (2.5% below list).
- Recommended offer: $273k (17.1% below list) — sets the bar for cash-flow.
- Cap rate 6.7% vs local median 3.1% in Hidden Valley Lake — top-decile yield for the area; either an underpriced asset or a hidden risk that comps aren't pricing in. Stress-test before assuming the spread holds.
Location & tenants
- Location reads 56/100 on livability (#785 in CA) — a working-class tenant base; expect higher turnover. Strengths: housing A+; Watch: health & safety C-, crime D, amenities F.
- Middletown Unified (rural): math 24% / reading 41% proficiency, ranked #291 of 517 in CA (top 56%) — families likely to look elsewhere, expect single-tenant / working-renter base with shorter leases.
- Market conditions: 125 active listings in the ZIP; 3 comparable units currently listed for rent nearby; rentals lingering (median 44d on market — plan ~5-8 weeks vacancy on turnover, expect pricing pressure); 67% of comp listings sitting > 30 days — soft ceiling on asking rent; 107 units permitted in Lake County in 2024 (40 in 5+ unit buildings).
Forward outlook
- In year one you build about $3k of equity ($2k loan paydown + $456 appreciation (0.1% local appreciation)).
- Lake County population projected at -15% by 2050 — secular population decline; favor cash flow + early exit over multi-decade hold.
- By year 9, paydown + projected appreciation supports a ~$31k cash-out refi (75% LTV) — recoverable capital for the next deal without selling this one.
Negotiation context
- It's been on market 98 days — a 9% lower offer ($300k) is reasonable based on typical stale-listing flexibility.
- 5 sale attempts since 21y ago; this cycle's ask has dropped $20k (6%) from the opening price — seller is motivated, your offer sets the floor, not the list.
- Current owner paid $148k; list at $330k implies a 123% gain — meaningful room to come down on a strong offer.
Risks & watch-outs
- Watch-outs: flood insurance adds $427/mo.
- Climate carrying-cost: in FEMA flood zone AE (mandatory federal flood insurance); severe wildfire risk; extreme-heat days projected 7→16/yr by 2055 (HVAC capex compounding) — expect insurance premiums to compound above CPI over the hold.
Questions for the listing agent
- What do current leases actually rent for vs. the listed asking? Can we see a recent rent roll and the last 12 months of T-12 income?
- It's been on market 98 days. Have you received any prior offers? Is the seller open to a 17% concession, seller financing, or rate buy-down credit?
- Can we see the unit-by-unit rent roll, current vacancy, and any below-market leases? What's the average tenancy length?
- What capital expenditures (roof, boiler, parking lot, exteriors) have been made in the last 5 years, and what's planned in the next 2?
- What's the actual annual flood-insurance premium (NFIP or private), and is the property in a SFHA with mandatory coverage?
- What does the HOA fee cover, when was the last increase, and are there any pending special assessments or reserve-fund shortfalls?
- Why hasn't it sold? Are there any deal-killer items the seller is aware of (foundation, flood, title, zoning, code violations)?
- Is there a deadline driving the sale (1031 exchange, divorce, estate, relocation)? That informs how much negotiation room exists.
- Crime grade is D in this area — have there been break-ins, vandalism, or insurance claims at this property in the last 3 years? What carrier currently insures it and at what premium?
- What's the average days-on-market for RENTAL listings here right now (not sales)? A rising rental-DOM trend means longer vacancies and softer asking-rent achievability than the comps imply.
- What's the recent tenant-quality profile in this submarket — average credit score on applications, eviction rate, late-payment / NSF rate, and stable-employment percentage? A property-management company in the area should have these aggregated.
- How much new apartment / multifamily construction is in the pipeline within 1–3 miles? Heavy new supply (>2% of stock underway) typically softens rents 12–24 months out; light construction supports rent growth.
Investment metrics
- 1% rule
- 0.97% ✗
- Cap rate
- 6.68%
- Cash-on-cash
- 1.39%
- DSCR
- 1.06
- GRM
- 8.5
CMA / ARV
- ARV (median comp)
- $355,563
- List price
- $329,900
- Delta
- -7.22%
- Verdict
- FAIR
- Comps
- 2 within 1.0 mi
Projected returns pro-forma
0.14% appreciation · 3.0% rent growth · sell at horizon
- IRR
- -6.3%
- Equity multiple
- 0.70×
- Total profit
- $-27,474
- Equity at exit
- $98,077
- IRR
- -0.3%
- Equity multiple
- 0.97×
- Total profit
- $-2,795
- Equity at exit
- $119,732
Cash invested: $92,372 (down + closing). Projections, not guarantees.
Landlord ↔ Tenant lean methodology
- Overall (STATE)
- 18 Strongly Tenant-Friendly
- State California
- 18 Strongly Tenant-Friendly · D+13
- County
- — inherits STATE
- City
- — inherits STATE
ZIP-level market 95467
- Home prices YoY
- 0.1%
- Active inventory
- 125
- Price-to-rent
- 17.1×
Monthly cashflow live
- Estimated rent
- $3,216 medium interval (Pro) →
- Mortgage (P&I)
- −$1,730
- Tax from tax record
- −$239 /mo · $2,862/yr
- Insurance
- −$137
- Flood insurance flood zone
- −$427 /mo · $5,118/yr
- HOA
- −$328
- Vacancy / Maint / Mgmt
- −$675
- Net cashflow
- $-320
Break-even live
2-unit breakdown (identical units grouped — click to expand)
| Units | Beds | Baths | Est. rent |
|---|---|---|---|
| 2× units | 2 | 2 | $3,216 |
| #1 | 2 | 2 | $1,608 |
| #2 | 2 | 2 | $1,608 |
| Total (2 units) | $3,216 | ||
UW: 25.0% down · 7.5% · 30yr · 1.5% tax · 5.0% vac · 8.0% maint · 8.0% mgmt
Financing live
Cash to close
- Down payment
- $82,475
- Closing costs
- $9,897
- Reserves months
- —
- Total cash needed
- —
Loan-product check · same deal, 3 products live
Conventional
25% down · 7.5% · 30yr
- Down + closing
- —
- Monthly P&I
- —
- Monthly cashflow
- —
- DSCR
- —
- Eligible?
- —
Personal DTI + credit; lowest rate.
DSCR
20% down · 8.5% · 30yr
- Down + closing
- —
- Monthly P&I
- —
- Monthly cashflow
- —
- DSCR
- —
- Eligible?
- —
No personal income docs; deal must DSCR.
Hard money
10% down · 12.0% · 12mo
- Down + closing
- —
- Monthly P&I
- —
- Monthly cashflow
- —
- DSCR
- —
- Eligible?
- —
Short-term bridge; refi at stabilization.
Rent comps 3 comps
| Address | Beds | Baths | Sqft | Rent | $/sqft | DOM | Units | Dist |
|---|---|---|---|---|---|---|---|---|
| 18692 Horseshoe Rd Unit A Hidden Valley Lake, CA | 2.0 | 1.0 | 950 | $1,850 | $1.95 | 20d | 1 | 0.03mi |
| 19618 Stinson Rd Hidden Valley Lake, CA | 1.0 | 1.0 | 821 | $1,700 | $2.07 | 43d | 1 | 1.05mi |
| 18702 E Ridge Rd Hidden Valley Lake, CA | 2.0 | 2.0 | 1100 | $1,999 | $1.82 | 43d | 1 | 1.31mi |
HOA detail
- Monthly dues
- $328 · $3,936/yr
Listing history 30 events
-
2026-06-19days on market $329,900 Active 98 DOM
-
2026-06-18days on market $329,900 Active 97 DOM
-
2026-06-17days on market $329,900 Active 96 DOM
-
2026-06-16days on market $329,900 Active 95 DOM
-
2026-06-15days on market $329,900 Active 94 DOM
-
2026-06-14days on market $329,900 Active 92 DOM
-
2026-06-13days on market $329,900 Active 91 DOM
-
2026-06-10days on market $329,900 Active 89 DOM
-
2026-06-09days on market $329,900 Active 88 DOM
-
2026-06-08days on market $329,900 Active 87 DOM
-
2026-06-07days on market $329,900 Active 86 DOM
-
2026-06-05days on market $329,900 Active 83 DOM
-
2026-06-03days on market $329,900 Active 82 DOM
-
2026-06-02days on market $329,900 Active 81 DOM
-
2026-06-01days on market $329,900 Active 80 DOM
-
2026-05-31days on market $329,900 Active 79 DOM
-
2026-05-30days on market $329,900 Active 78 DOM
-
2026-04-09price $329,900 394-char remark
Show marketing remark (396 chars)
Duplex opportunity! What a wonderful income opportunity on quiet cul-de-sac! This fully rented duplex with satisfied happy long-term tenants is truly a no brainer. Units have been well maintained in mostly original condition and each features 2 bedrooms, 2 baths and a 1 car garage with laundry hook ups. Easy maintenance property is about half driveway, for maximum parking and minimum upkeep.
-
2026-04-09price $329,900 396-char remark
Show marketing remark (396 chars)
Duplex opportunity! What a wonderful income opportunity on quiet cul-de-sac! This fully rented duplex with satisfied happy long-term tenants is truly a no brainer. Units have been well maintained in mostly original condition and each features 2 bedrooms, 2 baths and a 1 car garage with laundry hook ups. Easy maintenance property is about half driveway, for maximum parking and minimum upkeep.
-
2026-03-17$349,900 Active 396-char remark
Show marketing remark (396 chars)
Duplex opportunity! What a wonderful income opportunity on quiet cul-de-sac! This fully rented duplex with satisfied happy long-term tenants is truly a no brainer. Units have been well maintained in mostly original condition and each features 2 bedrooms, 2 baths and a 1 car garage with laundry hook ups. Easy maintenance property is about half driveway, for maximum parking and minimum upkeep.
-
2026-03-13$349,900 Active 394-char remark
Show marketing remark (394 chars)
Duplex opportunity! What a wonderful income opportunity on quiet cul-de-sac! This fully rented duplex with satisfied happy long-term tenants is truly a no brainer. Units have been well maintained in mostly original condition and each features 2 bedrooms, 2 baths and a 1 car garage with laundry hook ups. Easy maintenance property is about half driveway, for maximum parking and minimum upkeep.
-
2009-04-10soldstatus $148,000
-
2009-04-09soldstatus $148,000
-
2008-09-22$148,000
-
2007-06-07historical
-
2006-11-13$379,000
-
2006-06-30soldstatus $320,000
-
2006-06-30soldstatus $330,000
-
2005-10-05$329,900
-
1990-07-16soldstatus $119,000
ⓘ Source: listings_history table (triggers on properties + properties_extension) + one-shot
backfill from property_details.listing_events for pre-trigger history.
Tax reassessment forecast CA · Resets to sale price
- Current annual tax
- $2,862 · $239/mo
- Projected year-2 tax
- $2,862 · $239/mo
- Expected delta
- $0/yr ($0/mo · 0.0%)
ⓘ Screening estimate from a state-policy table — verify with the county assessor before closing.
Climate risk First Street
- Flood 7/10 Severe FEMA zone AE · 95% chance over 30 yrs
- Wildfire 9/10 Extreme
- Heat 6/10 Major 7 d/yr ≥101°F today · 16 d/yr by 30 yrs out
- Wind 1/10 Low
- Air quality 10/10 Extreme 34 unhealthy d/yr today · 35 by 30 yrs out
Nearby sold comps map
Loading sold comps map…
Walkable amenities ~0.75 mi
Loading nearby amenities…
Taxation est. · year 1
- Rental income
- $38,592
- − Mortgage interest
- −$18,480
- − Property taxes
- −$2,862
- − Insurance
- −$6,768
- − Repairs & maintenance
- −$3,087
- − Management
- −$3,087
- − HOA
- −$3,936
- − Depreciation
- −$9,597
- Taxable loss
- −$9,226
- Est. tax savings @ 24.0%
- +$2,214
- After-tax cash flow
- $-1,625/yr
For passive investors: Depreciation is non-cash, so a rental often shows a tax loss while cash-flowing — sheltering income. Rental losses are passive: they offset passive income freely, and up to $25,000/yr can offset ordinary (W-2) income if you actively participate and your MAGI is under $100k (phasing out to $0 by $150k); unused losses carry forward. On sale, claimed depreciation is recaptured at up to 25%, and gains may owe capital-gains tax (a 1031 exchange can defer both). Figures are a year-1 estimate at your 24.0% rate — not tax advice; consult a CPA.
Schools (NCES district)
- District
- Middletown Unified
- NCES district ID
- 0624750
- Math proficiency
- 24% ▼ -9.00%
- Reading proficiency
- 41% ▼ -8.00%
- Median HH income
- $57,451
- Composite
- 28.92/100
- National rank
- #6632
- State rank
- #291 of 517 in CA
Livability — Hidden Valley Lake
- Score
- 56/100
- State rank
- #785
- US rank
- #22539
Category grades
Schools grade is shown separately in the Schools card above.
Census & demographics
- Census place
- Hidden Valley Lake, CA
- City population
- 5,721
- Population (ZIP)
- 5,721
Population outlook (Lake County) Hauer SSP2
- Today (2025)
- 62,396 people
- By 2030
- 60,626 · -2.8%
- By 2040
- 56,453 · -9.5%
- By 2050
- 53,054 · -15.0%
- By 2075
- 47,663 · -23.6%
- By 2100
- 41,804 · -33.0%
Race, ethnicity, and origin ACS 2023
- Neighborhood character
- Predominantly White (80%)
- Race & ethnicity
- White 80% Hispanic / Latino 13% Two or more races 11%
- Hispanic origin (detail)
- Mexican 8%
- Common ancestry
- Italian 5% Lithuanian 4% Slovak 4%
- Foreign-born
- 7% · Canada
- Languages at home
- 86% English-only · Spanish 11% Other Indo-European 1% French/Haitian/Cajun 1%
Political lean MEDSL · Lake
- 2024 margin
- Toss-up / Even · D 47.8% · R 49.2% · Other 3.0%
- 2008→2024 swing
- -20.6pp toward R · 2008: 19.3pp · 2024: -1.4pp
- All cycles
- 2024: R+1.4 2020: D+6.3 2016: D+3.7 2012: D+16.5 2008: D+19.3
Not yet ingested
- Civics
- —
Market trends
- HPI YoY
- ▲ 0.14%
- Current HPI
- 191.4165
- Rent YoY
- —
- Metro
- —
- State GDP YoY
- ▲ 3.21%
- F500 in state
- 116
Industry mix (Fortune 500 HQ in CA)
| Industry | F500 HQs | Revenue |
|---|---|---|
| Technology | 27 | $1,492B |
|
||
| Financial Services | 3 | $174B |
|
||
| Retail | 3 | $44B |
|
||
| Insurance | 3 | $26B |
|
||
| Media / Entertainment | 2 | $115B |
|
||
| Pharmaceuticals / Biotech | 2 | $62B |
|
||
Price history
+177.2% since first listed13 events — show timeline
- 2026-04-09 Price Changed $329,900 CRMLS
- 2026-04-09 Price Changed $329,900 BAREIS
- 2026-03-17 Listed $349,900 BAREIS
- 2026-03-13 Listed $349,900 CRMLS
- 2009-04-10 Sold (MLS) $148,000 CRMLS
- 2009-04-09 Sold (Public Records) $148,000 Public Records
- 2008-09-22 Listed $148,000 CRMLS
- 2007-06-07 Listing Removed — CRMLS
- 2006-11-13 Listed $379,000 CRMLS
- 2006-06-30 Sold (Public Records) $330,000 Public Records
- 2006-06-30 Sold (MLS) $320,000 CRMLS
- 2005-10-05 Listed $329,900 CRMLS
- 1990-07-16 Sold (Public Records) $119,000 Public Records
Property tax history
+0.5%/yrLatest (2025): $2,862 · +1.1% YoY. Source: county tax records.
Cash-flow waterfall
monthlySold comps — $/sqft
last 12 mo · ≤1 miLoading sold comps…