1390 Vegas Valley Dr #26 · Winchester, NV
Flood risk 1/10 · Minimal
- FEMA flood zone
- X (unshaded)
- Chance of flooding over 30 yrs
- 0.0%
- Est. flood insurance / yr
- $507 – $1,088
Fire risk 1/10 · Minimal
- Est. fire insurance / yr
- $490 – $910
Heat risk 8/10 · Major
- Hot days now (above 107°F)
- 7 days/yr
- Hot days in 30 yrs
- 17 days/yr
Wind risk 1/10 · Minimal
- Chance of severe wind over 30 yrs
- —
Air-quality risk 3/10 · Minor
- Unhealthy air days now
- 3 days/yr
- Unhealthy air days in 30 yrs
- 4 days/yr
Risk factors via First Street. Map © Google.
Why this score? — see what drove the C grade
The composite is a weighted blend of 9 inputs, each scored 0–100. Each bar is that input's sub-score; the figure is the points it added to the 100-point composite (weight × sub-score).
- Cash flow +22.5/30.0
- 1% rule +10.0/10.0
- ARV discount +7.5/15.0
- DSCR +7.2/10.0
- Livability +4.0/5.0
- Schools +2.6/10.0
- Condition / age +2.5/5.0
- Rent growth +1.4/5.0
- Appreciation +0.0/10.0
$119,000
🖨 Deal sheet 📄 Offer letter ✓ Due diligence
Listing remarks MLS
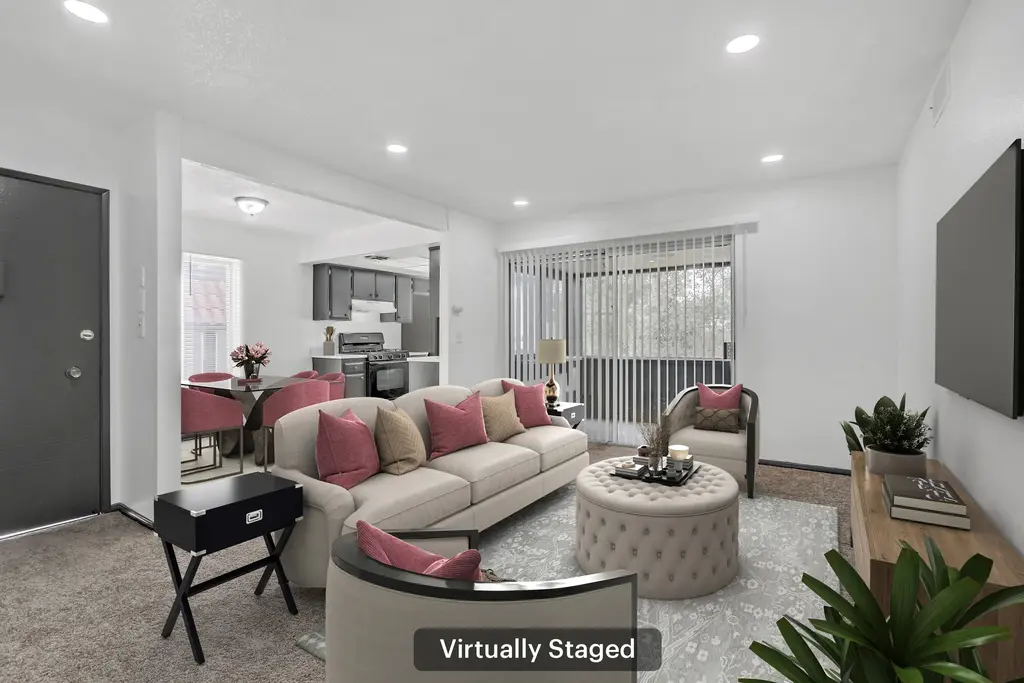
Location Location Location! Just minutes from the world-renowned Strip. Charming floor plan with a cozy balcony to unwind and enjoy the city lights. Freshly painted and updated flooring throughout. Kitchen with freshly painted cabinets, bright sunny window and expansive counter space. Dining space can be used with a bit of creativity to function as an office if you work remotely. Over sized bedrooms. Primary with closet organization. Patio has storage options. Dedicated parking space with convenient street parking.
Key facts
- Cozy balcony
- $570 HOA
- Parking
Tags
Neighborhood map
What this means for you Summary
Snapshot
- This is a 2-bed/1.0-bath condo listed at $119k.
Deal economics
- At list price, monthly cash flow is $200 ($2k/yr) — positive.
- The deal already cash-flows at list — no discount required.
- Meets the 1% rule at list price ($2k rent vs $119k).
- Recommended offer: $105k (12.0% below list) — sets the bar for market timing.
Location & tenants
- Location reads 79/100 on livability (#3 in NV, #2,272 nationally) — a middle-class / working-renter tenant base. Strengths: commute A+, cost of living A+, housing A+; Watch: crime F, employment D-.
- Clark County School District (urban): math 21% / reading 39% proficiency, ranked #11 of 17 in NV (top 65%) — families likely to look elsewhere, expect single-tenant / working-renter base with shorter leases.
- Market conditions: Rents falling (-4.4%/yr); 178 active listings in the ZIP; 23 comparable units currently listed for rent nearby; rentals lingering (median 44d on market — plan ~5-8 weeks vacancy on turnover, expect pricing pressure); 70% of comp listings sitting > 30 days — soft ceiling on asking rent; lower-income renter base — watch delinquency; 14,754 units permitted in Clark County in 2024 (2,301 in 5+ unit buildings).
- At $1,870/mo this rent would consume 55% of the median local household income ($41k/yr) (locally 2744% of renters already pay >50% of income on rent) — very limited rent-growth headroom before tenants either downsize or default.
Forward outlook
- Local home prices are declining (-3.0%/yr); year-one equity from $823 of loan paydown is wiped out by about $4k of value loss. Plan a longer hold.
- Clark County population projected at +36% by 2050 — long-run rental-demand tailwind backs the buy-and-hold thesis.
Negotiation context
- It's been on market 392 days — a 12% lower offer ($105k) is reasonable based on typical stale-listing flexibility.
- 3 sale attempts since 18y ago; this cycle's ask has dropped $36k (23%) from the opening price — seller is motivated, your offer sets the floor, not the list.
Risks & watch-outs
- Watch-outs: HOA is 30% of rent.
- Climate carrying-cost: extreme-heat days projected 7→17/yr by 2055 (HVAC capex compounding) — expect insurance premiums to compound above CPI over the hold.
Questions for the listing agent
- It's been on market 392 days. Have you received any prior offers? Is the seller open to a 12% concession, seller financing, or rate buy-down credit?
- Built in 1970 — when were the roof, HVAC, electrical panel, plumbing, and water heater last replaced?
- What does the HOA fee cover, when was the last increase, and are there any pending special assessments or reserve-fund shortfalls?
- Any open or pending special assessments — roof, HVAC, plumbing, elevator, façade? What's the per-unit balance and payoff schedule, and is the seller paying it off at close or rolling it to the buyer?
- Why hasn't it sold? Are there any deal-killer items the seller is aware of (foundation, flood, title, zoning, code violations)?
- Is there a deadline driving the sale (1031 exchange, divorce, estate, relocation)? That informs how much negotiation room exists.
- Crime grade is F in this area — have there been break-ins, vandalism, or insurance claims at this property in the last 3 years? What carrier currently insures it and at what premium?
- What's the average days-on-market for RENTAL listings here right now (not sales)? A rising rental-DOM trend means longer vacancies and softer asking-rent achievability than the comps imply.
- What's the recent tenant-quality profile in this submarket — average credit score on applications, eviction rate, late-payment / NSF rate, and stable-employment percentage? A property-management company in the area should have these aggregated.
- How much new apartment / multifamily construction is in the pipeline within 1–3 miles? Heavy new supply (>2% of stock underway) typically softens rents 12–24 months out; light construction supports rent growth.
Investment metrics
- 1% rule
- 1.57% ✓
- Cap rate
- 8.31%
- Cash-on-cash
- 7.20%
- DSCR
- 1.32
- GRM
- 5.3
CMA / ARV
No comps found within radius.
Projected returns pro-forma
-3.0% appreciation · 0.0% rent growth · sell at horizon
- IRR
- -10.1%
- Equity multiple
- 0.65×
- Total profit
- $-11,720
- Equity at exit
- $17,743
- IRR
- -8.2%
- Equity multiple
- 0.59×
- Total profit
- $-13,738
- Equity at exit
- $10,289
Cash invested: $33,320 (down + closing). Projections, not guarantees.
Landlord ↔ Tenant lean methodology
- Overall (STATE)
- 71 Landlord-Friendly
- State Nevada
- 71 Landlord-Friendly · R+1
- County
- — inherits STATE
- City
- — inherits STATE
ZIP-level market 89169
- Home prices YoY
- -33.4%
- Rents YoY
- -4.4%
- Active inventory
- 178
- Price-to-rent
- 5.3×
Monthly cashflow live
- Estimated rent
- $1,870 high interval (Pro) →
- Mortgage (P&I)
- −$624
- Tax from tax record
- −$34 /mo · $408/yr
- Insurance
- −$50
- HOA
- −$570
- Vacancy / Maint / Mgmt
- −$393
- Net cashflow
- $200
Break-even live
UW: 25.0% down · 7.5% · 30yr · 1.5% tax · 5.0% vac · 8.0% maint · 8.0% mgmt
Financing live
Cash to close
- Down payment
- $29,750
- Closing costs
- $3,570
- Reserves months
- —
- Total cash needed
- —
Loan-product check · same deal, 3 products live
Conventional
25% down · 7.5% · 30yr
- Down + closing
- —
- Monthly P&I
- —
- Monthly cashflow
- —
- DSCR
- —
- Eligible?
- —
Personal DTI + credit; lowest rate.
DSCR
20% down · 8.5% · 30yr
- Down + closing
- —
- Monthly P&I
- —
- Monthly cashflow
- —
- DSCR
- —
- Eligible?
- —
No personal income docs; deal must DSCR.
Hard money
10% down · 12.0% · 12mo
- Down + closing
- —
- Monthly P&I
- —
- Monthly cashflow
- —
- DSCR
- —
- Eligible?
- —
Short-term bridge; refi at stabilization.
Rent comps 23 comps
| Address | Beds | Baths | Sqft | Rent | $/sqft | DOM | Units | Dist |
|---|---|---|---|---|---|---|---|---|
| 900 E Desert Inn Rd Las Vegas, NV | 1.0–2.0 | 1.0–2.0 | 1077 | $1,800 | $1.67 | 43d | 5 | 0.72mi |
| 2831 Geary Pl #2909 Las Vegas, NV | 2.0 | 1.0 | 1112 | $1,899 | $1.71 | 43d | 1 | 0.86mi |
| 1040 Canosa Ave Las Vegas, NV | 2.0 | 1.0 | 969 | $1,745 | $1.80 | 43d | 1 | 0.90mi |
| 3152 S Eastern Ave Las Vegas, NV | 2.0 | 1.0 | 987 | $1,450 | $1.47 | 23d | 1 | 0.94mi |
| 3168 S Eastern Ave #48 Las Vegas, NV | 1.0 | 1.0 | 671 | $1,050 | $1.56 | 23d | 1 | 0.95mi |
| 511 E Sahara Ave Las Vegas, NV | 1.0–2.0 | 1.0 | 900 | $1,600 | $1.78 | 43d | 3 | 1.02mi |
| 322 Karen Ave Las Vegas, NV | 1.0–2.0 | 1.0–2.0 | 1109 | $3,500 | $3.15 | 4d | 3 | 1.06mi |
| 322 Karen Ave Las Vegas, NV | 1.0–2.0 | 1.5–2.0 | 1109 | $3,500 | $3.15 | 3d | 3 | 1.06mi |
| 1021 Griffith Ave Las Vegas, NV | 3.0 | 2.0 | 1094 | $2,200 | $2.01 | 43d | 1 | 1.13mi |
| 222 Karen Ave #2904 Las Vegas, NV | 1.0 | 1.5 | 814 | $2,200 | $2.70 | 1d | 1 | 1.14mi |
| 222 Karen Ave #3005 Las Vegas, NV | 1.0 | 1.5 | 814 | $2,400 | $2.95 | 23d | 1 | 1.14mi |
| 222 Karen Ave #3203 Las Vegas, NV | 1.0 | 2.0 | 814 | $2,500 | $3.07 | 43d | 1 | 1.14mi |
| 222 Karen Ave #306 Las Vegas, NV | 1.0 | 2.0 | 814 | $2,300 | $2.83 | 43d | 1 | 1.14mi |
| 222 Karen Ave #1105 Las Vegas, NV | 1.0 | 1.5 | 814 | $1,990 | $2.44 | 43d | 1 | 1.14mi |
| 222 Karen Ave #1004 Las Vegas, NV | 1.0 | 1.5 | 814 | $2,300 | $2.83 | 23d | 1 | 1.14mi |
| 1601 E Katie Ave Las Vegas, NV | 1.0–2.0 | 1.0–2.0 | 809 | $1,852 | $2.29 | 43d | 13 | 1.19mi |
| 525 E Saint Louis Ave Las Vegas, NV | 2.0 | 2.0 | 1094 | $1,525 | $1.39 | 43d | 1 | 1.23mi |
| 2137 E Saint Louis Ave Las Vegas, NV | 3.0 | 1.0 | 1028 | $1,700 | $1.65 | 43d | 1 | 1.25mi |
| 1700 E Viking Rd Las Vegas, NV | 2.0 | 2.0 | 1085 | $1,662 | $1.53 | 43d | 3 | 1.26mi |
| 595 S Royal Crest Cir #18 Las Vegas, NV | 2.0 | 1.0 | 816 | $1,575 | $1.93 | 43d | 1 | 1.28mi |
| 3550 Paradise Rd Las Vegas, NV | 3.0 | 1.0–2.0 | 947 | $1,425 | $1.50 | 43d | 20 | 1.36mi |
| 3930 University Center Dr Las Vegas, NV | 2.0 | 2.0–3.0 | 1200 | $1,725 | $1.44 | 43d | 2 | 1.45mi |
| 200 W Sahara Ave #1611 Las Vegas, NV | 1.0 | 1.0 | 1090 | $1,800 | $1.65 | 43d | 1 | 1.49mi |
HOA detail condo
- Monthly dues
- $570 · $6,840/yr
- Assessments
- None detected in remarks — confirm with the listing agent.
Listing history 25 events
-
2026-06-18days on market $119,000 Active 392 DOM
-
2026-06-17days on market $119,000 Active 391 DOM
-
2026-06-16days on market $119,000 Active 390 DOM
-
2026-06-15days on market $119,000 Active 389 DOM
-
2026-06-13days on market $119,000 Active 387 DOM
-
2026-06-09days on market $119,000 Active 383 DOM
-
2026-06-08days on market $119,000 Active 382 DOM
-
2026-06-07days on market $119,000 Active 381 DOM
-
2026-06-03days on market $119,000 Active 377 DOM
-
2026-06-02days on market $119,000 Active 376 DOM
-
2026-06-01days on market $119,000 Active 375 DOM
-
2026-05-31days on market $119,000 Active 374 DOM
-
2026-03-23price $119,000 520-char remark
Show marketing remark (520 chars)
Location Location Location! Just minutes from the world-renowned Strip. Charming floor plan with a cozy balcony to unwind and enjoy the city lights. Freshly painted and updated flooring throughout. Kitchen with freshly painted cabinets, bright sunny window and expansive counter space. Dining space can be used with a bit of creativity to function as an office if you work remotely. Over sized bedrooms. Primary with closet organization. Patio has storage options. Dedicated parking space with convenient street parking.
-
2025-10-29price $139,000 520-char remark
Show marketing remark (520 chars)
Location Location Location! Just minutes from the world-renowned Strip. Charming floor plan with a cozy balcony to unwind and enjoy the city lights. Freshly painted and updated flooring throughout. Kitchen with freshly painted cabinets, bright sunny window and expansive counter space. Dining space can be used with a bit of creativity to function as an office if you work remotely. Over sized bedrooms. Primary with closet organization. Patio has storage options. Dedicated parking space with convenient street parking.
-
2025-09-05price $149,000 520-char remark
Show marketing remark (520 chars)
Location Location Location! Just minutes from the world-renowned Strip. Charming floor plan with a cozy balcony to unwind and enjoy the city lights. Freshly painted and updated flooring throughout. Kitchen with freshly painted cabinets, bright sunny window and expansive counter space. Dining space can be used with a bit of creativity to function as an office if you work remotely. Over sized bedrooms. Primary with closet organization. Patio has storage options. Dedicated parking space with convenient street parking.
-
2025-05-22$155,000 Active 520-char remark
Show marketing remark (520 chars)
Location Location Location! Just minutes from the world-renowned Strip. Charming floor plan with a cozy balcony to unwind and enjoy the city lights. Freshly painted and updated flooring throughout. Kitchen with freshly painted cabinets, bright sunny window and expansive counter space. Dining space can be used with a bit of creativity to function as an office if you work remotely. Over sized bedrooms. Primary with closet organization. Patio has storage options. Dedicated parking space with convenient street parking.
-
2025-05-22historical
Show marketing remark (520 chars)
Location Location Location! Just minutes from the world-renowned Strip. Charming floor plan with a cozy balcony to unwind and enjoy the city lights. Freshly painted and updated flooring throughout. Kitchen with freshly painted cabinets, bright sunny window and expansive counter space. Dining space can be used with a bit of creativity to function as an office if you work remotely. Over sized bedrooms. Primary with closet organization. Patio has storage options. Dedicated parking space with convenient street parking.
-
2025-04-23price $159,000
-
2025-04-10price $169,000
-
2025-03-07$179,000 Active
-
2025-01-23soldstatus $110,000
-
2009-01-23soldstatus $30,000
-
2009-01-23historical
-
2008-12-24$30,000
-
1996-08-16soldstatus $54,900
ⓘ Source: listings_history table (triggers on properties + properties_extension) + one-shot
backfill from property_details.listing_events for pre-trigger history.
Tax reassessment forecast NV · Resets to sale price
- Current annual tax
- $408 · $34/mo
- Projected year-2 tax
- $702 · $59/mo
- Expected delta
- +$294/yr (+$25/mo · 72.2%)
ⓘ Screening estimate from a state-policy table — verify with the county assessor before closing.
Climate risk First Street
- Flood 1/10 Low FEMA zone X (unshaded) · 0% chance over 30 yrs
- Wildfire 1/10 Low
- Heat 8/10 Severe 7 d/yr ≥107°F today · 17 d/yr by 30 yrs out
- Wind 1/10 Low
- Air quality 3/10 Moderate 3 unhealthy d/yr today · 4 by 30 yrs out
Nearby sold comps map
Loading sold comps map…
Walkable amenities ~0.75 mi
Loading nearby amenities…
Taxation est. · year 1
- Rental income
- $22,444
- − Mortgage interest
- −$6,666
- − Property taxes
- −$408
- − Insurance
- −$595
- − Repairs & maintenance
- −$1,796
- − Management
- −$1,796
- − HOA
- −$6,840
- − Depreciation
- −$3,462
- Taxable income
- $883
- Est. tax owed @ 24.0%
- −$212
- After-tax cash flow
- $2,188/yr
For passive investors: Depreciation is non-cash, so a rental often shows a tax loss while cash-flowing — sheltering income. Rental losses are passive: they offset passive income freely, and up to $25,000/yr can offset ordinary (W-2) income if you actively participate and your MAGI is under $100k (phasing out to $0 by $150k); unused losses carry forward. On sale, claimed depreciation is recaptured at up to 25%, and gains may owe capital-gains tax (a 1031 exchange can defer both). Figures are a year-1 estimate at your 24.0% rate — not tax advice; consult a CPA.
Schools (NCES district)
- District
- Clark County School District
- NCES district ID
- 3200060
- Math proficiency
- 21% ▼ -13.00%
- Reading proficiency
- 39% ▼ -8.00%
- Median HH income
- $53,611
- Composite
- 26.48/100
- National rank
- #7211
- State rank
- #11 of 17 in NV
Livability — Winchester
- Score
- 79/100
- State rank
- #3
- US rank
- #2272
Category grades
Schools grade is shown separately in the Schools card above.
Census & demographics
- Census place
- Winchester, NV
- County
- Clark County · 2,306,105 people
- City population
- 39,883
- Metro
- Las Vegas-Henderson-Paradise, NV
- Population (ZIP)
- 22,171
- Household income
- $40,904
- Rent vs Own
- Severe rent burden
- 2744.0
Population outlook (Clark County) Hauer SSP2
- Today (2025)
- 2,504,101 people
- By 2030
- 2,693,770 · +7.6%
- By 2040
- 3,061,208 · +22.2%
- By 2050
- 3,400,072 · +35.8%
- By 2075
- 4,139,522 · +65.3%
- By 2100
- 4,596,916 · +83.6%
Race, ethnicity, and origin ACS 2023
- Neighborhood character
- Highly diverse neighborhood (Simpson 0.74)
- Race & ethnicity
- Hispanic / Latino 33% White 30% Black 23% Two or more races 13% Asian 9% Native American 2%
- Hispanic origin (detail)
- Mexican 21% Cuban 5%
- Common ancestry
- Iranian 1% Italian 1% Slovak 1%
- Foreign-born
- 30% · Canada, China
- Languages at home
- 59% English-only · Spanish 27% Tagalog/Filipino 4% Other Asian/Pacific 3%
Political lean MEDSL · Clark
- 2024 margin
- Toss-up / Even · D 50.4% · R 47.8% · Other 1.7%
- 2008→2024 swing
- -16.5pp toward R · 2008: 19.1pp · 2024: 2.6pp
- All cycles
- 2024: D+2.6 2020: D+9.3 2016: D+10.7 2012: D+14.5 2008: D+19.1
Not yet ingested
- Civics
- —
Market trends
- HPI YoY
- ▼ -136.91%
- Current HPI
- 272.6449
- Rent YoY
- ▼ -4.43%
- Metro
- Las Vegas-Henderson-Paradise, NV
- State GDP YoY
- ▲ 3.08%
- F500 in state
- 6
Industry mix (Fortune 500 HQ in NV)
| Industry | F500 HQs | Revenue |
|---|---|---|
| Hotels / Casinos | 3 | $36B |
|
||
Price history
+116.8% since first listed13 events — show timeline
- 2026-03-23 Price Changed $119,000 GLVAR
- 2025-10-29 Price Changed $139,000 GLVAR
- 2025-09-05 Price Changed $149,000 GLVAR
- 2025-05-22 Listing Removed — GLVAR
- 2025-05-22 Listed $155,000 GLVAR
- 2025-04-23 Price Changed $159,000 GLVAR
- 2025-04-10 Price Changed $169,000 GLVAR
- 2025-03-07 Listed $179,000 GLVAR
- 2025-01-23 Sold (Public Records) $110,000 Public Records
- 2009-01-23 Listing Removed — GLVAR
- 2009-01-23 Sold (MLS) $30,000 GLVAR
- 2008-12-24 Listed $30,000 GLVAR
- 1996-08-16 Sold (Public Records) $54,900 Public Records
Property tax history
+0.0%/yrLatest (2025): $408 · +7.3% YoY. Source: county tax records.
Cash-flow waterfall
monthlySold comps — $/sqft
last 12 mo · ≤1 miLoading sold comps…