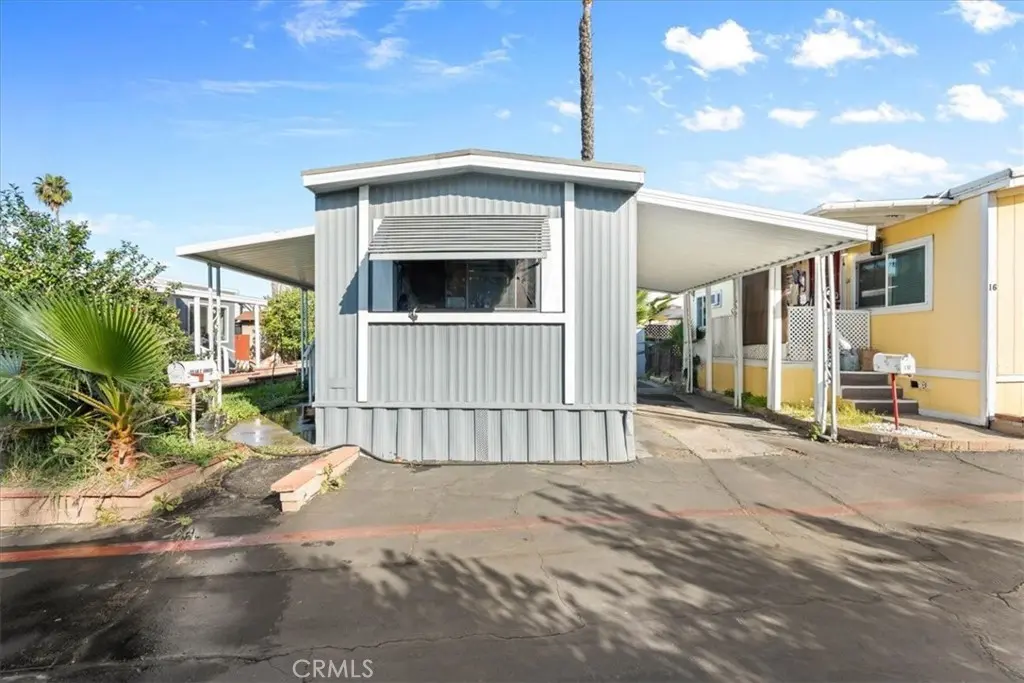
716 N Grand Ave Unit I-5 · Covina, CA
Flood risk 1/10 · Minimal
- FEMA flood zone
- X (unshaded)
- Chance of flooding over 30 yrs
- 0.0%
- Est. flood insurance / yr
- $507 – $1,088
Fire risk 5/10 · Moderate
- Est. fire insurance / yr
- $659 – $1,223
Heat risk 7/10 · Major
- Hot days now (above 98°F)
- 7 days/yr
- Hot days in 30 yrs
- 20 days/yr
Wind risk 1/10 · Minimal
- Chance of severe wind over 30 yrs
- —
Air-quality risk 7/10 · Major
- Unhealthy air days now
- 15 days/yr
- Unhealthy air days in 30 yrs
- 17 days/yr
Risk factors via First Street. Map © Google.
Why this score? — see what drove the B+ grade
The composite is a weighted blend of 9 inputs, each scored 0–100. Each bar is that input's sub-score; the figure is the points it added to the 100-point composite (weight × sub-score).
- Cash flow +30.0/30.0
- ARV discount +15.0/15.0
- 1% rule +10.0/10.0
- DSCR +10.0/10.0
- Schools +4.7/10.0
- Livability +3.6/5.0
- Rent growth +2.5/5.0
- Condition / age +2.2/5.0
- Appreciation +0.0/10.0
$46,900
🖨 Deal sheet 📄 Offer letter ✓ Due diligence
Listing remarks MLS
Charming mobile home in a prime location with quick and easy freeway access — perfect for commuters! This well-kept home offers comfortable living with a newer roof and ac system and a bright, open layout and great natural light throughout. Conveniently located near shopping, dining, and everyday essentials while still providing a peaceful place to call home. A great opportunity for affordable living in a super convenient area!
Key facts
- Parking
- Community pool
- Built 1975
Neighborhood map
What this means for you Summary
Snapshot
- This is a 1-bed/1.0-bath manufactured listed at $47k. Condition is rated fair.
Deal economics
- At list price, monthly cash flow is $1k ($14k/yr) — positive.
- The deal already cash-flows at list — no discount required.
- Meets the 1% rule at list price ($2k rent vs $47k).
- Recommended offer: $41k (12.0% below list) — sets the bar for market timing.
- Cap rate 37.1% vs local median 2.4% in Covina — top-decile yield for the area; either an underpriced asset or a hidden risk that comps aren't pricing in. Stress-test before assuming the spread holds.
Location & tenants
- Location reads 72/100 on livability (#181 in CA) — a middle-class / working-renter tenant base. Strengths: amenities A+, commute A+, employment A+; Watch: schools C-, crime C-, health & safety C-.
- Charter Oak Unified (suburban): math 45% / reading 55% proficiency, ranked #387 of 1,400 in CA (top 28%) — acceptable for families but not a draw, mixed tenant base, ~2y average lease.
- Market conditions: 66 active listings in the ZIP; 1 comparable units currently listed for rent nearby; solid renter incomes; 19,697 units permitted in Los Angeles County in 2024 (9,426 in 5+ unit buildings).
Forward outlook
- Local home prices are declining (-3.0%/yr); year-one equity from $324 of loan paydown is wiped out by about $1k of value loss. Plan a longer hold.
- Los Angeles County population projected at +9% by 2050 — modest demand growth; plan on rents tracking national, not racing it.
- At projected returns (-3.0% appreciation + 3.0% rent growth), your $13k cash investment doubles in ~1 year — after that, you're playing with house money.
Negotiation context
- It's been on market 135 days — a 12% lower offer ($41k) is reasonable based on typical stale-listing flexibility.
- 3 sale attempts since 5y ago with the ask held roughly flat each time — persistent listings suggest the price (not the market) is what's stuck; bring a comps-based counter.
- Current owner paid $25k; list at $47k implies a 88% gain — meaningful room to come down on a strong offer.
Risks & watch-outs
- Climate carrying-cost: moderate wildfire risk; extreme-heat days projected 7→20/yr by 2055 (HVAC capex compounding) — expect insurance premiums to compound above CPI over the hold.
Questions for the listing agent
- It's been on market 135 days. Have you received any prior offers? Is the seller open to a 12% concession, seller financing, or rate buy-down credit?
- Have any recent inspections been done? Can we get a copy of the seller's disclosures and any deferred-maintenance estimates?
- Built in 1975 — when were the roof, HVAC, electrical panel, plumbing, and water heater last replaced?
- Why hasn't it sold? Are there any deal-killer items the seller is aware of (foundation, flood, title, zoning, code violations)?
- Is there a deadline driving the sale (1031 exchange, divorce, estate, relocation)? That informs how much negotiation room exists.
- What's the average days-on-market for RENTAL listings here right now (not sales)? A rising rental-DOM trend means longer vacancies and softer asking-rent achievability than the comps imply.
- What's the recent tenant-quality profile in this submarket — average credit score on applications, eviction rate, late-payment / NSF rate, and stable-employment percentage? A property-management company in the area should have these aggregated.
- How much new for-sale + rental construction is in the pipeline within 1–3 miles? Heavy new supply typically softens prices + rents 12–24 months out; constrained supply supports both.
Investment metrics
- 1% rule
- 4.12% ✓
- Cap rate
- 37.06%
- Cash-on-cash
- 109.89%
- DSCR
- 5.89
- GRM
- 2.0
CMA / ARV
- ARV (median comp)
- $79,408
- List price
- $46,900
- Delta
- -40.94%
- Verdict
- UNDERPRICED
- Comps
- 2 within 1.0 mi
Show comp detail 5 sales within ~0.75 mi
| Address | Dist | Beds/Ba | Sqft | Sold | Price | $/sf | Match |
|---|---|---|---|---|---|---|---|
| 19548 Cypress St #33 | 0.17mi | 1/1.0 | 396 (-10%) | 3mo | $80,000 | $202 | 73 |
| 716 N Grand Unit G8 | 0.01mi | 2/2.0 (+1) | 420 (-4%) | 22mo | $43,000 | $102 | 65 |
| 19548-26 E Cypress #26 | 0.19mi | 2/1.0 (+1) | 390 (-11%) | 7mo | $80,000 | $205 | 62 |
| 19548 E Cypress St #40 | 0.16mi | 1/1.0 | 480 (+9%) | 21mo | $80,000 | $167 | 60 |
| 375 E San Bernardino Rd Unit A12 | 0.73mi | 1/1.0 | 432 (-2%) | 19mo | $84,999 | $197 | 47 |
Match score weights: distance 35% · size 25% · config 20% · recency 20%. Top-matched comps best support the ARV.
Projected returns pro-forma
-3.0% appreciation · 3.0% rent growth · sell at horizon
- IRR
- —
- Equity multiple
- 6.26×
- Total profit
- $69,019
- Equity at exit
- $6,993
- IRR
- —
- Equity multiple
- 13.10×
- Total profit
- $158,840
- Equity at exit
- $4,055
Cash invested: $13,132 (down + closing). Projections, not guarantees.
Landlord ↔ Tenant lean methodology
- Overall (STATE)
- 18 Strongly Tenant-Friendly
- State California
- 18 Strongly Tenant-Friendly · D+13
- County
- — inherits STATE
- City
- — inherits STATE
ZIP-level market 91724
- Active inventory
- 66
- Price-to-rent
- 2.0×
Monthly cashflow live
- Estimated rent
- $1,932 medium interval (Pro) →
- Mortgage (P&I)
- −$246
- Tax est. 1.5%
- −$59 /mo · $704/yr
- Insurance
- −$20
- HOA
- −$0
- Vacancy / Maint / Mgmt
- −$406
- Net cashflow
- $1,203
Break-even live
UW: 25.0% down · 7.5% · 30yr · 1.5% tax · 5.0% vac · 8.0% maint · 8.0% mgmt
Financing live
Cash to close
- Down payment
- $11,725
- Closing costs
- $1,407
- Reserves months
- —
- Total cash needed
- —
Loan-product check · same deal, 3 products live
Conventional
25% down · 7.5% · 30yr
- Down + closing
- —
- Monthly P&I
- —
- Monthly cashflow
- —
- DSCR
- —
- Eligible?
- —
Personal DTI + credit; lowest rate.
DSCR
20% down · 8.5% · 30yr
- Down + closing
- —
- Monthly P&I
- —
- Monthly cashflow
- —
- DSCR
- —
- Eligible?
- —
No personal income docs; deal must DSCR.
Hard money
10% down · 12.0% · 12mo
- Down + closing
- —
- Monthly P&I
- —
- Monthly cashflow
- —
- DSCR
- —
- Eligible?
- —
Short-term bridge; refi at stabilization.
Rent comps 1 comps
| Address | Beds | Baths | Sqft | Rent | $/sqft | DOM | Units | Dist |
|---|---|---|---|---|---|---|---|---|
| 320 N Lyman Ave Unit STUDIO Covina, CA | — | 1.0 | 340 | $1,700 | $5.00 | 13d | 1 | 1.26mi |
Listing history 20 events
-
2026-06-18days on market $46,900 Active 135 DOM
-
2026-06-17days on market $46,900 Active 134 DOM
-
2026-06-16days on market $46,900 Active 133 DOM
-
2026-06-15days on market $46,900 Active 132 DOM
-
2026-06-13days on market $46,900 Active 130 DOM
-
2026-06-13days on market $46,900 Active 129 DOM
-
2026-06-09days on market $46,900 Active 126 DOM
-
2026-06-08days on market $46,900 Active 125 DOM
-
2026-06-07days on market $46,900 Active 124 DOM
-
2026-06-04days on market $46,900 Active 121 DOM
-
2026-06-03days on market $46,900 Active 120 DOM
-
2026-06-02days on market $46,900 Active 119 DOM
-
2026-06-01days on market $46,900 Active 118 DOM
-
2026-05-31days on market $46,900 Active 117 DOM
-
2026-02-04status Active 437-char remark
Show marketing remark (437 chars)
Charming mobile home in a prime location with quick and easy freeway access — perfect for commuters! This well-kept home offers comfortable living with a newer roof and ac system and a bright, open layout and great natural light throughout. Conveniently located near shopping, dining, and everyday essentials while still providing a peaceful place to call home. A great opportunity for affordable living in a super convenient area!
-
2026-02-03$46,900 Active 437-char remark
Show marketing remark (437 chars)
Charming mobile home in a prime location with quick and easy freeway access — perfect for commuters! This well-kept home offers comfortable living with a newer roof and ac system and a bright, open layout and great natural light throughout. Conveniently located near shopping, dining, and everyday essentials while still providing a peaceful place to call home. A great opportunity for affordable living in a super convenient area!
-
2021-04-23soldstatus $25,000 Closed Sale 471-char remark
Show marketing remark (471 chars)
Welcome to Mobile Aire Estates. This is a one bedroom and one bathroom home featuring an open concept in the living room and kitchen, new AC/heating units, new floors and new roof. The park amenities include a pool, clubhouse, pool room and laundry facility. This is a cash only purchase and the monthly space rent is $1,160. Park approval is required: 1) FICO score 650+ 2) Total Monthly Gross Income 3x the monthly space rent ($3,480+). Schedule your appointment today.
-
2021-04-07historical Active Under Contract 471-char remark
Show marketing remark (471 chars)
Welcome to Mobile Aire Estates. This is a one bedroom and one bathroom home featuring an open concept in the living room and kitchen, new AC/heating units, new floors and new roof. The park amenities include a pool, clubhouse, pool room and laundry facility. This is a cash only purchase and the monthly space rent is $1,160. Park approval is required: 1) FICO score 650+ 2) Total Monthly Gross Income 3x the monthly space rent ($3,480+). Schedule your appointment today.
-
2021-03-23price $25,000 471-char remark
Show marketing remark (471 chars)
Welcome to Mobile Aire Estates. This is a one bedroom and one bathroom home featuring an open concept in the living room and kitchen, new AC/heating units, new floors and new roof. The park amenities include a pool, clubhouse, pool room and laundry facility. This is a cash only purchase and the monthly space rent is $1,160. Park approval is required: 1) FICO score 650+ 2) Total Monthly Gross Income 3x the monthly space rent ($3,480+). Schedule your appointment today.
-
2021-03-03$30,000 Active 471-char remark
Show marketing remark (471 chars)
Welcome to Mobile Aire Estates. This is a one bedroom and one bathroom home featuring an open concept in the living room and kitchen, new AC/heating units, new floors and new roof. The park amenities include a pool, clubhouse, pool room and laundry facility. This is a cash only purchase and the monthly space rent is $1,160. Park approval is required: 1) FICO score 650+ 2) Total Monthly Gross Income 3x the monthly space rent ($3,480+). Schedule your appointment today.
ⓘ Source: listings_history table (triggers on properties + properties_extension) + one-shot
backfill from property_details.listing_events for pre-trigger history.
Climate risk First Street
- Flood 1/10 Low FEMA zone X (unshaded) · 0% chance over 30 yrs
- Wildfire 5/10 Major
- Heat 7/10 Severe 7 d/yr ≥98°F today · 20 d/yr by 30 yrs out
- Wind 1/10 Low
- Air quality 7/10 Severe 15 unhealthy d/yr today · 17 by 30 yrs out
Nearby sold comps map
Loading sold comps map…
Walkable amenities ~0.75 mi
Loading nearby amenities…
Taxation est. · year 1
- Rental income
- $23,190
- − Mortgage interest
- −$2,627
- − Property taxes
- −$704
- − Insurance
- −$234
- − Repairs & maintenance
- −$1,855
- − Management
- −$1,855
- − Depreciation
- −$1,364
- Taxable income
- $14,550
- Est. tax owed @ 24.0%
- −$3,492
- After-tax cash flow
- $10,938/yr
For passive investors: Depreciation is non-cash, so a rental often shows a tax loss while cash-flowing — sheltering income. Rental losses are passive: they offset passive income freely, and up to $25,000/yr can offset ordinary (W-2) income if you actively participate and your MAGI is under $100k (phasing out to $0 by $150k); unused losses carry forward. On sale, claimed depreciation is recaptured at up to 25%, and gains may owe capital-gains tax (a 1031 exchange can defer both). Figures are a year-1 estimate at your 24.0% rate — not tax advice; consult a CPA.
Condition & rehab AI · 13 photos
This mobile home requires moderate repairs and maintenance to improve its condition and increase its resale and rental value.
Repairs flagged
- Major exterior siding — Severe weathering and peeling paint
- Major flooring — Worn carpet in living room and bedroom
- Major interior walls — Worn paint and discoloration
Value-add opportunities
- Resale Paint interior walls — Fresh paint can significantly improve the home's appearance and appeal to potential buyers
- Resale Replace carpet in living room and bedroom — New carpet can enhance the home's curb appeal and make it more attractive to potential buyers
- Both Trim and maintain landscaping — Well-maintained landscaping can improve the home's curb appeal and increase its rental value
Renovation cost estimate screening
| Repair item | Severity | Est. cost |
|---|---|---|
| exterior siding · Severe weathering and peeling paint | Major | $15,000–50,000 |
| flooring · Worn carpet in living room and bedroom | Major | $15,000–50,000 |
| interior walls · Worn paint and discoloration | Major | $15,000–50,000 |
| Total estimated repair cost · 3 items | $45,000–150,000 |
Value-add ROI direction
- Resale Paint interior walls — Fresh paint can significantly improve the home's appearance and appeal to potential buyers ↑
- Resale Replace carpet in living room and bedroom — New carpet can enhance the home's curb appeal and make it more attractive to potential buyers ↑
- Both Trim and maintain landscaping — Well-maintained landscaping can improve the home's curb appeal and increase its rental value ↑
ⓘ Cost ranges are severity-bucket heuristics (US national rule-of-thumb). Get contractor quotes + a written scope before underwriting a rehab budget.
Schools (NCES district)
- District
- Charter Oak Unified
- NCES district ID
- 0608190
- Math proficiency
- 45% ▲ 2.00%
- Reading proficiency
- 55% ▲ 4.00%
- Median HH income
- $72,756
- Composite
- 46.95/100
- National rank
- #5160
- State rank
- #387 of 1400 in CA
Livability — Covina
- Score
- 72/100
- State rank
- #181
- US rank
- #5811
Category grades
Schools grade is shown separately in the Schools card above.
Census & demographics
- Census place
- Covina, CA
- County
- Los Angeles County · 9,444,647 people
- City population
- 81,184
- Metro
- Los Angeles-Long Beach-Anaheim, CA
- Population (ZIP)
- 28,352
- Household income
- $103,163
- Rent vs Own
- Severe rent burden
- 550.0
Population outlook (Los Angeles County) Hauer SSP2
- Today (2025)
- 10,940,515 people
- By 2030
- 11,256,481 · +2.9%
- By 2040
- 11,729,929 · +7.2%
- By 2050
- 11,948,407 · +9.2%
- By 2075
- 11,818,114 · +8.0%
- By 2100
- 10,842,928 · -0.9%
Race, ethnicity, and origin ACS 2023
- Neighborhood character
- Diverse neighborhood (Simpson 0.63)
- Race & ethnicity
- Hispanic / Latino 55% White 22% Two or more races 19% Asian 14% Black 5% Native American 2%
- Hispanic origin (detail)
- Mexican 44%
- Common ancestry
- Portuguese 1% Slovak 1% Iranian 1%
- Foreign-born
- 24% · Canada, China, Vietnam
- Languages at home
- 53% English-only · Spanish 33% Chinese 5% Tagalog/Filipino 3%
Political lean MEDSL · Los Angeles
- 2024 margin
- Solid D (+32.9) · D 64.8% · R 31.9% · Other 3.3%
- 2008→2024 swing
- -7.4pp toward R · 2008: 40.4pp · 2024: 32.9pp
- All cycles
- 2024: D+32.9 2020: D+44.2 2016: D+48.0 2012: D+40.0 2008: D+40.4
Not yet ingested
- Civics
- —
Market trends
- HPI YoY
- ▼ -732.51%
- Current HPI
- 370.5956
- Rent YoY
- —
- Metro
- Los Angeles-Long Beach-Anaheim, CA
- State GDP YoY
- ▲ 3.21%
- F500 in state
- 116
Industry mix (Fortune 500 HQ in CA)
| Industry | F500 HQs | Revenue |
|---|---|---|
| Technology | 27 | $1,492B |
|
||
| Financial Services | 3 | $174B |
|
||
| Retail | 3 | $44B |
|
||
| Insurance | 3 | $26B |
|
||
| Media / Entertainment | 2 | $115B |
|
||
| Pharmaceuticals / Biotech | 2 | $62B |
|
||
Price history
+56.3% since first listed6 events — show timeline
- 2026-02-04 Relisted — CRMLS
- 2026-02-03 Listed $46,900 CRMLS
- 2021-04-23 Sold (MLS) $25,000 CRMLS
- 2021-04-07 Contingent — CRMLS
- 2021-03-23 Price Changed $25,000 CRMLS
- 2021-03-03 Listed $30,000 CRMLS
Cash-flow waterfall
monthlySold comps — $/sqft
last 12 mo · ≤1 miLoading sold comps…