 Duplex
912 Feather Dr · Copperopolis, CA
Flood risk 1/10 · Minimal
- FEMA flood zone
- X (shaded)
- Chance of flooding over 30 yrs
- 0.0%
- Est. flood insurance / yr
- $507 – $1,088
Fire risk 9/10 · Severe
- Est. fire insurance / yr
- $659 – $1,223
Heat risk 7/10 · Major
- Hot days now (above 103°F)
- 7 days/yr
- Hot days in 30 yrs
- 16 days/yr
Wind risk 1/10 · Minimal
- Chance of severe wind over 30 yrs
- —
Air-quality risk 10/10 · Severe
- Unhealthy air days now
- 30 days/yr
- Unhealthy air days in 30 yrs
- 35 days/yr
Risk factors via First Street. Map © Google.
Why this score? — see what drove the C grade
The composite is a weighted blend of 9 inputs, each scored 0–100. Each bar is that input's sub-score; the figure is the points it added to the 100-point composite (weight × sub-score).
- Cash flow +23.2/30.0
- DSCR +7.5/10.0
- ARV discount +7.5/15.0
- 1% rule +5.5/10.0
- Schools +4.5/10.0
- Livability +2.9/5.0
- Rent growth +2.5/5.0
- Condition / age +2.5/5.0
- Appreciation +0.0/10.0
$359,000
🖨 Deal sheet 📄 Offer letter ✓ Due diligence
Multi-family units
County records classify this as Multi-Family (2-4 Unit). Listing-text estimate: 2 units. confirmed
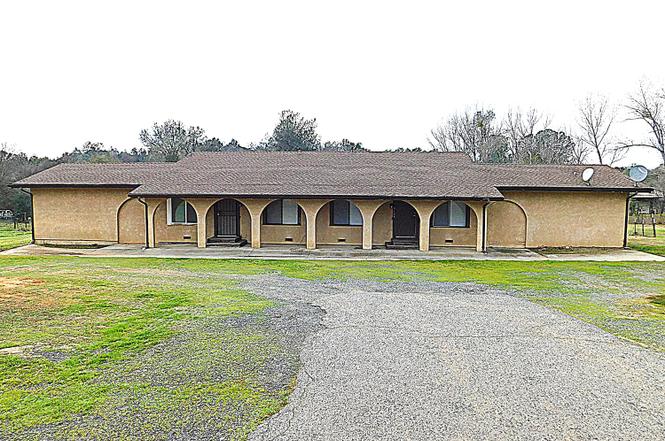
Listing remarks
Great location close to Lake Tulloch, and centrally located in Copperopolis. Don't miss this opportunity-proven investment property or live in one unit and rent the other one! This is a nice Duplex and both units are 2 bedroom/1 bath. Both units feature a kitchen with dining space, laundry hookups, and a nice size living room. Each Unit has its own attached garage, back yard, and deck off the kitchen. The large lot offers additional parking and large side yards for each unit. Located within the Copper Cove HOA offering a boat ramp, clubhouse and more.
Key facts
- Back yard
- Attached garage
- Investment property
Tags
Property features AI
Finance
- HOA & community: Mandatory association; Annual association fee of $225; Community clubhouse and recreation facilities
Exterior
- Parking: 5 parking spaces total; Attached 2-car garage; Guest parking available
- Utilities: Public water; Sewer: Other; No irrigation
- Home design: Duplex (residential income); Apartments subtype; Single-story
- Construction: Built in 1973; Composition roof
- Exterior features: Yard space; Irregular-shaped lot
Interior
- Kitchen: Dishwasher; Free-standing electric oven; Free-standing electric range
- Bedrooms: Unit 1: 2 bedrooms; Unit 2: 2 bedrooms
- Flooring: Carpet; Laminate; Vinyl; Varies by unit
- Bathrooms: Unit 1: 1 full bathroom; Unit 2: 1 full bathroom
- Heating & cooling: Central heating; Central cooling
- Interior features: Covered deck; Varies by unit interior condition
- Laundry & utility: Washer/dryer hookups
Neighborhood map
What this means for you Summary
Snapshot
- This is a 2 × 2-bed/1.0-bath units multifamily listed at $359k.
Deal economics
- At list price, monthly cash flow is $652 ($8k/yr) — positive. Per door: $326/mo.
- The deal already cash-flows at list — no discount required.
- Meets the 1% rule at list price ($4k rent vs $359k).
- Recommended offer: $316k (12.0% below list) — sets the bar for market timing.
- Cap rate 8.5% vs local median 2.0% in Copperopolis — top-decile yield for the area; either an underpriced asset or a hidden risk that comps aren't pricing in. Stress-test before assuming the spread holds.
Location & tenants
- Location reads 58/100 on livability (#691 in CA) — a working-class tenant base; expect higher turnover. Strengths: housing A+, employment A-, crime B+; Watch: schools D+, amenities F, commute F.
- Bret Harte Union High (town): math 35% / reading 65% proficiency, ranked #429 of 1,400 in CA (top 31%) — acceptable for families but not a draw, mixed tenant base, ~2y average lease.
- Market conditions: 235 active listings in the ZIP; 77 units permitted in Calaveras County in 2024 (0 in 5+ unit buildings).
Forward outlook
- Local home prices are declining (-3.0%/yr); year-one equity from $2k of loan paydown is wiped out by about $11k of value loss. Plan a longer hold.
- Calaveras County population projected at -18% by 2050 — secular population decline; favor cash flow + early exit over multi-decade hold.
Negotiation context
- It's been on market 136 days — a 12% lower offer ($316k) is reasonable based on typical stale-listing flexibility.
- Current owner paid $215k; list at $359k implies a 67% gain — meaningful room to come down on a strong offer.
Risks & watch-outs
- Climate carrying-cost: severe wildfire risk; extreme-heat days projected 7→16/yr by 2055 (HVAC capex compounding) — expect insurance premiums to compound above CPI over the hold.
Questions for the listing agent
- It's been on market 136 days. Have you received any prior offers? Is the seller open to a 12% concession, seller financing, or rate buy-down credit?
- Can we see the unit-by-unit rent roll, current vacancy, and any below-market leases? What's the average tenancy length?
- What capital expenditures (roof, boiler, parking lot, exteriors) have been made in the last 5 years, and what's planned in the next 2?
- Built in 1973 — when were the roof, HVAC, electrical panel, plumbing, and water heater last replaced?
- What does the HOA fee cover, when was the last increase, and are there any pending special assessments or reserve-fund shortfalls?
- Why hasn't it sold? Are there any deal-killer items the seller is aware of (foundation, flood, title, zoning, code violations)?
- Is there a deadline driving the sale (1031 exchange, divorce, estate, relocation)? That informs how much negotiation room exists.
- Schools are D-rated, which usually means shorter tenancies and higher turnover. Who's the typical renter profile here, and what's been the actual vacancy rate?
- What's the average days-on-market for RENTAL listings here right now (not sales)? A rising rental-DOM trend means longer vacancies and softer asking-rent achievability than the comps imply.
- What's the recent tenant-quality profile in this submarket — average credit score on applications, eviction rate, late-payment / NSF rate, and stable-employment percentage? A property-management company in the area should have these aggregated.
- How much new apartment / multifamily construction is in the pipeline within 1–3 miles? Heavy new supply (>2% of stock underway) typically softens rents 12–24 months out; light construction supports rent growth.
Investment metrics
- 1% rule
- 1.05% ✓
- Cap rate
- 8.47%
- Cash-on-cash
- 7.78%
- DSCR
- 1.35
- GRM
- 8.0
CMA / ARV
No comps found within radius.
Projected returns pro-forma
-3.0% appreciation · 3.0% rent growth · sell at horizon
- IRR
- -4.4%
- Equity multiple
- 0.83×
- Total profit
- $-16,696
- Equity at exit
- $53,528
- IRR
- 5.2%
- Equity multiple
- 1.39×
- Total profit
- $38,742
- Equity at exit
- $31,040
Cash invested: $100,520 (down + closing). Projections, not guarantees.
Landlord ↔ Tenant lean methodology
- Overall (STATE)
- 18 Strongly Tenant-Friendly
- State California
- 18 Strongly Tenant-Friendly · D+13
- County
- — inherits STATE
- City
- — inherits STATE
ZIP-level market 95228
- Active inventory
- 235
- Price-to-rent
- 15.9×
Monthly cashflow live
- Estimated rent
- $3,754 medium interval (Pro) →
- Mortgage (P&I)
- −$1,883
- Tax from tax record
- −$262 /mo · $3,150/yr
- Insurance
- −$150
- HOA
- −$19
- Vacancy / Maint / Mgmt
- −$788
- Net cashflow
- $652
Break-even live
2-unit breakdown (identical units grouped — click to expand)
| Units | Beds | Baths | Est. rent |
|---|---|---|---|
| 2× units | 2 | 1 | $3,754 |
| #1 | 2 | 1 | $1,877 |
| #2 | 2 | 1 | $1,877 |
| Total (2 units) | $3,754 | ||
UW: 25.0% down · 7.5% · 30yr · 1.5% tax · 5.0% vac · 8.0% maint · 8.0% mgmt
Financing live
Cash to close
- Down payment
- $89,750
- Closing costs
- $10,770
- Reserves months
- —
- Total cash needed
- —
Loan-product check · same deal, 3 products live
Conventional
25% down · 7.5% · 30yr
- Down + closing
- —
- Monthly P&I
- —
- Monthly cashflow
- —
- DSCR
- —
- Eligible?
- —
Personal DTI + credit; lowest rate.
DSCR
20% down · 8.5% · 30yr
- Down + closing
- —
- Monthly P&I
- —
- Monthly cashflow
- —
- DSCR
- —
- Eligible?
- —
No personal income docs; deal must DSCR.
Hard money
10% down · 12.0% · 12mo
- Down + closing
- —
- Monthly P&I
- —
- Monthly cashflow
- —
- DSCR
- —
- Eligible?
- —
Short-term bridge; refi at stabilization.
HOA detail
- Monthly dues
- $19 · $228/yr
Listing history 18 events
-
2026-06-19price $359,000 Active 136 DOM
-
2026-06-18days on market $375,000 Active 136 DOM
-
2026-06-17days on market $375,000 Active 135 DOM
-
2026-06-16days on market $375,000 Active 134 DOM
-
2026-06-15days on market $375,000 Active 133 DOM
-
2026-06-14days on market $375,000 Active 131 DOM
-
2026-06-10days on market $375,000 Active 128 DOM
-
2026-06-09days on market $375,000 Active 127 DOM
-
2026-06-08days on market $375,000 Active 126 DOM
-
2026-06-07days on market $375,000 Active 125 DOM
-
2026-06-05days on market $375,000 Active 122 DOM
-
2026-06-03days on market $375,000 Active 121 DOM
-
2026-06-02days on market $375,000 Active 120 DOM
-
2026-06-01days on market $375,000 Active 119 DOM
-
2026-05-31days on market $375,000 Active 118 DOM
-
2026-05-30days on market $375,000 Active 117 DOM
-
2021-09-23soldstatus $215,000
-
2004-03-26soldstatus $220,500
ⓘ Source: listings_history table (triggers on properties + properties_extension) + one-shot
backfill from property_details.listing_events for pre-trigger history.
Tax reassessment forecast CA · Resets to sale price
- Current annual tax
- $3,150 · $262/mo
- Projected year-2 tax
- $3,150 · $262/mo
- Expected delta
- $0/yr ($0/mo · 0.0%)
ⓘ Screening estimate from a state-policy table — verify with the county assessor before closing.
Climate risk First Street
- Flood 1/10 Low FEMA zone X (shaded) · 0% chance over 30 yrs
- Wildfire 9/10 Extreme
- Heat 7/10 Severe 7 d/yr ≥103°F today · 16 d/yr by 30 yrs out
- Wind 1/10 Low
- Air quality 10/10 Extreme 30 unhealthy d/yr today · 35 by 30 yrs out
Nearby sold comps map
Loading sold comps map…
Walkable amenities ~0.75 mi
Loading nearby amenities…
Taxation est. · year 1
- Rental income
- $45,048
- − Mortgage interest
- −$20,110
- − Property taxes
- −$3,150
- − Insurance
- −$1,795
- − Repairs & maintenance
- −$3,604
- − Management
- −$3,604
- − HOA
- −$228
- − Depreciation
- −$10,444
- Taxable income
- $2,114
- Est. tax owed @ 24.0%
- −$507
- After-tax cash flow
- $7,316/yr
For passive investors: Depreciation is non-cash, so a rental often shows a tax loss while cash-flowing — sheltering income. Rental losses are passive: they offset passive income freely, and up to $25,000/yr can offset ordinary (W-2) income if you actively participate and your MAGI is under $100k (phasing out to $0 by $150k); unused losses carry forward. On sale, claimed depreciation is recaptured at up to 25%, and gains may owe capital-gains tax (a 1031 exchange can defer both). Figures are a year-1 estimate at your 24.0% rate — not tax advice; consult a CPA.
Schools (NCES district)
- District
- Bret Harte Union High
- NCES district ID
- 0605940
- Math proficiency
- 35% ▲ 5.00%
- Reading proficiency
- 65% ▲ 5.00%
- Median HH income
- $56,974
- Composite
- 45.41/100
- National rank
- #5708
- State rank
- #429 of 1400 in CA
Livability — Copperopolis
- Score
- 58/100
- State rank
- #691
- US rank
- #21010
Category grades
Schools grade is shown separately in the Schools card above.
Census & demographics
- Census place
- Copperopolis, CA
- Population (ZIP)
- 4,880
Population outlook (Calaveras County) Hauer SSP2
- Today (2025)
- 43,163 people
- By 2030
- 41,703 · -3.4%
- By 2040
- 38,202 · -11.5%
- By 2050
- 35,385 · -18.0%
- By 2075
- 30,807 · -28.6%
- By 2100
- 25,755 · -40.3%
Race, ethnicity, and origin ACS 2023
- Neighborhood character
- Predominantly White (71%)
- Race & ethnicity
- White 71% Hispanic / Latino 25% Two or more races 15% Black 2%
- Hispanic origin (detail)
- Mexican 21%
- Common ancestry
- Iranian 4% Romanian 4% Russian 3%
- Foreign-born
- 3% · Canada
- Languages at home
- 91% English-only · Spanish 9% Tagalog/Filipino 1%
Political lean MEDSL · Calaveras
- 2024 margin
- Strong R (+28.1) · D 34.7% · R 62.8% · Other 2.5%
- 2008→2024 swing
- -15.2pp toward R · 2008: -13.0pp · 2024: -28.1pp
- All cycles
- 2024: R+28.1 2020: R+23.8 2016: R+23.9 2012: R+17.0 2008: R+13.0
Not yet ingested
- Civics
- —
Market trends
- HPI YoY
- ▼ -141.73%
- Current HPI
- 176.1251
- Rent YoY
- —
- Metro
- —
- State GDP YoY
- ▲ 3.21%
- F500 in state
- 116
Industry mix (Fortune 500 HQ in CA)
| Industry | F500 HQs | Revenue |
|---|---|---|
| Technology | 27 | $1,492B |
|
||
| Financial Services | 3 | $174B |
|
||
| Retail | 3 | $44B |
|
||
| Insurance | 3 | $26B |
|
||
| Media / Entertainment | 2 | $115B |
|
||
| Pharmaceuticals / Biotech | 2 | $62B |
|
||
Price history
-2.5% since first listed2 events — show timeline
- 2021-09-23 Sold (Public Records) $215,000 Public Records
- 2004-03-26 Sold (Public Records) $220,500 Public Records
Property tax history
+4.7%/yrLatest (2025): $3,150 · +0.8% YoY. Source: county tax records.
Cash-flow waterfall
monthlySold comps — $/sqft
last 12 mo · ≤1 miLoading sold comps…