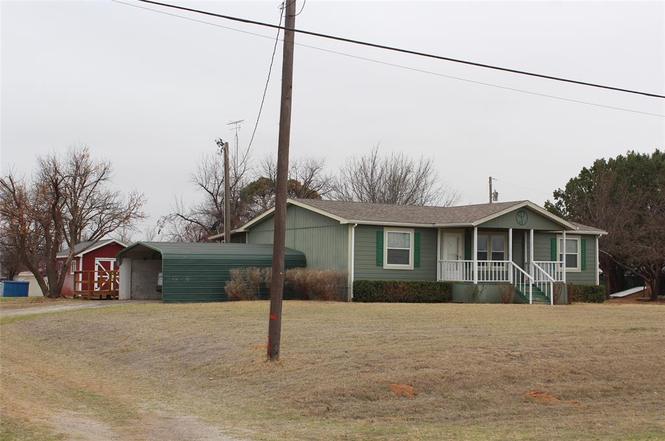
601 Carothers Ave · Rochester, TX
Flood risk 1/10 · Minimal
- FEMA flood zone
- —
- Chance of flooding over 30 yrs
- 0.0%
- Est. flood insurance / yr
- —
Fire risk 1/10 · Minimal
- Est. fire insurance / yr
- $1,222 – $2,270
Heat risk 7/10 · Major
- Hot days now (above 107°F)
- 7 days/yr
- Hot days in 30 yrs
- 20 days/yr
Wind risk 3/10 · Minor
- Chance of severe wind over 30 yrs
- 7.0%
Air-quality risk 2/10 · Minimal
- Unhealthy air days now
- 2 days/yr
- Unhealthy air days in 30 yrs
- 2 days/yr
Risk factors via First Street. Map © Google.
Why this score? — see what drove the C- grade
The composite is a weighted blend of 9 inputs, each scored 0–100. Each bar is that input's sub-score; the figure is the points it added to the 100-point composite (weight × sub-score).
- Cash flow +17.3/30.0
- Appreciation +7.8/10.0
- ARV discount +7.5/15.0
- DSCR +5.4/10.0
- 1% rule +3.5/10.0
- Livability +3.0/5.0
- Schools +2.8/10.0
- Rent growth +2.5/5.0
- Condition / age +2.5/5.0
$135,000
🖨 Deal sheet 📄 Offer letter ✓ Due diligence
Listing remarks
This charming and well maintained 2006 mobile home is situated on three spacious lots. This home has never been moved and is securely anchored, offering peace of mind and stability. The property has been lovingly cared for and features a welcoming front porch along with a screened in back porch. A ramp provides convenient access to the back entrance. Outside, you’ll find plenty of useful amenities including a two car carport, two storage buildings, a well, and a storm cellar. The yard has mature trees as well as pear, peach, and a beautiful redbud, creating a pleasant outdoor setting. Gutters are already installed for added functionality. Inside, the home offers a comfortable layout w
Key facts
- Three spacious lots
- Storm cellar
- Two car carport
Tags
Property features AI
Finance
- Financial info: Listing terms include Cash, Conventional, FHA, and VA Loan
- HOA & community: No association
Exterior
- Parking: Covered carport for 2 vehicles
- Security: Smoke detector(s)
- Utilities: City water; City sewer; Electricity connected; All-weather road access; Alley access
- Home design: Residential mobile home; One story; Accessible approach with ramp; Not attached to another property
- Construction: Built in 2006; Siding exterior; Composition roof
- Exterior features: Covered porches; Front porch; Rear porch; Screened porch; Deck; Storage; Storm cellar; Corner lot; Utilities easement
Interior
- Kitchen: Electric range; Microwave; Refrigerator
- Bedrooms: 3 bedrooms (all on the main level)
- Flooring: Carpet; Vinyl
- Bathrooms: 2 full bathrooms
- Heating & cooling: Central heat; Central air
- Interior features: High speed internet available; Window coverings
- Laundry & utility: Full-size washer/dryer area; Washer hookup; Electric dryer hookup; Utility room
Neighborhood map
What this means for you Summary
Snapshot
- This is a 3-bed/2.0-bath manufactured listed at $135k.
Deal economics
- At list price, monthly cash flow is $98 ($1k/yr) — positive.
- The deal already cash-flows at list — no discount required.
- To meet the 1% rule (rent ≥ 1% of price), the offer needs to be $115k (14.6% below list).
- Recommended offer: $115k (14.6% below list) — sets the bar for 1% rule.
Location & tenants
- Location reads 59/100 on livability (#1,110 in TX) — a working-class tenant base; expect higher turnover. Strengths: cost of living A+, housing A+; Watch: health & safety C-, crime F, amenities F.
- Haskell CISD (town): math 31% / reading 36% proficiency, ranked #561 of 826 in TX (top 68%) — families likely to look elsewhere, expect single-tenant / working-renter base with shorter leases; 63% free/reduced lunch — lower-income household profile, screen leases tightly.
- Zoned schools: Haskell El (math 27% / reading 37%, grade F, #2,268 of 4,322 statewide, top 55%, 267 students, 68% FRL).
- Market conditions: 4 active listings in the ZIP.
Forward outlook
- In year one you build about $8k of equity ($933 loan paydown + $7k appreciation (5.5% local appreciation)).
- Haskell County population projected at +6% by 2050 — modest demand growth; plan on rents tracking national, not racing it.
- At projected returns (5.5% appreciation + 3.0% rent growth), your $38k cash investment doubles in ~4 years — after that, you're playing with house money.
- By year 5, paydown + projected appreciation supports a ~$37k cash-out refi (75% LTV) — recoverable capital for the next deal without selling this one.
Negotiation context
- It's been on market 94 days — a 9% lower offer ($123k) is reasonable based on typical stale-listing flexibility.
Risks & watch-outs
- Climate carrying-cost: extreme-heat days projected 7→20/yr by 2055 (HVAC capex compounding) — expect insurance premiums to compound above CPI over the hold.
Questions for the listing agent
- It's been on market 94 days. Have you received any prior offers? Is the seller open to a 15% concession, seller financing, or rate buy-down credit?
- Why hasn't it sold? Are there any deal-killer items the seller is aware of (foundation, flood, title, zoning, code violations)?
- Is there a deadline driving the sale (1031 exchange, divorce, estate, relocation)? That informs how much negotiation room exists.
- Schools are F-rated, which usually means shorter tenancies and higher turnover. Who's the typical renter profile here, and what's been the actual vacancy rate?
- Crime grade is F in this area — have there been break-ins, vandalism, or insurance claims at this property in the last 3 years? What carrier currently insures it and at what premium?
- What's the average days-on-market for RENTAL listings here right now (not sales)? A rising rental-DOM trend means longer vacancies and softer asking-rent achievability than the comps imply.
- What's the recent tenant-quality profile in this submarket — average credit score on applications, eviction rate, late-payment / NSF rate, and stable-employment percentage? A property-management company in the area should have these aggregated.
- How much new for-sale + rental construction is in the pipeline within 1–3 miles? Heavy new supply typically softens prices + rents 12–24 months out; constrained supply supports both.
Investment metrics
- 1% rule
- 0.85% ✗
- Cap rate
- 7.16%
- Cash-on-cash
- 3.10%
- DSCR
- 1.14
- GRM
- 9.8
CMA / ARV
No comps found within radius.
Projected returns pro-forma
5.53% appreciation · 3.0% rent growth · sell at horizon
- IRR
- 16.8%
- Equity multiple
- 2.09×
- Total profit
- $41,389
- Equity at exit
- $80,871
- IRR
- 16.8%
- Equity multiple
- 4.12×
- Total profit
- $117,860
- Equity at exit
- $143,326
Cash invested: $37,800 (down + closing). Projections, not guarantees.
Landlord ↔ Tenant lean methodology
- Overall (STATE)
- 87 Strongly Landlord-Friendly
- State Texas
- 87 Strongly Landlord-Friendly · R+5
- County
- — inherits STATE
- City
- — inherits STATE
ZIP-level market 79544
- Home prices YoY
- 5.7%
- Active inventory
- 4
- Price-to-rent
- 9.8×
Monthly cashflow live
- Estimated rent
- $1,153 medium interval (Pro) →
- Mortgage (P&I)
- −$708
- Tax from tax record
- −$49 /mo · $592/yr
- Insurance
- −$56
- HOA
- −$0
- Vacancy / Maint / Mgmt
- −$242
- Net cashflow
- $98
Break-even live
UW: 25.0% down · 7.5% · 30yr · 1.5% tax · 5.0% vac · 8.0% maint · 8.0% mgmt
Financing live
Cash to close
- Down payment
- $33,750
- Closing costs
- $4,050
- Reserves months
- —
- Total cash needed
- —
Loan-product check · same deal, 3 products live
Conventional
25% down · 7.5% · 30yr
- Down + closing
- —
- Monthly P&I
- —
- Monthly cashflow
- —
- DSCR
- —
- Eligible?
- —
Personal DTI + credit; lowest rate.
DSCR
20% down · 8.5% · 30yr
- Down + closing
- —
- Monthly P&I
- —
- Monthly cashflow
- —
- DSCR
- —
- Eligible?
- —
No personal income docs; deal must DSCR.
Hard money
10% down · 12.0% · 12mo
- Down + closing
- —
- Monthly P&I
- —
- Monthly cashflow
- —
- DSCR
- —
- Eligible?
- —
Short-term bridge; refi at stabilization.
Listing history 11 events
-
2026-06-09status $135,000 Pending 94 DOM
-
2026-06-08days on market $135,000 Active Contingent 94 DOM
-
2026-06-08days on market $135,000 Active Contingent 93 DOM
-
2026-06-05days on market $135,000 Active Contingent 91 DOM
-
2026-06-03days on market $135,000 Active Contingent 89 DOM
-
2026-06-02days on market $135,000 Active Contingent 88 DOM
-
2026-06-01days on market $135,000 Active Contingent 87 DOM
-
2026-05-31days on market $135,000 Active Contingent 86 DOM
-
2026-04-28historical Active Option Contract
-
2026-03-06$135,000 Active
-
2005-10-17soldstatus
ⓘ Source: listings_history table (triggers on properties + properties_extension) + one-shot
backfill from property_details.listing_events for pre-trigger history.
Tax reassessment forecast TX · Resets to sale price
- Current annual tax
- $592 · $49/mo
- Projected year-2 tax
- $2,470 · $206/mo
- Expected delta
- +$1,878/yr (+$157/mo · 317.2%)
ⓘ Screening estimate from a state-policy table — verify with the county assessor before closing.
Climate risk First Street
- Flood 1/10 Low 0% chance over 30 yrs
- Wildfire 1/10 Low
- Heat 7/10 Severe 7 d/yr ≥107°F today · 20 d/yr by 30 yrs out
- Wind 3/10 Moderate 7% chance of damaging wind over 30 yrs
- Air quality 2/10 Low 2 unhealthy d/yr today · 2 by 30 yrs out
Nearby sold comps map
Loading sold comps map…
Walkable amenities ~0.75 mi
Loading nearby amenities…
Taxation est. · year 1
- Rental income
- $13,842
- − Mortgage interest
- −$7,562
- − Property taxes
- −$592
- − Insurance
- −$675
- − Repairs & maintenance
- −$1,107
- − Management
- −$1,107
- − Depreciation
- −$3,927
- Taxable loss
- −$1,129
- Est. tax savings @ 24.0%
- +$271
- After-tax cash flow
- $1,443/yr
For passive investors: Depreciation is non-cash, so a rental often shows a tax loss while cash-flowing — sheltering income. Rental losses are passive: they offset passive income freely, and up to $25,000/yr can offset ordinary (W-2) income if you actively participate and your MAGI is under $100k (phasing out to $0 by $150k); unused losses carry forward. On sale, claimed depreciation is recaptured at up to 25%, and gains may owe capital-gains tax (a 1031 exchange can defer both). Figures are a year-1 estimate at your 24.0% rate — not tax advice; consult a CPA.
Schools (NCES district)
- District
- Haskell CISD
- NCES district ID
- 4822740
- Math proficiency
- 31% ▼ -18.00%
- Reading proficiency
- 36% ▼ -8.00%
- Median HH income
- $41,661
- Composite
- 28.29/100
- National rank
- #6791
- State rank
- #561 of 826 in TX
Livability — Rochester
- Score
- 59/100
- State rank
- #1110
- US rank
- #19666
Category grades
Schools grade is shown separately in the Schools card above.
Census & demographics
- Census place
- Rochester, TX
- Population (ZIP)
- 440
Population outlook (Haskell County) Hauer SSP2
- Today (2025)
- 5,679 people
- By 2030
- 5,693 · +0.2%
- By 2040
- 5,769 · +1.6%
- By 2050
- 6,012 · +5.9%
- By 2075
- 6,792 · +19.6%
- By 2100
- 6,531 · +15.0%
Race, ethnicity, and origin ACS 2023
- Neighborhood character
- Diverse neighborhood (Simpson 0.62)
- Race & ethnicity
- White 46% Hispanic / Latino 40% Two or more races 20% Black 6%
- Hispanic origin (detail)
- Mexican 40%
- Foreign-born
- 5% · Canada
- Languages at home
- 68% English-only · Spanish 32%
Political lean MEDSL · Haskell
- 2024 margin
- Solid R (+71.5) · D 13.9% · R 85.4%
- 2008→2024 swing
- -38.9pp toward R · 2008: -32.6pp · 2024: -71.5pp
- All cycles
- 2024: R+71.5 2020: R+67.2 2016: R+61.7 2012: R+43.4 2008: R+32.6
Not yet ingested
- Civics
- —
Market trends
- HPI YoY
- ▲ 5.53%
- Current HPI
- 102.2845
- Rent YoY
- —
- Metro
- —
- State GDP YoY
- ▲ 3.95%
- F500 in state
- 110
Industry mix (Fortune 500 HQ in TX)
| Industry | F500 HQs | Revenue |
|---|---|---|
| Energy | 16 | $1,198B |
|
||
| Technology | 5 | $198B |
|
||
| Engineering / Construction | 4 | $72B |
|
||
| Energy Services | 3 | $60B |
|
||
| Utilities | 3 | $41B |
|
||
| Healthcare | 2 | $330B |
|
||
Price history
3 events — show timeline
- 2026-04-28 Contingent — NTREIS
- 2026-03-06 Listed $135,000 NTREIS
- 2005-10-17 Sold (Public Records) — Public Records
Property tax history
-3.3%/yrLatest (2025): $592 · +5.4% YoY. Source: county tax records.
Cash-flow waterfall
monthlySold comps — $/sqft
last 12 mo · ≤1 miLoading sold comps…