941 W Main St · Jackson, MO
Flood risk 1/10 · Minimal
- FEMA flood zone
- X (unshaded)
- Chance of flooding over 30 yrs
- 0.0%
- Est. flood insurance / yr
- $473 – $860
Fire risk 2/10 · Minimal
- Est. fire insurance / yr
- $1,054 – $1,958
Heat risk 5/10 · Moderate
- Hot days now (above 109°F)
- 7 days/yr
- Hot days in 30 yrs
- 22 days/yr
Wind risk 2/10 · Minimal
- Chance of severe wind over 30 yrs
- 3.0%
Air-quality risk 2/10 · Minimal
- Unhealthy air days now
- 0 days/yr
- Unhealthy air days in 30 yrs
- 1 days/yr
Risk factors via First Street. Map © Google.
Why this score? — see what drove the D+ grade
The composite is a weighted blend of 9 inputs, each scored 0–100. Each bar is that input's sub-score; the figure is the points it added to the 100-point composite (weight × sub-score).
- ARV discount +15.0/15.0
- Cash flow +12.9/30.0
- Schools +4.0/10.0
- DSCR +3.9/10.0
- Rent growth +3.6/5.0
- Livability +3.5/5.0
- 1% rule +2.5/10.0
- Condition / age +2.5/5.0
- Appreciation +0.0/10.0
$165,000
🖨 Deal sheet 📄 Offer letter ✓ Due diligence
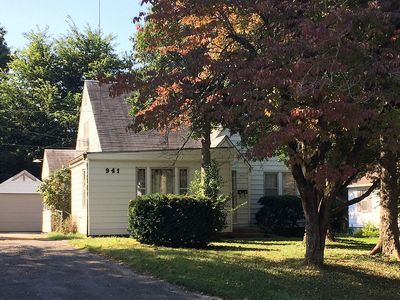
Listing remarks
Adorable white frame, full of charm, located in historic Uptown Jackson!! This home boast 3 bedrooms, 1 bath, remodeled 2018, full unfinished basement and beautiful original hardwood floors, refinished in 2019! Perfect home for first time home buyers or investment property!! Only $165,000 interior pics will be uploaded soon. Stay Tuned!!
Key facts
- Built 1939
Neighborhood map
What this means for you Summary
Snapshot
- This is a 2-bed/1.0-bath single-family listed at $165k.
Deal economics
- At list price, monthly cash flow is $-12 ($-146/yr) — negative.
- To cash-flow at today's rent, offer at most $163k (1.3% below list).
- To meet the 1% rule (rent ≥ 1% of price), the offer needs to be $124k (24.6% below list).
- Recommended offer: $124k (24.6% below list) — sets the bar for 1% rule.
- Cap rate 6.2% vs local median 3.4% in Jackson — top-decile yield for the area; either an underpriced asset or a hidden risk that comps aren't pricing in. Stress-test before assuming the spread holds.
Location & tenants
- Location reads 69/100 on livability (#160 in MO) — a middle-class / working-renter tenant base. Strengths: crime A+, cost of living A+, housing A+; Watch: amenities F, commute F, health & safety F.
- Jackson R-II (suburban): math 41% / reading 51% proficiency, ranked #73 of 324 in MO (top 22%) — families likely to look elsewhere, expect single-tenant / working-renter base with shorter leases.
- Market conditions: Rents rising fast (+4.5%/yr); 176 active listings in the ZIP; solid renter incomes; 81 units permitted in Cape Girardeau County in 2024 (0 in 5+ unit buildings).
Forward outlook
- Local home prices are declining (-3.0%/yr); year-one equity from $1k of loan paydown is wiped out by about $5k of value loss. Plan a longer hold.
- Cape Girardeau County population projected at +17% by 2050 — long-run rental-demand tailwind backs the buy-and-hold thesis.
Negotiation context
- Only 1 days on market — expect competitive offers; lowballing is unlikely to land.
Risks & watch-outs
- Watch-outs: built in 1939 — expect roof / HVAC / electrical / plumbing capex.
- Climate carrying-cost: extreme-heat days projected 7→22/yr by 2055 (HVAC capex compounding) — expect insurance premiums to compound above CPI over the hold.
Questions for the listing agent
- What do current leases actually rent for vs. the listed asking? Can we see a recent rent roll and the last 12 months of T-12 income?
- Built in 1939 — when were the roof, HVAC, electrical panel, plumbing, and water heater last replaced?
- Is there a deadline driving the sale (1031 exchange, divorce, estate, relocation)? That informs how much negotiation room exists.
- The area grade is low — what's the realistic commute time and amenity access for the typical tenant pool here? Any planned neighborhood developments (good or bad) we should know about?
- What's the average days-on-market for RENTAL listings here right now (not sales)? A rising rental-DOM trend means longer vacancies and softer asking-rent achievability than the comps imply.
- What's the recent tenant-quality profile in this submarket — average credit score on applications, eviction rate, late-payment / NSF rate, and stable-employment percentage? A property-management company in the area should have these aggregated.
- How much new for-sale + rental construction is in the pipeline within 1–3 miles? Heavy new supply typically softens prices + rents 12–24 months out; constrained supply supports both.
Investment metrics
- 1% rule
- 0.75% ✗
- Cap rate
- 6.20%
- Cash-on-cash
- -0.32%
- DSCR
- 0.99
- GRM
- 11.1
CMA / ARV
- ARV (on-the-fly)
- $223,448
- Comps found
- 12
Show comp detail 12 sales within ~0.75 mi
| Address | Dist | Beds/Ba | Sqft | Sold | Price | $/sf | Match |
|---|---|---|---|---|---|---|---|
| 208 S Bast St | 0.15mi | 2/2.0 | 1,496 (-9%) | 11mo | $179,000 | $120 | 65 |
| 1119 Oak St | 0.22mi | 3/1.5 (+1) | 1,582 (-4%) | 14mo | $215,900 | $136 | 65 |
| 208 Elmwood Blvd | 0.11mi | 3/2.0 (+1) | 1,480 (-10%) | 6mo | $184,900 | $125 | 64 |
| 304 Morgan St | 0.35mi | 3/2.0 (+1) | 1,693 (+3%) | 8mo | $209,900 | $124 | 63 |
| 315 Elmwood Blvd | 0.24mi | 2/2.0 | 1,758 (+7%) | 15mo | $212,900 | $121 | 61 |
| 1552 Enterprise Ct | 0.47mi | 3/2.0 (+1) | 1,481 (-10%) | 4mo | $289,500 | $195 | 49 |
| 1686 Columbia Dr | 0.58mi | 3/2.0 (+1) | 1,496 (-9%) | 1mo | $278,500 | $186 | 48 |
| 319 N Russell St | 0.61mi | 3/2.0 (+1) | 1,683 (+2%) | 14mo | $219,000 | $130 | 46 |
| 864 Strawberry Ln | 0.72mi | 3/2.0 (+1) | 1,536 (-6%) | 2mo | $195,000 | $127 | 45 |
| 1670 Jackson Ridge Dr | 0.63mi | 3/2.0 (+1) | 1,800 (+10%) | 6mo | $315,000 | $175 | 41 |
| 1607 Enterprise Ct | 0.51mi | 3/2.0 (+1) | 1,445 (-12%) | 12mo | $299,000 | $207 | 37 |
| 413 Byrd Ct | 0.70mi | 3/2.0 (+1) | 1,450 (-12%) | 8mo | $324,900 | $224 | 32 |
Match score weights: distance 35% · size 25% · config 20% · recency 20%. Top-matched comps best support the ARV.
Projected returns pro-forma
-3.0% appreciation · 4.49% rent growth · sell at horizon
- IRR
- -15.4%
- Equity multiple
- 0.44×
- Total profit
- $-25,688
- Equity at exit
- $24,602
- IRR
- -4.9%
- Equity multiple
- 0.66×
- Total profit
- $-15,644
- Equity at exit
- $14,266
Cash invested: $46,200 (down + closing). Projections, not guarantees.
Landlord ↔ Tenant lean methodology
- Overall (STATE)
- 81 Strongly Landlord-Friendly
- State Missouri
- 81 Strongly Landlord-Friendly · R+10
- County
- — inherits STATE
- City
- — inherits STATE
ZIP-level market 63755
- Rents YoY
- 4.5%
- Active inventory
- 176
- Price-to-rent
- 11.1×
Monthly cashflow live
- Estimated rent
- $1,244 medium interval (Pro) →
- Mortgage (P&I)
- −$865
- Tax from tax record
- −$61 /mo · $733/yr
- Insurance
- −$69
- HOA
- −$0
- Vacancy / Maint / Mgmt
- −$261
- Net cashflow
- $-12
Break-even live
UW: 25.0% down · 7.5% · 30yr · 1.5% tax · 5.0% vac · 8.0% maint · 8.0% mgmt
Financing live
Cash to close
- Down payment
- $41,250
- Closing costs
- $4,950
- Reserves months
- —
- Total cash needed
- —
Loan-product check · same deal, 3 products live
Conventional
25% down · 7.5% · 30yr
- Down + closing
- —
- Monthly P&I
- —
- Monthly cashflow
- —
- DSCR
- —
- Eligible?
- —
Personal DTI + credit; lowest rate.
DSCR
20% down · 8.5% · 30yr
- Down + closing
- —
- Monthly P&I
- —
- Monthly cashflow
- —
- DSCR
- —
- Eligible?
- —
No personal income docs; deal must DSCR.
Hard money
10% down · 12.0% · 12mo
- Down + closing
- —
- Monthly P&I
- —
- Monthly cashflow
- —
- DSCR
- —
- Eligible?
- —
Short-term bridge; refi at stabilization.
Listing history 1 events
-
2014-06-03soldstatus
ⓘ Source: listings_history table (triggers on properties + properties_extension) + one-shot
backfill from property_details.listing_events for pre-trigger history.
Tax reassessment forecast MO · Resets to sale price
- Current annual tax
- $733 · $61/mo
- Projected year-2 tax
- $1,600 · $133/mo
- Expected delta
- +$868/yr (+$72/mo · 118.5%)
ⓘ Screening estimate from a state-policy table — verify with the county assessor before closing.
Climate risk First Street
- Flood 1/10 Low FEMA zone X (unshaded) · 0% chance over 30 yrs
- Wildfire 2/10 Low
- Heat 5/10 Major 7 d/yr ≥109°F today · 22 d/yr by 30 yrs out
- Wind 2/10 Low 3% chance of damaging wind over 30 yrs
- Air quality 2/10 Low 0 unhealthy d/yr today · 1 by 30 yrs out
Nearby sold comps map
Loading sold comps map…
Walkable amenities ~0.75 mi
Loading nearby amenities…
Taxation est. · year 1
- Rental income
- $14,931
- − Mortgage interest
- −$9,243
- − Property taxes
- −$733
- − Insurance
- −$825
- − Repairs & maintenance
- −$1,194
- − Management
- −$1,194
- − Depreciation
- −$4,800
- Taxable loss
- −$3,058
- Est. tax savings @ 24.0%
- +$734
- After-tax cash flow
- $588/yr
For passive investors: Depreciation is non-cash, so a rental often shows a tax loss while cash-flowing — sheltering income. Rental losses are passive: they offset passive income freely, and up to $25,000/yr can offset ordinary (W-2) income if you actively participate and your MAGI is under $100k (phasing out to $0 by $150k); unused losses carry forward. On sale, claimed depreciation is recaptured at up to 25%, and gains may owe capital-gains tax (a 1031 exchange can defer both). Figures are a year-1 estimate at your 24.0% rate — not tax advice; consult a CPA.
Schools (NCES district)
- District
- Jackson R-II
- NCES district ID
- 2915600
- Math proficiency
- 41% ▼ -6.00%
- Reading proficiency
- 51% ▬ 0.00%
- Median HH income
- $52,935
- Composite
- 39.72/100
- National rank
- #3898
- State rank
- #73 of 324 in MO
Livability — Jackson
- Score
- 69/100
- State rank
- #160
- US rank
- #8843
Category grades
Schools grade is shown separately in the Schools card above.
Census & demographics
- Census place
- Jackson, MO
- County
- Cape Girardeau County · 75,175 people
- City population
- 27,629
- Metro
- Cape Girardeau, MO-IL
- Population (ZIP)
- 27,629
- Household income
- $78,750
- Rent vs Own
- Severe rent burden
- 354.0
Population outlook (Cape Girardeau County) Hauer SSP2
- Today (2025)
- 84,807 people
- By 2030
- 88,016 · +3.8%
- By 2040
- 93,914 · +10.7%
- By 2050
- 99,541 · +17.4%
- By 2075
- 114,527 · +35.0%
- By 2100
- 121,718 · +43.5%
Race, ethnicity, and origin ACS 2023
- Neighborhood character
- Predominantly White (92%)
- Race & ethnicity
- White 92% Two or more races 4% Hispanic / Latino 3% Black 2%
- Common ancestry
- Slovak 2% Italian 2% Lithuanian 1%
- Foreign-born
- 1% · Canada
- Languages at home
- 98% English-only · Spanish 1%
Political lean MEDSL · Cape Girardeau
- 2024 margin
- Solid R (+46.5) · D 26.2% · R 72.7% · Other 1.1%
- 2008→2024 swing
- -12.9pp toward R · 2008: -33.6pp · 2024: -46.5pp
- All cycles
- 2024: R+46.5 2020: R+45.0 2016: R+50.1 2012: R+43.8 2008: R+33.6
Not yet ingested
- Civics
- —
Market trends
- HPI YoY
- ▼ -120.83%
- Current HPI
- 179.1136
- Rent YoY
- ▲ 4.49%
- Metro
- Cape Girardeau, MO-IL
- State GDP YoY
- ▲ 1.84%
- F500 in state
- 20
Industry mix (Fortune 500 HQ in MO)
| Industry | F500 HQs | Revenue |
|---|---|---|
| Healthcare | 1 | $163B |
|
||
| Insurance | 1 | $21B |
|
||
| Industrial Technology | 1 | $17B |
|
||
| Retail | 1 | $16B |
|
||
| Industrial Distribution | 1 | $10B |
|
||
| Utilities | 1 | $9B |
|
||
Property tax history
+1.9%/yrLatest (2025): $733 · +5.1% YoY. Source: county tax records.
Cash-flow waterfall
monthlySold comps — $/sqft
last 12 mo · ≤1 miLoading sold comps…