222 Roby Ln Unit CA · Wofford Heights, CA
Flood risk 1/10 · Minimal
- FEMA flood zone
- X (unshaded)
- Chance of flooding over 30 yrs
- 0.0%
- Est. flood insurance / yr
- $507 – $1,088
Fire risk 8/10 · Major
- Est. fire insurance / yr
- $659 – $1,223
Heat risk 6/10 · Moderate
- Hot days now (above 101°F)
- 7 days/yr
- Hot days in 30 yrs
- 20 days/yr
Wind risk 1/10 · Minimal
- Chance of severe wind over 30 yrs
- —
Air-quality risk 10/10 · Severe
- Unhealthy air days now
- 26 days/yr
- Unhealthy air days in 30 yrs
- 33 days/yr
Risk factors via First Street. Map © Google.
Why this score? — see what drove the A- grade
The composite is a weighted blend of 9 inputs, each scored 0–100. Each bar is that input's sub-score; the figure is the points it added to the 100-point composite (weight × sub-score).
- Cash flow +30.0/30.0
- ARV discount +15.0/15.0
- DSCR +10.0/10.0
- Appreciation +10.0/10.0
- 1% rule +9.3/10.0
- Schools +2.6/10.0
- Rent growth +2.5/5.0
- Livability +2.2/5.0
- Condition / age +2.2/5.0
$69,500
🖨 Deal sheet 📄 Offer letter ✓ Due diligence
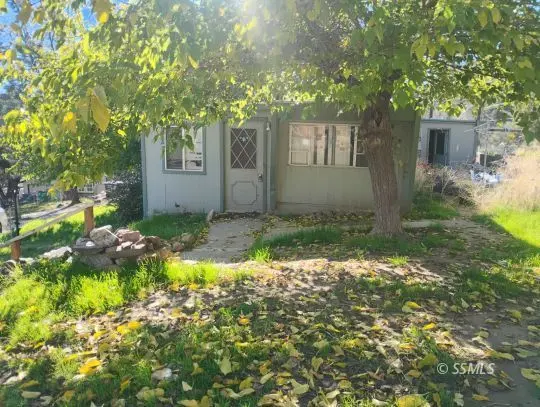
Listing remarks
Here is a great, singlewide mobile with an addition that virtually double the square footage. It sits on a beautiful lot, with a nice lake view. This home does need some repairs and updating but nothing major it is being sold AS-IS, the seller will be doing no repairs. Just imagine sitting on a lounge chair, drinking a cup of coffee and watching the sun shining off the lake. The mobile has one bedroom and a bath. The addition has the living room and a second room that could be a bedroom. Come take a look and see the possibilities.
Key facts
- Addition
- Lake view
- Beautiful lot
Tags
Neighborhood map
What this means for you Summary
Snapshot
- This is a 2-bed/1.0-bath manufactured listed at $70k. Condition is rated fair.
Deal economics
- At list price, monthly cash flow is $307 ($4k/yr) — positive.
- The deal already cash-flows at list — no discount required.
- Meets the 1% rule at list price ($997 rent vs $70k).
- Recommended offer: $61k (12.0% below list) — sets the bar for market timing.
- Cap rate 11.6% vs local median 3.8% in Wofford Heights — top-decile yield for the area; either an underpriced asset or a hidden risk that comps aren't pricing in. Stress-test before assuming the spread holds.
Location & tenants
- Location reads 45/100 on livability (#1,317 in CA) — a working-class tenant base; expect higher turnover. Strengths: crime B, cost of living B; Watch: schools F, amenities F, commute F.
- Kernville Union Elementary (rural): math 20% / reading 37% proficiency, ranked #1,128 of 1,400 in CA (top 81%) — low school quality limits family demand, transient renter base, plan for 1-2y turnover; 65% free/reduced lunch — lower-income household profile, screen leases tightly.
- Market conditions: 94 active listings in the ZIP; 3,244 units permitted in Kern County in 2024 (73 in 5+ unit buildings).
Forward outlook
- In year one you build about $7k of equity ($481 loan paydown + $7k appreciation (10.0% local appreciation)).
- Kern County population projected at +17% by 2050 — long-run rental-demand tailwind backs the buy-and-hold thesis.
- At projected returns (10.0% appreciation + 3.0% rent growth), your $19k cash investment doubles in ~2 years — after that, you're playing with house money.
- By year 5, paydown + projected appreciation supports a ~$35k cash-out refi (75% LTV) — recoverable capital for the next deal without selling this one.
Negotiation context
- It's been on market 173 days — a 12% lower offer ($61k) is reasonable based on typical stale-listing flexibility.
Risks & watch-outs
- Climate carrying-cost: severe wildfire risk; extreme-heat days projected 7→20/yr by 2055 (HVAC capex compounding) — expect insurance premiums to compound above CPI over the hold.
Questions for the listing agent
- It's been on market 173 days. Have you received any prior offers? Is the seller open to a 12% concession, seller financing, or rate buy-down credit?
- Have any recent inspections been done? Can we get a copy of the seller's disclosures and any deferred-maintenance estimates?
- Built in 1965 — when were the roof, HVAC, electrical panel, plumbing, and water heater last replaced?
- Why hasn't it sold? Are there any deal-killer items the seller is aware of (foundation, flood, title, zoning, code violations)?
- Is there a deadline driving the sale (1031 exchange, divorce, estate, relocation)? That informs how much negotiation room exists.
- Schools are F-rated, which usually means shorter tenancies and higher turnover. Who's the typical renter profile here, and what's been the actual vacancy rate?
- What's the average days-on-market for RENTAL listings here right now (not sales)? A rising rental-DOM trend means longer vacancies and softer asking-rent achievability than the comps imply.
- What's the recent tenant-quality profile in this submarket — average credit score on applications, eviction rate, late-payment / NSF rate, and stable-employment percentage? A property-management company in the area should have these aggregated.
- How much new for-sale + rental construction is in the pipeline within 1–3 miles? Heavy new supply typically softens prices + rents 12–24 months out; constrained supply supports both.
Investment metrics
- 1% rule
- 1.43% ✓
- Cap rate
- 11.60%
- Cash-on-cash
- 18.94%
- DSCR
- 1.84
- GRM
- 5.8
CMA / ARV
- ARV (median comp)
- $112,825
- List price
- $69,500
- Delta
- -38.40%
- Verdict
- UNDERPRICED
- Comps
- 20 within 1.0 mi
Show comp detail 6 sales within ~0.75 mi
| Address | Dist | Beds/Ba | Sqft | Sold | Price | $/sf | Match |
|---|---|---|---|---|---|---|---|
| 5 Patricia Ln | 0.21mi | 2/2.0 | 960 (+7%) | 7mo | $57,500 | $60 | 69 |
| 35 E Evans Rd #56 | 0.64mi | 2/2.0 | 1,000 (+11%) | 2mo | $39,000 | $39 | 46 |
| 1040 Evans Rd Unit B2 | 0.66mi | 2/1.0 | 840 (-7%) | 21mo | $28,500 | $34 | 41 |
| 168 Merrill Rd | 0.60mi | 1/1.0 (-1) | 776 (-14%) | 9mo | $92,500 | $119 | 37 |
| 1042 Evans Rd #2 | 0.74mi | 2/1.0 | 992 (+10%) | 16mo | $46,900 | $47 | 35 |
| 108 Pinewood Dr | 0.69mi | 2/1.0 | 800 (-11%) | 18mo | $50,000 | $63 | 34 |
Match score weights: distance 35% · size 25% · config 20% · recency 20%. Top-matched comps best support the ARV.
Projected returns pro-forma
10.0% appreciation · 3.0% rent growth · sell at horizon
- IRR
- 38.4%
- Equity multiple
- 3.95×
- Total profit
- $57,429
- Equity at exit
- $62,611
- IRR
- 33.1%
- Equity multiple
- 8.90×
- Total profit
- $153,765
- Equity at exit
- $135,023
Cash invested: $19,460 (down + closing). Projections, not guarantees.
Landlord ↔ Tenant lean methodology
- Overall (STATE)
- 18 Strongly Tenant-Friendly
- State California
- 18 Strongly Tenant-Friendly · D+13
- County
- — inherits STATE
- City
- — inherits STATE
ZIP-level market 93285
- Home prices YoY
- 4.8%
- Active inventory
- 94
- Price-to-rent
- 5.8×
Monthly cashflow live
- Estimated rent
- $997 medium interval (Pro) →
- Mortgage (P&I)
- −$364
- Tax est. 1.5%
- −$87 /mo · $1,042/yr
- Insurance
- −$29
- HOA
- −$0
- Vacancy / Maint / Mgmt
- −$209
- Net cashflow
- $307
Break-even live
UW: 25.0% down · 7.5% · 30yr · 1.5% tax · 5.0% vac · 8.0% maint · 8.0% mgmt
Financing live
Cash to close
- Down payment
- $17,375
- Closing costs
- $2,085
- Reserves months
- —
- Total cash needed
- —
Loan-product check · same deal, 3 products live
Conventional
25% down · 7.5% · 30yr
- Down + closing
- —
- Monthly P&I
- —
- Monthly cashflow
- —
- DSCR
- —
- Eligible?
- —
Personal DTI + credit; lowest rate.
DSCR
20% down · 8.5% · 30yr
- Down + closing
- —
- Monthly P&I
- —
- Monthly cashflow
- —
- DSCR
- —
- Eligible?
- —
No personal income docs; deal must DSCR.
Hard money
10% down · 12.0% · 12mo
- Down + closing
- —
- Monthly P&I
- —
- Monthly cashflow
- —
- DSCR
- —
- Eligible?
- —
Short-term bridge; refi at stabilization.
Listing history 16 events
-
2026-06-18days on market $69,500 Active 173 DOM
-
2026-06-17days on market $69,500 Active 172 DOM
-
2026-06-16days on market $69,500 Active 171 DOM
-
2026-06-15days on market $69,500 Active 170 DOM
-
2026-06-14days on market $69,500 Active 168 DOM
-
2026-06-13days on market $69,500 Active 167 DOM
-
2026-06-10days on market $69,500 Active 165 DOM
-
2026-06-09days on market $69,500 Active 164 DOM
-
2026-06-08days on market $69,500 Active 163 DOM
-
2026-06-07days on market $69,500 Active 162 DOM
-
2026-06-05days on market $69,500 Active 159 DOM
-
2026-06-03days on market $69,500 Active 158 DOM
-
2026-06-03days on market $69,500 Active 157 DOM
-
2026-06-01days on market $69,500 Active 156 DOM
-
2026-05-31days on market $69,500 Active 155 DOM
-
2025-12-15$74,000 Active
ⓘ Source: listings_history table (triggers on properties + properties_extension) + one-shot
backfill from property_details.listing_events for pre-trigger history.
Climate risk First Street
- Flood 1/10 Low FEMA zone X (unshaded) · 0% chance over 30 yrs
- Wildfire 8/10 Severe
- Heat 6/10 Major 7 d/yr ≥101°F today · 20 d/yr by 30 yrs out
- Wind 1/10 Low
- Air quality 10/10 Extreme 26 unhealthy d/yr today · 33 by 30 yrs out
Nearby sold comps map
Loading sold comps map…
Walkable amenities ~0.75 mi
Loading nearby amenities…
Taxation est. · year 1
- Rental income
- $11,961
- − Mortgage interest
- −$3,893
- − Property taxes
- −$1,042
- − Insurance
- −$348
- − Repairs & maintenance
- −$957
- − Management
- −$957
- − Depreciation
- −$2,022
- Taxable income
- $2,743
- Est. tax owed @ 24.0%
- −$658
- After-tax cash flow
- $3,028/yr
For passive investors: Depreciation is non-cash, so a rental often shows a tax loss while cash-flowing — sheltering income. Rental losses are passive: they offset passive income freely, and up to $25,000/yr can offset ordinary (W-2) income if you actively participate and your MAGI is under $100k (phasing out to $0 by $150k); unused losses carry forward. On sale, claimed depreciation is recaptured at up to 25%, and gains may owe capital-gains tax (a 1031 exchange can defer both). Figures are a year-1 estimate at your 24.0% rate — not tax advice; consult a CPA.
Condition & rehab AI · 2 photos
This singlewide mobile home requires significant repairs and updates to its exterior and interior, including painting and landscaping. While it has a large addition, the overall condition is fair and could be improved with moderate renovations.
Repairs flagged
- Major siding — Significant wear and tear
- Major roof — No visible damage, but the independent image suggests potential wear
- Major flooring — No visible flooring, but the independent image suggests potential wear
- Major interior walls/paint — No visible interior, but the independent image suggests potential wear
- Major systems — No visible systems, but the independent image suggests potential wear
Value-add opportunities
- Both paint exterior — Fresh paint can significantly improve curb appeal and value
- Both landscaping — Well-maintained landscaping can enhance curb appeal and attract potential buyers
Renovation cost estimate screening
| Repair item | Severity | Est. cost |
|---|---|---|
| siding · Significant wear and tear | Major | $15,000–50,000 |
| roof · No visible damage, but the independent image suggests potential wear | Major | $15,000–50,000 |
| flooring · No visible flooring, but the independent image suggests potential wear | Major | $15,000–50,000 |
| interior walls/paint · No visible interior, but the independent image suggests potential wear | Major | $15,000–50,000 |
| systems · No visible systems, but the independent image suggests potential wear | Major | $15,000–50,000 |
| Total estimated repair cost · 5 items | $75,000–250,000 |
Value-add ROI direction
- Both paint exterior — Fresh paint can significantly improve curb appeal and value ↑
- Both landscaping — Well-maintained landscaping can enhance curb appeal and attract potential buyers ↑
ⓘ Cost ranges are severity-bucket heuristics (US national rule-of-thumb). Get contractor quotes + a written scope before underwriting a rehab budget.
Schools (NCES district)
- District
- Kernville Union Elementary
- NCES district ID
- 0619590
- Math proficiency
- 20% ▲ 4.00%
- Reading proficiency
- 37% ▲ 11.00%
- Median HH income
- $29,896
- Composite
- 25.91/100
- National rank
- #12766
- State rank
- #1128 of 1400 in CA
Livability — Wofford Heights
- Score
- 45/100
- State rank
- #1317
- US rank
- #26674
Category grades
Schools grade is shown separately in the Schools card above.
Census & demographics
- Census place
- Wofford Heights, CA
- Population (ZIP)
- 2,415
Population outlook (Kern County) Hauer SSP2
- Today (2025)
- 947,286 people
- By 2030
- 978,984 · +3.3%
- By 2040
- 1,045,018 · +10.3%
- By 2050
- 1,105,232 · +16.7%
- By 2075
- 1,229,538 · +29.8%
- By 2100
- 1,238,059 · +30.7%
Race, ethnicity, and origin ACS 2023
- Neighborhood character
- Predominantly White (80%)
- Race & ethnicity
- White 80% Hispanic / Latino 19% Two or more races 6%
- Hispanic origin (detail)
- Mexican 17%
- Common ancestry
- Romanian 4% Subsaharan African 4% Iranian 2%
- Foreign-born
- 8% · Canada
- Languages at home
- 78% English-only · Spanish 15% Russian/Polish/Slavic 8%
Political lean MEDSL · Kern
- 2024 margin
- Strong R (+21.1) · D 38.2% · R 59.3% · Other 2.5%
- 2008→2024 swing
- -3.3pp toward R · 2008: -17.8pp · 2024: -21.1pp
- All cycles
- 2024: R+21.1 2020: R+10.2 2016: R+15.0 2012: R+20.9 2008: R+17.8
Not yet ingested
- Civics
- —
Market trends
- HPI YoY
- ▲ 12.11%
- Current HPI
- 264.1726
- Rent YoY
- —
- Metro
- —
- State GDP YoY
- ▲ 3.21%
- F500 in state
- 116
Industry mix (Fortune 500 HQ in CA)
| Industry | F500 HQs | Revenue |
|---|---|---|
| Technology | 27 | $1,492B |
|
||
| Financial Services | 3 | $174B |
|
||
| Retail | 3 | $44B |
|
||
| Insurance | 3 | $26B |
|
||
| Media / Entertainment | 2 | $115B |
|
||
| Pharmaceuticals / Biotech | 2 | $62B |
|
||
Price history
1 event — show timeline
- 2025-12-15 Listed $74,000 SSMLS
Cash-flow waterfall
monthlySold comps — $/sqft
last 12 mo · ≤1 miLoading sold comps…