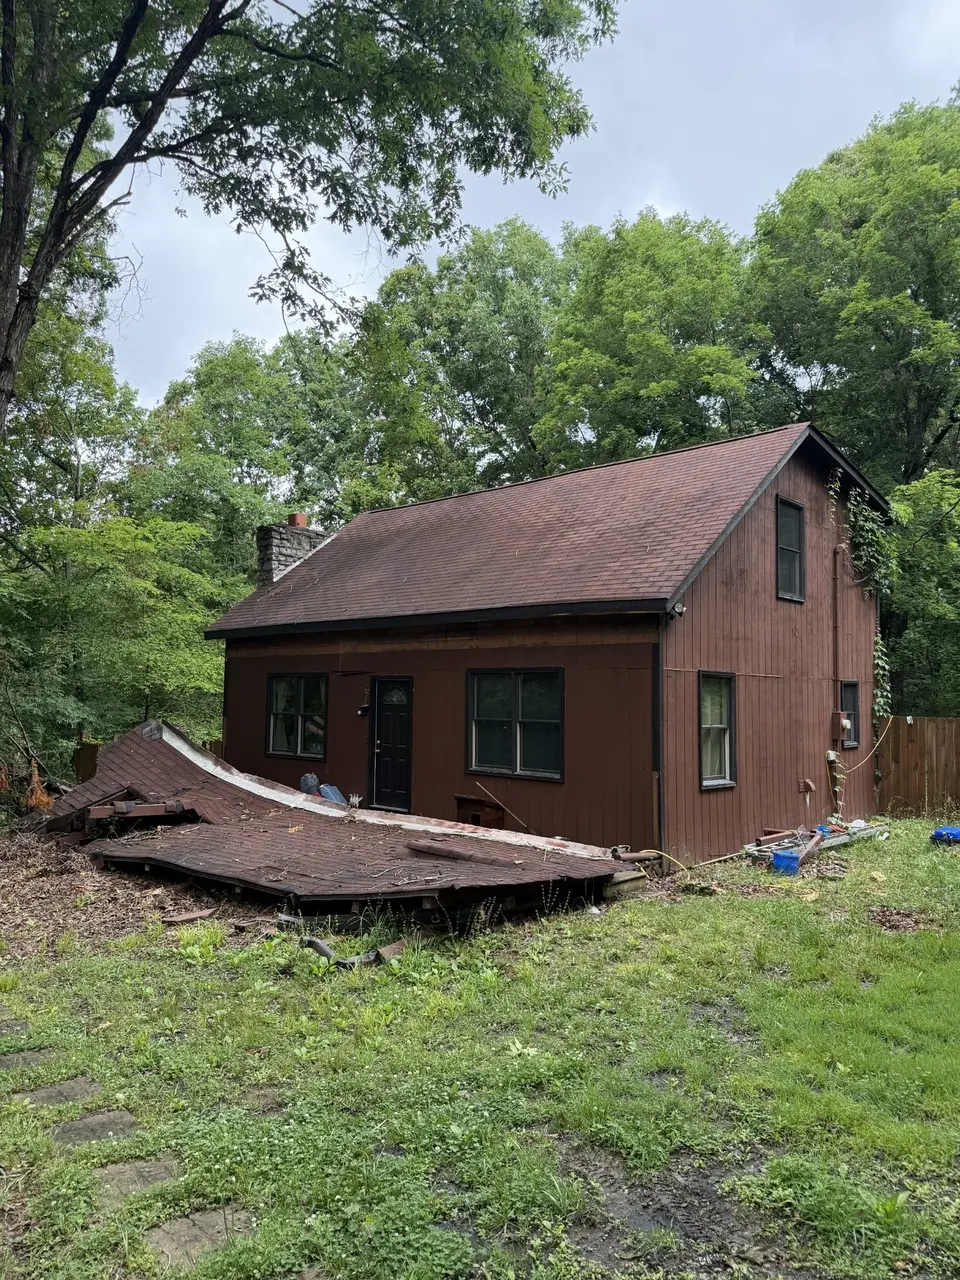
1955 Highway 49 E · Charlotte, TN
Flood risk 1/10 · Minimal
- FEMA flood zone
- X (unshaded)
- Chance of flooding over 30 yrs
- 0.0%
- Est. flood insurance / yr
- $507 – $1,088
Fire risk 4/10 · Minor
- Est. fire insurance / yr
- $949 – $1,763
Heat risk 5/10 · Moderate
- Hot days now (above 109°F)
- 7 days/yr
- Hot days in 30 yrs
- 19 days/yr
Wind risk 4/10 · Minor
- Chance of severe wind over 30 yrs
- 10.0%
Air-quality risk 2/10 · Minimal
- Unhealthy air days now
- 0 days/yr
- Unhealthy air days in 30 yrs
- 1 days/yr
Risk factors via First Street. Map © Google.
Why this score? — see what drove the B+ grade
The composite is a weighted blend of 9 inputs, each scored 0–100. Each bar is that input's sub-score; the figure is the points it added to the 100-point composite (weight × sub-score).
- Cash flow +27.7/30.0
- ARV discount +15.0/15.0
- Appreciation +10.0/10.0
- DSCR +9.7/10.0
- 1% rule +6.5/10.0
- Livability +3.2/5.0
- Schools +2.7/10.0
- Rent growth +2.5/5.0
- Condition / age +2.5/5.0
$149,900
🖨 Deal sheet (PDF) 📄 Offer letter ✓ Due diligence
Listing remarks MLS
Vacation at home** cute cabin style home on wooded lot** loft** Open floor plan with Rock firepleace** 2 BR's** Washer/Dryer stays*** nice level wooded lot*
Key facts
- Plenty of storage
- Large backyard shed
- 1 acre lot
Tags
Property features AI
Finance
- Other: Property sits on approximately 1 acre
- HOA & community: Pets allowed
Exterior
- Utilities: Public water; Septic tank sewer; Electricity available
- Home design: Single-family residence; One story
- Construction: Wood siding
- Exterior features: Covered porch
Interior
- Kitchen: Refrigerator included
- Bedrooms: 2 bedrooms (1 bedroom on the main level); Bedroom sizes approximately 18 x 11 and 11 x 11
- Flooring: Carpet flooring
- Bathrooms: 2 full bathrooms
- Heating & cooling: Central heating (electric); Central air conditioning (electric)
- Interior features: Crawl space basement; Fireplace (1)
Neighborhood map
What this means for you Summary
Snapshot
- This is a 2-bed/2.0-bath single-family listed at $150k.
Deal economics
- At list price, monthly cash flow is $450 ($5k/yr) — positive.
- The deal already cash-flows at list — no discount required.
- Meets the 1% rule at list price ($2k rent vs $150k).
- Recommended offer: $148k (1.5% below list) — sets the bar for market timing.
- Cap rate 9.9% vs local median 2.5% in Charlotte — top-decile yield for the area; either an underpriced asset or a hidden risk that comps aren't pricing in. Stress-test before assuming the spread holds.
Location & tenants
- Location reads 65/100 on livability (#141 in TN) — a middle-class / working-renter tenant base. Strengths: cost of living A+, housing A+, crime B+; Watch: amenities F, commute F, employment D-.
- Dickson County (rural): math 30% / reading 33% proficiency, ranked #39 of 139 in TN (top 28%) — families likely to look elsewhere, expect single-tenant / working-renter base with shorter leases.
- Zoned schools: Charlotte Elementary (math 32% / reading 30%, grade F, #400 of 952 statewide, top 43%, 616 students, 0% FRL); Charlotte Middle School (math 30% / reading 25%, grade F, #122 of 333 statewide, top 38%, 436 students, 0% FRL); Creek Wood High School (math 22% / reading 39%, grade F, #75 of 332 statewide, top 24%, 933 students, 0% FRL) — zoned schools average 0% FRL vs 45% district-wide (45 pts lower); this property's tenant base skews higher-income than the district average.
- Market conditions: 59 active listings in the ZIP; 376 units permitted in Dickson County in 2024 (5 in 5+ unit buildings).
Forward outlook
- In year one you build about $16k of equity ($1k loan paydown + $15k appreciation (10.0% local appreciation)).
- Dickson County population projected at +7% by 2050 — modest demand growth; plan on rents tracking national, not racing it.
- At projected returns (10.0% appreciation + 3.0% rent growth), your $42k cash investment doubles in ~2 years — after that, you're playing with house money.
- By year 3, paydown + projected appreciation supports a ~$41k cash-out refi (75% LTV) — recoverable capital for the next deal without selling this one.
Negotiation context
- It's been on market 25 days — a 2% lower offer ($148k) is reasonable based on typical stale-listing flexibility.
- 2 sale attempts since 11y ago with the ask held roughly flat each time — persistent listings suggest the price (not the market) is what's stuck; bring a comps-based counter.
- Current owner paid $80k; list at $150k implies a 87% gain — meaningful room to come down on a strong offer.
Risks & watch-outs
- Climate carrying-cost: extreme-heat days projected 7→19/yr by 2055 (HVAC capex compounding) — expect insurance premiums to compound above CPI over the hold.
Questions for the listing agent
- Is there a deadline driving the sale (1031 exchange, divorce, estate, relocation)? That informs how much negotiation room exists.
- Schools are D-rated, which usually means shorter tenancies and higher turnover. Who's the typical renter profile here, and what's been the actual vacancy rate?
- What's the average days-on-market for RENTAL listings here right now (not sales)? A rising rental-DOM trend means longer vacancies and softer asking-rent achievability than the comps imply.
- What's the recent tenant-quality profile in this submarket — average credit score on applications, eviction rate, late-payment / NSF rate, and stable-employment percentage? A property-management company in the area should have these aggregated.
- How much new for-sale + rental construction is in the pipeline within 1–3 miles? Heavy new supply typically softens prices + rents 12–24 months out; constrained supply supports both.
Investment metrics
- 1% rule
- 1.15% ✓
- Cap rate
- 9.90%
- Cash-on-cash
- 12.87%
- DSCR
- 1.57
- GRM
- 7.3
CMA / ARV
- ARV (on-the-fly)
- $278,983
- Comps found
- 2
Show comp detail 2 sales within ~0.75 mi
| Address | Dist | Beds/Ba | Sqft | Sold | Price | $/sf | Match |
|---|---|---|---|---|---|---|---|
| 2027 Highway 49 E | 0.15mi | 3/2.0 (+1) | 1,264 (+3%) | 18mo | $257,000 | $203 | 68 |
| 185 B Y Brown Rd | 0.49mi | 3/1.5 (+1) | 1,098 (-11%) | 15mo | $248,900 | $227 | 40 |
Match score weights: distance 35% · size 25% · config 20% · recency 20%. Top-matched comps best support the ARV.
Projected returns pro-forma
10.0% appreciation · 3.0% rent growth · sell at horizon
- IRR
- 33.7%
- Equity multiple
- 3.63×
- Total profit
- $110,255
- Equity at exit
- $135,042
- IRR
- 29.1%
- Equity multiple
- 8.20×
- Total profit
- $302,039
- Equity at exit
- $291,223
Cash invested: $41,972 (down + closing). Projections, not guarantees.
Landlord ↔ Tenant lean methodology
- Overall (STATE)
- 87 Strongly Landlord-Friendly
- State Tennessee
- 87 Strongly Landlord-Friendly · R+13
- County
- — inherits STATE
- City
- — inherits STATE
ZIP-level market 37036
- Home prices YoY
- 11.6%
- Active inventory
- 59
- Price-to-rent
- 7.3×
Monthly cashflow live
- Estimated rent
- $1,722 medium interval (Pro) →
- Mortgage (P&I)
- −$786
- Tax from tax record
- −$62 /mo · $742/yr
- Insurance
- −$62
- HOA
- −$0
- Vacancy / Maint / Mgmt
- −$362
- Net cashflow
- $450
Break-even live
Sensitivity live
| Price | -10% $535 | -5% $493 | +0% $450 | +5% $408 | +10% $365 |
|---|---|---|---|---|---|
| Rent | -10% $314 | -5% $382 | +0% $450 | +5% $518 | +10% $586 |
| Rate | -1.0pp $526 | -0.5pp $488 | base $450 | +0.5pp $411 | +1.0pp $372 |
UW: 25.0% down · 7.5% · 30yr · 1.5% tax · 5.0% vac · 8.0% maint · 8.0% mgmt
Financing live
Cash to close
- Down payment
- $37,475
- Closing costs
- $4,497
- Reserves months
- —
- Total cash needed
- —
Loan-product check · same deal, 3 products live
Conventional
25% down · 7.5% · 30yr
- Down + closing
- —
- Monthly P&I
- —
- Monthly cashflow
- —
- DSCR
- —
- Eligible?
- —
Personal DTI + credit; lowest rate.
DSCR
20% down · 8.5% · 30yr
- Down + closing
- —
- Monthly P&I
- —
- Monthly cashflow
- —
- DSCR
- —
- Eligible?
- —
No personal income docs; deal must DSCR.
Hard money
10% down · 12.0% · 12mo
- Down + closing
- —
- Monthly P&I
- —
- Monthly cashflow
- —
- DSCR
- —
- Eligible?
- —
Short-term bridge; refi at stabilization.
Listing history 20 events
-
2026-06-21days on market $149,900 Active 25 DOM
-
2026-06-18days on market $149,900 Active 22 DOM
-
2026-06-17days on market $149,900 Active 21 DOM
-
2026-06-16days on market $149,900 Active 20 DOM
-
2026-06-15days on market $149,900 Active 19 DOM
-
2026-06-13days on market $149,900 Active 17 DOM
-
2026-06-13days on market $149,900 Active 16 DOM
-
2026-06-09days on market $149,900 Active 13 DOM
-
2026-06-08days on market $149,900 Active 12 DOM
-
2026-06-07days on market $149,900 Active 11 DOM
-
2026-06-05days on market $149,900 Active 8 DOM
-
2026-06-03days on market $149,900 Active 7 DOM
-
2026-06-02days on market $149,900 Active 6 DOM
-
2026-06-01days on market $149,900 Active 5 DOM
-
2026-05-31days on market $149,900 Active 4 DOM
-
2026-05-27$149,900 Active
-
2015-07-24soldstatus $80,000
-
2015-07-23status Pending 156-char remark
Show marketing remark (156 chars)
Vacation at home** cute cabin style home on wooded lot** loft** Open floor plan with Rock firepleace** 2 BR's** Washer/Dryer stays*** nice level wooded lot*
-
2015-07-23soldstatus $80,000 Closed 156-char remark
Show marketing remark (156 chars)
Vacation at home** cute cabin style home on wooded lot** loft** Open floor plan with Rock firepleace** 2 BR's** Washer/Dryer stays*** nice level wooded lot*
-
2015-06-16$98,000 Active 156-char remark
Show marketing remark (156 chars)
Vacation at home** cute cabin style home on wooded lot** loft** Open floor plan with Rock firepleace** 2 BR's** Washer/Dryer stays*** nice level wooded lot*
ⓘ Source: listings_history table (triggers on properties + properties_extension) + one-shot
backfill from property_details.listing_events for pre-trigger history.
Tax reassessment forecast TN · Resets to sale price
- Current annual tax
- $742 · $62/mo
- Projected year-2 tax
- $1,064 · $89/mo
- Expected delta
- +$322/yr (+$27/mo · 43.4%)
ⓘ Screening estimate from a state-policy table — verify with the county assessor before closing.
Climate risk First Street
- Flood 1/10 Low FEMA zone X (unshaded) · 0% chance over 30 yrs
- Wildfire 4/10 Moderate
- Heat 5/10 Major 7 d/yr ≥109°F today · 19 d/yr by 30 yrs out
- Wind 4/10 Moderate 10% chance of damaging wind over 30 yrs
- Air quality 2/10 Low 0 unhealthy d/yr today · 1 by 30 yrs out
Nearby sold comps map
Loading sold comps map…
Walkable amenities ~0.75 mi
Loading nearby amenities…
Taxation est. · year 1
- Rental income
- $20,666
- − Mortgage interest
- −$8,397
- − Property taxes
- −$742
- − Insurance
- −$750
- − Repairs & maintenance
- −$1,653
- − Management
- −$1,653
- − Depreciation
- −$4,361
- Taxable income
- $3,110
- Est. tax owed @ 24.0%
- −$746
- After-tax cash flow
- $4,655/yr
For passive investors: Depreciation is non-cash, so a rental often shows a tax loss while cash-flowing — sheltering income. Rental losses are passive: they offset passive income freely, and up to $25,000/yr can offset ordinary (W-2) income if you actively participate and your MAGI is under $100k (phasing out to $0 by $150k); unused losses carry forward. On sale, claimed depreciation is recaptured at up to 25%, and gains may owe capital-gains tax (a 1031 exchange can defer both). Figures are a year-1 estimate at your 24.0% rate — not tax advice; consult a CPA.
Schools (NCES district)
- District
- Dickson County
- NCES district ID
- 4701020
- Math proficiency
- 30% ▼ -15.00%
- Reading proficiency
- 33% ▼ -6.00%
- Median HH income
- $45,458
- Composite
- 27.01/100
- National rank
- #7064
- State rank
- #39 of 139 in TN
Livability — Charlotte
- Score
- 65/100
- State rank
- #141
- US rank
- #12873
Category grades
Schools grade is shown separately in the Schools card above.
Census & demographics
- Population (ZIP)
- 6,653
Population outlook (Dickson County) Hauer SSP2
- Today (2025)
- 55,013 people
- By 2030
- 56,448 · +2.6%
- By 2040
- 58,508 · +6.4%
- By 2050
- 59,076 · +7.4%
- By 2075
- 58,343 · +6.1%
- By 2100
- 52,900 · -3.8%
Race, ethnicity, and origin ACS 2023
- Neighborhood character
- Predominantly White (88%)
- Race & ethnicity
- White 88% Two or more races 5% Hispanic / Latino 3% Black 3%
- Common ancestry
- Serbian 3% Italian 2% Iranian 2%
- Foreign-born
- 0%
- Languages at home
- 99% English-only · Spanish 1%
Political lean MEDSL · Dickson
- 2024 margin
- Solid R (+51.9) · D 23.5% · R 75.4% · Other 1.1%
- 2008→2024 swing
- -30.6pp toward R · 2008: -21.4pp · 2024: -51.9pp
- All cycles
- 2024: R+51.9 2020: R+47.4 2016: R+45.6 2012: R+28.4 2008: R+21.4
Not yet ingested
- Civics
- —
Market trends
- HPI YoY
- ▲ 38.51%
- Current HPI
- 369.6328
- Rent YoY
- —
- Metro
- —
- State GDP YoY
- ▲ 2.78%
- F500 in state
- 22
Industry mix (Fortune 500 HQ in TN)
| Industry | F500 HQs | Revenue |
|---|---|---|
| Healthcare | 3 | $91B |
|
||
| Retail | 3 | $72B |
|
||
| Transportation / Logistics | 1 | $88B |
|
||
| Paper / Packaging | 1 | $19B |
|
||
| Insurance | 1 | $13B |
|
||
| Energy | 1 | $12B |
|
||
Price history
+53.0% since first listed5 events — show timeline
- 2026-05-27 Listed $149,900 REALTRACS as Distributed by MLS Grid
- 2015-07-24 Sold (Public Records) $80,000 Public Records
- 2015-07-23 Pending — REALTRACS as Distributed by MLS Grid
- 2015-07-23 Sold (MLS) $80,000 REALTRACS as Distributed by MLS Grid
- 2015-06-16 Listed $98,000 REALTRACS as Distributed by MLS Grid
Property tax history
+3.3%/yrLatest (2025): $742 · +0.0% YoY. Source: county tax records.
Cash-flow waterfall
monthlySold comps — $/sqft
last 12 mo · ≤1 miLoading sold comps…