 🌊 Lakefront
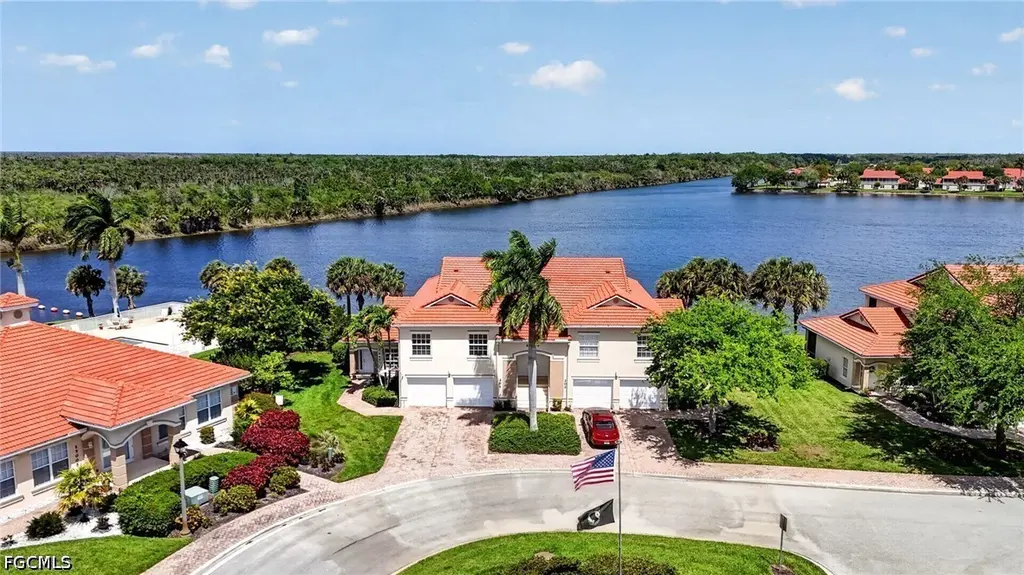
25009 Peacock Ln Unit 1-201 · Goodland, FL
Flood risk 9/10 · Severe
- FEMA flood zone
- AE
- Chance of flooding over 30 yrs
- 0.99%
- Est. flood insurance / yr
- $1,737 – $8,500
Fire risk 6/10 · Moderate
- Est. fire insurance / yr
- $947 – $1,759
Heat risk 10/10 · Severe
- Hot days now (above 109°F)
- 7 days/yr
- Hot days in 30 yrs
- 26 days/yr
Wind risk 10/10 · Severe
- Chance of severe wind over 30 yrs
- 99.0%
Air-quality risk 3/10 · Minor
- Unhealthy air days now
- 2 days/yr
- Unhealthy air days in 30 yrs
- 2 days/yr
Risk factors via First Street. Map © Google.
Why this score? — see what drove the C+ grade
The composite is a weighted blend of 9 inputs, each scored 0–100. Each bar is that input's sub-score; the figure is the points it added to the 100-point composite (weight × sub-score).
- Cash flow +22.1/30.0
- 1% rule +8.6/10.0
- ARV discount +7.5/15.0
- DSCR +7.1/10.0
- Schools +5.0/10.0
- Appreciation +4.3/10.0
- Condition / age +4.0/5.0
- Rent growth +3.3/5.0
- Livability +2.4/5.0
$249,999
🖨 Deal sheet 📄 Offer letter ✓ Due diligence
Listing remarks
Beautiful 3 bedroom condo on a cul-de-sac overlooking incredible water views, across the street from the Ten Thousand Islands and the Florida Everglades and just minutes from Marco Island. This light and bright unit features high ceilings and an open living and dining area, creating an airy and inviting space. The kitchen offers ample cabinet storage, solid surface countertops, a built in pantry, and appliances including a smooth top stove, microwave, and dishwasher. The spacious primary suite includes a walk in closet, dual vanities with solid surface countertops and a tiled walk in shower. Two additional bedrooms provide flexibility for guest, family, or a home office. Additional highlig
Key facts
- Water views
- Florida everglades
- Ten thousand islands
Tags
Property features AI
Finance
- Financial info: Pets allowed with conditions; contact for details
- HOA & community: Community of 144 units; Homeowners association with $550 monthly fee; HOA covers cable TV, grounds maintenance, pest control, recreation facilities, road maintenance and trash; Community amenities include marina, clubhouse, pool, spa/hot tub, tennis courts and on-site management; Non-gated community
Exterior
- Parking: Attached garage (1 covered space)
- Security: Smoke detector(s)
- Utilities: Public water; Public sewer; Cable available
- Home design: Two-story building; Entry level at 2; Northeast-facing; Resale property
- Construction: Block, concrete and stucco construction; Tile roof
- Exterior features: Patio; Balcony; Security/high impact doors; Community pool; Rectangular lot; Paved road; Southwest exposure; Lakefront; Has view
Interior
- Kitchen: Range; Dishwasher; Refrigerator
- Bedrooms: Includes other room types and a great room
- Flooring: Tile
- Bathrooms: 2 full bathrooms
- Heating & cooling: Central heating (electric); Central air conditioning (electric); Ceiling fan(s)
- Interior features: Sliding and impact glass windows; Dual sinks; Living/dining room; Pantry; Shower-only bathrooms with separate showers; Walk-in closet(s); Unfurnished
- Laundry & utility: Washer; Dryer
Neighborhood map
What this means for you Summary
Snapshot
- This is a 3-bed/2.0-bath condo listed at $250k. Condition is rated good.
Deal economics
- At list price, monthly cash flow is $-26 ($-307/yr) — negative.
- To cash-flow at today's rent, offer at most $246k (1.5% below list).
- Meets the 1% rule at list price ($3k rent vs $250k).
- Recommended offer: $235k (6.0% below list) — sets the bar for market timing.
Location & tenants
- Location reads 47/100 on livability (#893 in FL) — a working-class tenant base; expect higher turnover. Strengths: cost of living A+, crime A; Watch: health & safety D, amenities F, commute F.
- Collier (suburban): math 60% / reading 56% proficiency, ranked #16 of 73 in FL (top 22%) — acceptable for families but not a draw, mixed tenant base, ~2y average lease.
- Market conditions: Rents rising (+3.2%/yr); 900 active listings in the ZIP; solid renter incomes; 3,520 units permitted in Collier County in 2024 (959 in 5+ unit buildings).
- At $3,391/mo this rent would consume 46% of the median local household income ($89k/yr) (locally 550% of renters already pay >50% of income on rent) — very limited rent-growth headroom before tenants either downsize or default.
Forward outlook
- Local home prices are declining (-1.5%/yr); year-one equity from $2k of loan paydown is wiped out by about $4k of value loss. Plan a longer hold.
- Collier County population projected at +30% by 2050 — long-run rental-demand tailwind backs the buy-and-hold thesis.
Negotiation context
- It's been on market 68 days — a 6% lower offer ($235k) is reasonable based on typical stale-listing flexibility.
Risks & watch-outs
- Watch-outs: flood insurance adds $427/mo.
- Climate carrying-cost: in FEMA flood zone AE (mandatory federal flood insurance); severe wind risk, 99% chance of damaging wind over 30y; major wildfire risk; extreme-heat days projected 7→26/yr by 2055 (HVAC capex compounding) — expect insurance premiums to compound above CPI over the hold.
Questions for the listing agent
- What do current leases actually rent for vs. the listed asking? Can we see a recent rent roll and the last 12 months of T-12 income?
- It's been on market 68 days. Have you received any prior offers? Is the seller open to a 6% concession, seller financing, or rate buy-down credit?
- What's the actual annual flood-insurance premium (NFIP or private), and is the property in a SFHA with mandatory coverage?
- What does the HOA fee cover, when was the last increase, and are there any pending special assessments or reserve-fund shortfalls?
- Any open or pending special assessments — roof, HVAC, plumbing, elevator, façade? What's the per-unit balance and payoff schedule, and is the seller paying it off at close or rolling it to the buyer?
- Why hasn't it sold? Are there any deal-killer items the seller is aware of (foundation, flood, title, zoning, code violations)?
- Is there a deadline driving the sale (1031 exchange, divorce, estate, relocation)? That informs how much negotiation room exists.
- This sits on a lake — are riparian / water-frontage rights deeded with the parcel? Any dock permits, shoreline easements, or HOA water-use restrictions?
- What's the documented flood / surge / shoreline-erosion history here (FEMA AND non-FEMA — e.g., storm surge, creek backup, septic-field saturation)?
- Any water-quality or seasonal algae-bloom issues that affect tenant satisfaction or short-term-rental demand?
- What's the average days-on-market for RENTAL listings here right now (not sales)? A rising rental-DOM trend means longer vacancies and softer asking-rent achievability than the comps imply.
- What's the recent tenant-quality profile in this submarket — average credit score on applications, eviction rate, late-payment / NSF rate, and stable-employment percentage? A property-management company in the area should have these aggregated.
- How much new apartment / multifamily construction is in the pipeline within 1–3 miles? Heavy new supply (>2% of stock underway) typically softens rents 12–24 months out; light construction supports rent growth.
Investment metrics
- 1% rule
- 1.36% ✓
- Cap rate
- 8.22%
- Cash-on-cash
- 6.87%
- DSCR
- 1.31
- GRM
- 6.1
CMA / ARV
No comps found within radius.
Projected returns pro-forma
-1.48% appreciation · 3.21% rent growth · sell at horizon
- IRR
- -8.3%
- Equity multiple
- 0.65×
- Total profit
- $-24,460
- Equity at exit
- $54,628
- IRR
- -0.5%
- Equity multiple
- 0.96×
- Total profit
- $-2,851
- Equity at exit
- $52,622
Cash invested: $70,000 (down + closing). Projections, not guarantees.
Landlord ↔ Tenant lean methodology
- Overall (STATE)
- 87 Strongly Landlord-Friendly
- State Florida
- 87 Strongly Landlord-Friendly · R+3
- County
- — inherits STATE
- City
- — inherits STATE
ZIP-level market 34114
- Home prices YoY
- -0.6%
- Rents YoY
- 3.2%
- Active inventory
- 900
- Price-to-rent
- 6.1×
Monthly cashflow live
- Estimated rent
- $3,391 medium interval (Pro) →
- Mortgage (P&I)
- −$1,311
- Tax est. 1.5%
- −$312 /mo · $3,750/yr
- Insurance
- −$104
- Flood insurance flood zone
- −$427 /mo · $5,118/yr
- HOA
- −$550
- Vacancy / Maint / Mgmt
- −$712
- Net cashflow
- $-26
Break-even live
UW: 25.0% down · 7.5% · 30yr · 1.5% tax · 5.0% vac · 8.0% maint · 8.0% mgmt
Financing live
Cash to close
- Down payment
- $62,500
- Closing costs
- $7,500
- Reserves months
- —
- Total cash needed
- —
Loan-product check · same deal, 3 products live
Conventional
25% down · 7.5% · 30yr
- Down + closing
- —
- Monthly P&I
- —
- Monthly cashflow
- —
- DSCR
- —
- Eligible?
- —
Personal DTI + credit; lowest rate.
DSCR
20% down · 8.5% · 30yr
- Down + closing
- —
- Monthly P&I
- —
- Monthly cashflow
- —
- DSCR
- —
- Eligible?
- —
No personal income docs; deal must DSCR.
Hard money
10% down · 12.0% · 12mo
- Down + closing
- —
- Monthly P&I
- —
- Monthly cashflow
- —
- DSCR
- —
- Eligible?
- —
Short-term bridge; refi at stabilization.
HOA detail condo
- Monthly dues
- $550 · $6,600/yr
- Likely covers
- water
- Assessments
- None detected in remarks — confirm with the listing agent.
Listing history 17 events
-
2026-06-18days on market $249,999 Active 68 DOM
-
2026-06-17days on market $249,999 Active 67 DOM
-
2026-06-16days on market $249,999 Active 66 DOM
-
2026-06-15days on market $249,999 Active 65 DOM
-
2026-06-14days on market $249,999 Active 63 DOM
-
2026-06-10days on market $249,999 Active 60 DOM
-
2026-06-09days on market $249,999 Active 59 DOM
-
2026-06-08days on market $249,999 Active 58 DOM
-
2026-06-07days on market $249,999 Active 57 DOM
-
2026-06-03pricedays on market $249,999 Active 53 DOM
-
2026-06-02days on market $257,300 Active 52 DOM
-
2026-06-01days on market $257,300 Active 51 DOM
-
2026-05-31days on market $257,300 Active 50 DOM
-
2026-05-30days on market $257,300 Active 49 DOM
-
2026-05-05price $257,300
-
2026-04-27price $258,900
-
2026-04-06$259,900 Active
ⓘ Source: listings_history table (triggers on properties + properties_extension) + one-shot
backfill from property_details.listing_events for pre-trigger history.
Climate risk First Street
- Flood 9/10 Extreme FEMA zone AE · 99% chance over 30 yrs
- Wildfire 6/10 Major
- Heat 10/10 Extreme 7 d/yr ≥109°F today · 26 d/yr by 30 yrs out
- Wind 10/10 Extreme 99% chance of damaging wind over 30 yrs
- Air quality 3/10 Moderate 2 unhealthy d/yr today · 2 by 30 yrs out
Nearby sold comps map
Loading sold comps map…
Walkable amenities ~0.75 mi
Loading nearby amenities…
Taxation est. · year 1
- Rental income
- $40,688
- − Mortgage interest
- −$14,004
- − Property taxes
- −$3,750
- − Insurance
- −$6,368
- − Repairs & maintenance
- −$3,255
- − Management
- −$3,255
- − HOA
- −$6,600
- − Depreciation
- −$7,273
- Taxable loss
- −$3,817
- Est. tax savings @ 24.0%
- +$916
- After-tax cash flow
- $609/yr
For passive investors: Depreciation is non-cash, so a rental often shows a tax loss while cash-flowing — sheltering income. Rental losses are passive: they offset passive income freely, and up to $25,000/yr can offset ordinary (W-2) income if you actively participate and your MAGI is under $100k (phasing out to $0 by $150k); unused losses carry forward. On sale, claimed depreciation is recaptured at up to 25%, and gains may owe capital-gains tax (a 1031 exchange can defer both). Figures are a year-1 estimate at your 24.0% rate — not tax advice; consult a CPA.
Condition & rehab AI · 12 photos
This well-maintained, light and bright 3-bedroom condo offers beautiful water views and is in good condition with minimal repairs needed.
Value-add opportunities
- Both Painting — Fresh paint can enhance curb appeal and interior aesthetics
- Both Flooring — New flooring can improve the look and feel of the living spaces
- Both Landscaping — Well-maintained landscaping can increase curb appeal and property value
Renovation cost estimate screening
Value-add ROI direction
- Both Painting — Fresh paint can enhance curb appeal and interior aesthetics ↑
- Both Flooring — New flooring can improve the look and feel of the living spaces ↑
- Both Landscaping — Well-maintained landscaping can increase curb appeal and property value ↑
ⓘ Cost ranges are severity-bucket heuristics (US national rule-of-thumb). Get contractor quotes + a written scope before underwriting a rehab budget.
Schools (NCES district)
- District
- Collier
- NCES district ID
- 1200330
- Math proficiency
- 60% ▼ -4.00%
- Reading proficiency
- 56% ▼ -2.00%
- Median HH income
- $58,275
- Composite
- 50.23/100
- National rank
- #1892
- State rank
- #16 of 73 in FL
Livability — Goodland
- Score
- 47/100
- State rank
- #893
- US rank
- #26197
Category grades
Schools grade is shown separately in the Schools card above.
Census & demographics
- County
- Collier County · 396,295 people
- Metro
- Naples-Marco Island, FL
- Population (ZIP)
- 23,559
- Household income
- $89,334
- Rent vs Own
- Severe rent burden
- 550.0
Population outlook (Collier County) Hauer SSP2
- Today (2025)
- 420,858 people
- By 2030
- 450,054 · +6.9%
- By 2040
- 502,232 · +19.3%
- By 2050
- 544,932 · +29.5%
- By 2075
- 627,203 · +49.0%
- By 2100
- 659,015 · +56.6%
Race, ethnicity, and origin ACS 2023
- Neighborhood character
- Predominantly White (72%)
- Race & ethnicity
- White 72% Hispanic / Latino 17% Two or more races 13% Black 7%
- Hispanic origin (detail)
- Mexican 7% Puerto Rican 1% Cuban 3%
- Common ancestry
- Hispanic 5% Romanian 4% Lithuanian 1%
- Foreign-born
- 21% · Canada, Jamaica
- Languages at home
- 75% English-only · Spanish 15% French/Haitian/Cajun 5% Other Indo-European 4%
Political lean MEDSL · Collier
- 2024 margin
- Solid R (+33.1) · D 33.1% · R 66.2%
- 2008→2024 swing
- -10.6pp toward R · 2008: -22.5pp · 2024: -33.1pp
- All cycles
- 2024: R+33.1 2020: R+24.7 2016: R+26.0 2012: R+30.1 2008: R+22.5
Not yet ingested
- Civics
- —
Market trends
- HPI YoY
- ▼ -1.48%
- Current HPI
- 266.5545
- Rent YoY
- ▲ 3.21%
- Metro
- Naples-Marco Island, FL
- State GDP YoY
- ▲ 3.28%
- F500 in state
- 36
Industry mix (Fortune 500 HQ in FL)
| Industry | F500 HQs | Revenue |
|---|---|---|
| Industrial Technology | 2 | $29B |
|
||
| Insurance | 2 | $17B |
|
||
| Retail | 1 | $60B |
|
||
| Technology Distribution | 1 | $58B |
|
||
| Homebuilding | 1 | $35B |
|
||
| Technology Manufacturing | 1 | $35B |
|
||
Price history
-1.0% since first listed3 events — show timeline
- 2026-05-05 Price Changed $257,300 FORTMLS
- 2026-04-27 Price Changed $258,900 FORTMLS
- 2026-04-06 Listed $259,900 FORTMLS
Cash-flow waterfall
monthlySold comps — $/sqft
last 12 mo · ≤1 miLoading sold comps…