220 Henley Park Ln · Big Sandy, TN
Flood risk 7/10 · Major
- FEMA flood zone
- X (unshaded)
- Chance of flooding over 30 yrs
- 0.99%
- Est. flood insurance / yr
- $507 – $1,088
Fire risk 4/10 · Minor
- Est. fire insurance / yr
- $949 – $1,763
Heat risk 5/10 · Moderate
- Hot days now (above 109°F)
- 7 days/yr
- Hot days in 30 yrs
- 20 days/yr
Wind risk 4/10 · Minor
- Chance of severe wind over 30 yrs
- 9.0%
Air-quality risk 1/10 · Minimal
- Unhealthy air days now
- 0 days/yr
- Unhealthy air days in 30 yrs
- 0 days/yr
Risk factors via First Street. Map © Google.
Why this score? — see what drove the C- grade
The composite is a weighted blend of 9 inputs, each scored 0–100. Each bar is that input's sub-score; the figure is the points it added to the 100-point composite (weight × sub-score).
- Cash flow +15.0/30.0
- Appreciation +8.0/10.0
- ARV discount +7.5/15.0
- 1% rule +5.0/10.0
- DSCR +5.0/10.0
- Livability +2.9/5.0
- Rent growth +2.5/5.0
- Condition / age +2.5/5.0
- Schools +2.4/10.0
$18,500
🖨 Deal sheet 📄 Offer letter ✓ Due diligence
Listing remarks
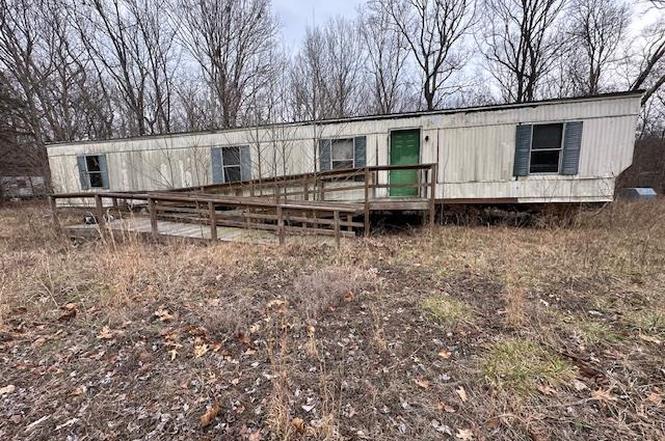
Incredible Value-Add Opportunity – Investor Special / Country Living Potential! Unlimited possibilities await! Whether you're an investor, handyman, flipper, landlord, or someone looking for affordable living with room to personalize — this property deserves a look. 1989 Single-Wide Home – 2 Bed / 2 Bath Handicap Accessible Front & Rear Entrances High-Speed Fiber-Optic Internet Available Electric Pole Already at Property Line Additional Structure Included – Extra Opportunity! Strong Potential for Renovation, Rental, Expansion, or Redevelopment. Bring your creativity and vision to transform this property into something special. Features comfortable layout, acc
Key facts
- 0.23 acre lot
- Built 1989
- Listed 114 days
Property features AI
Exterior
- Parking: Open parking with gravel surface
- Utilities: No public water source; Sewer: other
- Home design: Residential mobile home (single wide); Road frontage: gravel; Lot approximately 0.23 acres (100 x 100), zoned R
- Construction: Metal siding; Pillar/post/pier foundation
- Exterior features: Front porch; Creek on the property; No fencing
Interior
- Kitchen: Refrigerator
- Bedrooms: 2 bedrooms on the main level
- Flooring: Vinyl flooring
- Bathrooms: 2 full bathrooms
- Heating & cooling: Has heating (type: other); Has cooling (type: other)
- Interior features: Refrigerator included; Basement present; Accessible approach with ramp
- Laundry & utility: Laundry on the main level
Neighborhood map
What this means for you Summary
Snapshot
- This is a 2-bed/1.0-bath single-family listed at $18k.
Deal economics
- At list price, monthly cash flow is $655 ($8k/yr) — positive.
- The deal already cash-flows at list — no discount required.
- Meets the 1% rule at list price ($1k rent vs $18k).
- Recommended offer: $17k (9.0% below list) — sets the bar for market timing.
Location & tenants
- Location reads 58/100 on livability (#315 in TN) — a working-class tenant base; expect higher turnover. Strengths: cost of living A+, housing A-; Watch: crime F, amenities F, commute F.
- Benton County (town): math 31% / reading 28% proficiency, ranked #66 of 139 in TN (top 48%) — low school quality limits family demand, transient renter base, plan for 1-2y turnover.
- Zoned schools: Camden Central High School (math 8% / reading 37%, grade F, #156 of 332 statewide, top 49%, 521 students, 0% FRL) — zoned schools average 0% FRL vs 54% district-wide (54 pts lower); this property's tenant base skews higher-income than the district average.
- Market conditions: 93 active listings in the ZIP; 6 units permitted in Benton County in 2024 (0 in 5+ unit buildings).
Forward outlook
- In year one you build about $1k of equity ($128 loan paydown + $1k appreciation (6.0% local appreciation)).
- Benton County population projected at -18% by 2050 — secular population decline; favor cash flow + early exit over multi-decade hold.
- At projected returns (6.0% appreciation + 3.0% rent growth), your $5k cash investment doubles in ~1 year — after that, you're playing with house money.
Negotiation context
- It's been on market 115 days — a 9% lower offer ($17k) is reasonable based on typical stale-listing flexibility.
- Current owner paid $5k; list at $18k implies a 237% gain — meaningful room to come down on a strong offer.
Risks & watch-outs
- Watch-outs: flood insurance adds $66/mo.
- Climate carrying-cost: major flood risk; extreme-heat days projected 7→20/yr by 2055 (HVAC capex compounding) — expect insurance premiums to compound above CPI over the hold.
Questions for the listing agent
- It's been on market 115 days. Have you received any prior offers? Is the seller open to a 9% concession, seller financing, or rate buy-down credit?
- What's the actual annual flood-insurance premium (NFIP or private), and is the property in a SFHA with mandatory coverage?
- Why hasn't it sold? Are there any deal-killer items the seller is aware of (foundation, flood, title, zoning, code violations)?
- Is there a deadline driving the sale (1031 exchange, divorce, estate, relocation)? That informs how much negotiation room exists.
- Schools are F-rated, which usually means shorter tenancies and higher turnover. Who's the typical renter profile here, and what's been the actual vacancy rate?
- Crime grade is F in this area — have there been break-ins, vandalism, or insurance claims at this property in the last 3 years? What carrier currently insures it and at what premium?
- What's the average days-on-market for RENTAL listings here right now (not sales)? A rising rental-DOM trend means longer vacancies and softer asking-rent achievability than the comps imply.
- What's the recent tenant-quality profile in this submarket — average credit score on applications, eviction rate, late-payment / NSF rate, and stable-employment percentage? A property-management company in the area should have these aggregated.
- How much new for-sale + rental construction is in the pipeline within 1–3 miles? Heavy new supply typically softens prices + rents 12–24 months out; constrained supply supports both.
Investment metrics
- 1% rule
- 5.75% ✓
- Cap rate
- 53.10%
- Cash-on-cash
- 167.16%
- DSCR
- 8.44
- GRM
- 1.4
CMA / ARV
No comps found within radius.
Projected returns pro-forma
5.97% appreciation · 3.0% rent growth · sell at horizon
- IRR
- —
- Equity multiple
- 10.09×
- Total profit
- $47,078
- Equity at exit
- $11,589
- IRR
- —
- Equity multiple
- 21.45×
- Total profit
- $105,919
- Equity at exit
- $20,980
Cash invested: $5,180 (down + closing). Projections, not guarantees.
Landlord ↔ Tenant lean methodology
- Overall (STATE)
- 87 Strongly Landlord-Friendly
- State Tennessee
- 87 Strongly Landlord-Friendly · R+13
- County
- — inherits STATE
- City
- — inherits STATE
ZIP-level market 38221
- Home prices YoY
- 2.7%
- Active inventory
- 93
- Price-to-rent
- 1.4×
Monthly cashflow live
- Estimated rent
- $1,064 medium interval (Pro) →
- Mortgage (P&I)
- −$97
- Tax from tax record
- −$14 /mo · $173/yr
- Insurance
- −$8
- Flood insurance flood zone
- −$66 /mo · $798/yr
- HOA
- −$0
- Vacancy / Maint / Mgmt
- −$223
- Net cashflow
- $655
Break-even live
UW: 25.0% down · 7.5% · 30yr · 1.5% tax · 5.0% vac · 8.0% maint · 8.0% mgmt
Financing live
Cash to close
- Down payment
- $4,625
- Closing costs
- $555
- Reserves months
- —
- Total cash needed
- —
Loan-product check · same deal, 3 products live
Conventional
25% down · 7.5% · 30yr
- Down + closing
- —
- Monthly P&I
- —
- Monthly cashflow
- —
- DSCR
- —
- Eligible?
- —
Personal DTI + credit; lowest rate.
DSCR
20% down · 8.5% · 30yr
- Down + closing
- —
- Monthly P&I
- —
- Monthly cashflow
- —
- DSCR
- —
- Eligible?
- —
No personal income docs; deal must DSCR.
Hard money
10% down · 12.0% · 12mo
- Down + closing
- —
- Monthly P&I
- —
- Monthly cashflow
- —
- DSCR
- —
- Eligible?
- —
Short-term bridge; refi at stabilization.
Listing history 20 events
-
2026-06-18days on market $18,500 Active 115 DOM
-
2026-06-17days on market $18,500 Active 114 DOM
-
2026-06-16days on market $18,500 Active 113 DOM
-
2026-06-15days on market $18,500 Active 112 DOM
-
2026-06-13days on market $18,500 Active 110 DOM
-
2026-06-12days on market $18,500 Active 109 DOM
-
2026-06-09days on market $18,500 Active 106 DOM
-
2026-06-08days on market $18,500 Active 105 DOM
-
2026-06-08days on market $18,500 Active 104 DOM
-
2026-06-07days on market $18,500 Active 103 DOM
-
2026-06-04remarks 671-char remark
-
2026-06-04days on market $18,500 Active 100 DOM
-
2026-06-02days on market $18,500 Active 99 DOM
-
2026-06-01days on market $18,500 Active 98 DOM
-
2026-05-31days on market $18,500 Active 97 DOM
-
2026-05-24price $18,500
-
2026-03-18soldstatus $5,497
-
2026-02-24$19,500 Active
-
1997-03-21soldstatus $11,000
-
1996-07-09soldstatus $11,000
ⓘ Source: listings_history table (triggers on properties + properties_extension) + one-shot
backfill from property_details.listing_events for pre-trigger history.
Tax reassessment forecast TN · Resets to sale price
- Current annual tax
- $173 · $14/mo
- Projected year-2 tax
- $173 · $14/mo
- Expected delta
- $0/yr ($0/mo · 0.0%)
ⓘ Screening estimate from a state-policy table — verify with the county assessor before closing.
Climate risk First Street
- Flood 7/10 Severe FEMA zone X (unshaded) · 99% chance over 30 yrs
- Wildfire 4/10 Moderate
- Heat 5/10 Major 7 d/yr ≥109°F today · 20 d/yr by 30 yrs out
- Wind 4/10 Moderate 9% chance of damaging wind over 30 yrs
- Air quality 1/10 Low 0 unhealthy d/yr today · 0 by 30 yrs out
Nearby sold comps map
Loading sold comps map…
Walkable amenities ~0.75 mi
Loading nearby amenities…
Taxation est. · year 1
- Rental income
- $12,770
- − Mortgage interest
- −$1,036
- − Property taxes
- −$173
- − Insurance
- −$890
- − Repairs & maintenance
- −$1,022
- − Management
- −$1,022
- − Depreciation
- −$538
- Taxable income
- $8,089
- Est. tax owed @ 24.0%
- −$1,941
- After-tax cash flow
- $5,920/yr
For passive investors: Depreciation is non-cash, so a rental often shows a tax loss while cash-flowing — sheltering income. Rental losses are passive: they offset passive income freely, and up to $25,000/yr can offset ordinary (W-2) income if you actively participate and your MAGI is under $100k (phasing out to $0 by $150k); unused losses carry forward. On sale, claimed depreciation is recaptured at up to 25%, and gains may owe capital-gains tax (a 1031 exchange can defer both). Figures are a year-1 estimate at your 24.0% rate — not tax advice; consult a CPA.
Schools (NCES district)
- District
- Benton County
- NCES district ID
- 4700240
- Math proficiency
- 31% ▼ -8.00%
- Reading proficiency
- 28% ▼ -7.00%
- Median HH income
- $33,587
- Composite
- 24.24/100
- National rank
- #7722
- State rank
- #66 of 139 in TN
Livability — Big Sandy
- Score
- 58/100
- State rank
- #315
- US rank
- #21412
Category grades
Schools grade is shown separately in the Schools card above.
Census & demographics
- Population (ZIP)
- 3,046
Population outlook (Benton County) Hauer SSP2
- Today (2025)
- 15,046 people
- By 2030
- 14,425 · -4.1%
- By 2040
- 13,296 · -11.6%
- By 2050
- 12,298 · -18.3%
- By 2075
- 10,347 · -31.2%
- By 2100
- 8,594 · -42.9%
Race, ethnicity, and origin ACS 2023
- Neighborhood character
- Predominantly White (96%)
- Race & ethnicity
- White 96% Two or more races 2% Hispanic / Latino 2%
- Common ancestry
- Slovak 2% Lithuanian 2% Serbian 1%
- Foreign-born
- 1% · Canada
- Languages at home
- 98% English-only · German/W. Germanic 1% Russian/Polish/Slavic 1%
Political lean MEDSL · Benton
- 2024 margin
- Solid R (+62.9) · D 18.1% · R 81.1%
- 2008→2024 swing
- -46.7pp toward R · 2008: -16.2pp · 2024: -62.9pp
- All cycles
- 2024: R+62.9 2020: R+57.0 2016: R+51.3 2012: R+25.6 2008: R+16.2
Not yet ingested
- Civics
- —
Market trends
- HPI YoY
- ▲ 5.97%
- Current HPI
- 230.2855
- Rent YoY
- —
- Metro
- —
- State GDP YoY
- ▲ 2.78%
- F500 in state
- 22
Industry mix (Fortune 500 HQ in TN)
| Industry | F500 HQs | Revenue |
|---|---|---|
| Healthcare | 3 | $91B |
|
||
| Retail | 3 | $72B |
|
||
| Transportation / Logistics | 1 | $88B |
|
||
| Paper / Packaging | 1 | $19B |
|
||
| Insurance | 1 | $13B |
|
||
| Energy | 1 | $12B |
|
||
Price history
+68.2% since first listed5 events — show timeline
- 2026-05-24 Price Changed $18,500 TVAR
- 2026-03-18 Sold (Public Records) $5,497 Public Records
- 2026-02-24 Listed $19,500 TVAR
- 1997-03-21 Sold (Public Records) $11,000 Public Records
- 1996-07-09 Sold (Public Records) $11,000 Public Records
Property tax history
-2.7%/yrLatest (2025): $173 · -14.8% YoY. Source: county tax records.
Cash-flow waterfall
monthlySold comps — $/sqft
last 12 mo · ≤1 miLoading sold comps…