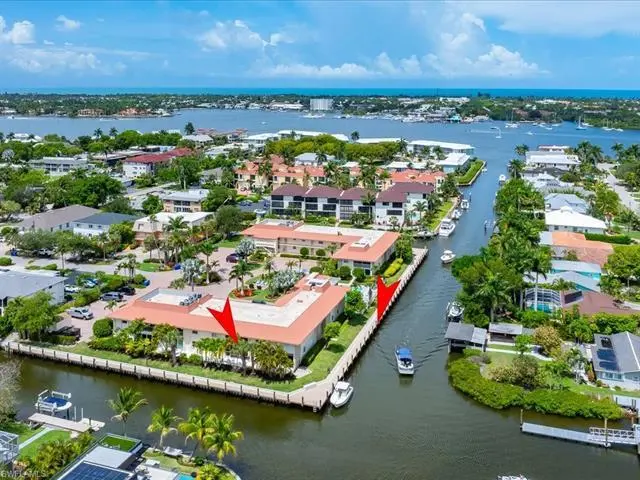
1200 Cherrystone Ct Unit B-109 · Naples, FL
Flood risk 9/10 · Severe
- FEMA flood zone
- AE
- Chance of flooding over 30 yrs
- 0.99%
- Est. flood insurance / yr
- $1,737 – $8,500
Fire risk 3/10 · Minor
- Est. fire insurance / yr
- $947 – $1,759
Heat risk 10/10 · Severe
- Hot days now (above 107°F)
- 7 days/yr
- Hot days in 30 yrs
- 25 days/yr
Wind risk 10/10 · Severe
- Chance of severe wind over 30 yrs
- 99.0%
Air-quality risk 3/10 · Minor
- Unhealthy air days now
- 3 days/yr
- Unhealthy air days in 30 yrs
- 3 days/yr
Risk factors via First Street. Map © Google.
Why this score? — see what drove the B grade
The composite is a weighted blend of 9 inputs, each scored 0–100. Each bar is that input's sub-score; the figure is the points it added to the 100-point composite (weight × sub-score).
- Cash flow +26.2/30.0
- DSCR +8.9/10.0
- 1% rule +8.0/10.0
- ARV discount +7.5/15.0
- Appreciation +7.0/10.0
- Schools +5.0/10.0
- Rent growth +4.7/5.0
- Livability +4.0/5.0
- Condition / age +2.5/5.0
$399,000
🖨 Deal sheet 📄 Offer letter ✓ Due diligence
Listing remarks
An exceptional boating opportunity in Naples at an incredible value! Waterfront living meets direct Gulf access in this charming first-floor residence at Cherrystone Court, complete with a deeded 30-foot boat dock featuring electric & water, a new wooden dock and seawall, and NO BRIDGES to the Gulf — offering the effortless boating lifestyle so many dream of, yet rarely find at this price point. Positioned along a peaceful canal connected to Naples Bay, this 2-bedroom, 2-bath residence offers 1,276 square feet of inviting living space and tranquil canal and boat dock views from the glass-enclosed lanai. Inside, the condo features an updated kitchen with granite countertops and r
Key facts
- Direct gulf access
- New wooden dock
- No bridges to gulf
Tags
Property features AI
Finance
- Other: Deeded dock included (wooden) with electricity and water at dock; Gulf access with no bridges; canal width 31–80 feet; Dock deeded and included
- Financial info: Total annual recurring fees reported; Total one-time fees reported
- HOA & community: Quarterly condo fee (community-managed); Professional management; Community amenities include community pool, community room, cabana, BBQ/picnic area, and boat storage; Community type: Boating, non-gated; Maintenance covered: insurance, irrigation water, lawn/land maintenance, pest control (exterior), sewer, water, recreation facilities, repairs, reserves, legal/accounting, manager
Exterior
- Parking: 1 assigned parking space; Guest parking; Paved parking
- Security: Underground utilities (community)
- Utilities: Central water; Central sewer; Cable available
- Home design: Residential low-rise building (1–3 stories); Built in 1974; Concrete block construction; Rear exposure faces east; Located in Oyster Bay development
- Construction: Concrete block construction; Stucco finish; Shingle roof; Built in 1974
- Exterior features: Shingle roof; Single-hung windows; Manual shutters; Stucco exterior; Canal waterfront; Canal view, landscaped area and water views; Reclaimed irrigation; County-maintained paved road with cul-de-sac; Regular lot
Interior
- Kitchen: Dishwasher; Disposal; Microwave; Range; Refrigerator/ice maker; Breakfast bar; Dining area in living room
- Bedrooms: 2 bedrooms; First-floor bedroom; Split bedroom floor plan
- Flooring: Carpet; Tile
- Bathrooms: 2 full bathrooms; Master bath with shower (no tub)
- Heating & cooling: Central electric heat; Central electric air conditioning; Ceiling fans
- Interior features: High-speed internet available; Walk-in closet; Window coverings; Glass porch; Screened lanai/porch; Turnkey furnished
- Laundry & utility: Washer and dryer in residence
Neighborhood map
What this means for you Summary
Snapshot
- This is a 2-bed/2.0-bath condo listed at $399k.
Deal economics
- At list price, monthly cash flow is $592 ($7k/yr) — positive.
- The deal already cash-flows at list — no discount required.
- Meets the 1% rule at list price ($5k rent vs $399k).
- Recommended offer: $393k (1.5% below list) — sets the bar for market timing.
Location & tenants
- Location reads 80/100 on livability (#126 in FL, #1,903 nationally) — a professional / high-income tenant draw. Strengths: crime A+, amenities A+, employment A+; Watch: commute D+, cost of living F.
- Market conditions: Rents rising fast (+8.8%/yr); 614 active listings in the ZIP; 40 comparable units currently listed for rent nearby; rentals at typical pace (median 23d on market — plan ~3-4 weeks tenant-placement turnaround); high-income renter base; 3,520 units permitted in Collier County in 2024 (959 in 5+ unit buildings).
- At $5,189/mo this rent would consume 48% of the median local household income ($131k/yr) (locally 333% of renters already pay >50% of income on rent) — very limited rent-growth headroom before tenants either downsize or default.
Forward outlook
- In year one you build about $19k of equity ($3k loan paydown + $16k appreciation (4.1% local appreciation)).
- Collier County population projected at +30% by 2050 — long-run rental-demand tailwind backs the buy-and-hold thesis.
- At projected returns (4.1% appreciation + 8.0% rent growth), your $112k cash investment doubles in ~4 years — after that, you're playing with house money.
- By year 2, paydown + projected appreciation supports a ~$31k cash-out refi (75% LTV) — recoverable capital for the next deal without selling this one.
Negotiation context
- It's been on market 23 days — a 2% lower offer ($393k) is reasonable based on typical stale-listing flexibility.
- Current owner paid $118k; list at $399k implies a 238% gain — meaningful room to come down on a strong offer.
Risks & watch-outs
- Watch-outs: flood insurance adds $427/mo.
- Climate carrying-cost: in FEMA flood zone AE (mandatory federal flood insurance); severe wind risk, 99% chance of damaging wind over 30y; extreme-heat days projected 7→25/yr by 2055 (HVAC capex compounding) — expect insurance premiums to compound above CPI over the hold.
Questions for the listing agent
- Built in 1974 — when were the roof, HVAC, electrical panel, plumbing, and water heater last replaced?
- What's the actual annual flood-insurance premium (NFIP or private), and is the property in a SFHA with mandatory coverage?
- What does the HOA fee cover, when was the last increase, and are there any pending special assessments or reserve-fund shortfalls?
- Any open or pending special assessments — roof, HVAC, plumbing, elevator, façade? What's the per-unit balance and payoff schedule, and is the seller paying it off at close or rolling it to the buyer?
- Is there a deadline driving the sale (1031 exchange, divorce, estate, relocation)? That informs how much negotiation room exists.
- Schools are B-rated — typically a magnet for longer-tenancy family renters. What's the average tenant stay here, and is there a school-zone premium baked into asking?
- What's the average days-on-market for RENTAL listings here right now (not sales)? A rising rental-DOM trend means longer vacancies and softer asking-rent achievability than the comps imply.
- What's the recent tenant-quality profile in this submarket — average credit score on applications, eviction rate, late-payment / NSF rate, and stable-employment percentage? A property-management company in the area should have these aggregated.
- How much new apartment / multifamily construction is in the pipeline within 1–3 miles? Heavy new supply (>2% of stock underway) typically softens rents 12–24 months out; light construction supports rent growth.
Investment metrics
- 1% rule
- 1.30% ✓
- Cap rate
- 9.36%
- Cash-on-cash
- 10.94%
- DSCR
- 1.49
- GRM
- 6.4
CMA / ARV
No comps found within radius.
Projected returns pro-forma
4.08% appreciation · 8.0% rent growth · sell at horizon
- IRR
- 19.6%
- Equity multiple
- 2.23×
- Total profit
- $137,076
- Equity at exit
- $204,249
- IRR
- 23.0%
- Equity multiple
- 5.11×
- Total profit
- $459,490
- Equity at exit
- $335,631
Cash invested: $111,720 (down + closing). Projections, not guarantees.
Landlord ↔ Tenant lean methodology
- Overall (STATE)
- 87 Strongly Landlord-Friendly
- State Florida
- 87 Strongly Landlord-Friendly · R+3
- County
- — inherits STATE
- City
- — inherits STATE
ZIP-level market 34102
- Home prices YoY
- 1.3%
- Rents YoY
- 8.8%
- Active inventory
- 614
- Price-to-rent
- 6.4×
Monthly cashflow live
- Estimated rent
- $5,189 medium interval (Pro) →
- Mortgage (P&I)
- −$2,092
- Tax from tax record
- −$77 /mo · $930/yr
- Insurance
- −$166
- Flood insurance flood zone
- −$427 /mo · $5,118/yr
- HOA
- −$745
- Vacancy / Maint / Mgmt
- −$1,090
- Net cashflow
- $592
Break-even live
UW: 25.0% down · 7.5% · 30yr · 1.5% tax · 5.0% vac · 8.0% maint · 8.0% mgmt
Financing live
Cash to close
- Down payment
- $99,750
- Closing costs
- $11,970
- Reserves months
- —
- Total cash needed
- —
Loan-product check · same deal, 3 products live
Conventional
25% down · 7.5% · 30yr
- Down + closing
- —
- Monthly P&I
- —
- Monthly cashflow
- —
- DSCR
- —
- Eligible?
- —
Personal DTI + credit; lowest rate.
DSCR
20% down · 8.5% · 30yr
- Down + closing
- —
- Monthly P&I
- —
- Monthly cashflow
- —
- DSCR
- —
- Eligible?
- —
No personal income docs; deal must DSCR.
Hard money
10% down · 12.0% · 12mo
- Down + closing
- —
- Monthly P&I
- —
- Monthly cashflow
- —
- DSCR
- —
- Eligible?
- —
Short-term bridge; refi at stabilization.
Rent comps 40 comps
| Address | Beds | Baths | Sqft | Rent | $/sqft | DOM | Units | Dist |
|---|---|---|---|---|---|---|---|---|
| 1200 Cherrystone Ct Unit A203 Naples, FL | 2.0 | 2.0 | 1276 | $4,950 | $3.88 | 23d | 1 | 0.04mi |
| 1186 Cherrystone Ct Naples, FL | 2.0 | 2.0 | 1163 | $1,995 | $1.72 | 23d | 1 | 0.05mi |
| 1555 Blue Point Ave Unit 3 Naples, FL | 2.0 | 2.0 | 1025 | $1,745 | $1.70 | 13d | 1 | 0.06mi |
| 1165 Clam Ct #7 Naples, FL | 2.0 | 2.5 | 1449 | $2,900 | $2.00 | 23d | 1 | 0.08mi |
| 1686 Blue Point Ave Unit B1 Naples, FL | 2.0 | 2.0 | 1198 | $6,500 | $5.43 | 23d | 1 | 0.09mi |
| 1686 Blue Point Ave Naples, FL | 2.0 | 2.0 | 1057 | $5,500 | $5.20 | 13d | 2 | 0.09mi |
| 1535 Chesapeake Ave Unit A2 Naples, FL | 2.0 | 2.0 | 1080 | $2,000 | $1.85 | 23d | 1 | 0.11mi |
| 1155 Sandpiper St Naples, FL | 2.0 | 2.0 | 1062 | $4,050 | $3.81 | 23d | 2 | 0.11mi |
| 1155 Sandpiper St Naples, FL | 2.0 | 2.0 | 1062 | $3,950 | $3.72 | 21d | 3 | 0.11mi |
| 1501 Chesapeake Ave Unit 1296210P Naples, FL | 2.0 | 2.0 | 1377 | $4,110 | $2.98 | 13d | 1 | 0.11mi |
| 1625 Chesapeake Ave #203 Naples, FL | 2.0 | 2.0 | 1200 | $4,500 | $3.75 | 23d | 1 | 0.12mi |
| 1495 Blue Point Ave Unit C Naples, FL | 2.0 | 2.5 | 1529 | $12,000 | $7.85 | 23d | 1 | 0.12mi |
| 985 Sandpiper St Unit 1I-204 Naples, FL | 3.0 | 2.0 | 1769 | $4,850 | $2.74 | 23d | 1 | 0.13mi |
| 1666 Osprey Ave #203 Naples, FL | 2.0 | 2.0 | 1200 | $7,000 | $5.83 | 23d | 1 | 0.15mi |
| 1400 Blue Point Ave #104 Naples, FL | 2.0 | 2.0 | 1550 | $2,900 | $1.87 | 23d | 1 | 0.16mi |
| 1589 Osprey Ave Naples, FL | 3.0 | 2.0 | 1868 | $3,950 | $2.11 | 23d | 1 | 0.19mi |
| 1589 Osprey Ave Naples, FL | 3.0 | 2.0 | 1868 | $3,750 | $2.01 | 13d | 1 | 0.19mi |
| 1437 Sandpiper St Naples, FL | 3.0 | 2.0 | 1200 | $16,000 | $13.33 | 23d | 1 | 0.20mi |
| 1353 Pelican Ave Naples, FL | 2.0 | 2.0 | 1203 | $8,500 | $7.07 | 23d | 1 | 0.22mi |
| 1376 Chesapeake Ave #2 Naples, FL | 2.0 | 2.0 | 1218 | $2,300 | $1.89 | 23d | 1 | 0.22mi |
| 1120 Little Neck Ct Unit E40 Naples, FL | 3.0 | 2.0 | 1400 | $2,999 | $2.14 | 23d | 1 | 0.22mi |
| 1600 Curlew Ave Naples, FL | 3.0 | 2.0 | 1817 | $20,000 | $11.01 | 23d | 1 | 0.23mi |
| 12 Knights Bridge Rd Unit A32 Naples, FL | 2.0 | 2.0 | 1095 | $3,200 | $2.92 | 21d | 1 | 0.27mi |
| 1549 Sandpiper St #36 Naples, FL | 2.0 | 2.0 | 1073 | $2,195 | $2.05 | 23d | 1 | 0.28mi |
| 1501 Curlew Ave Naples, FL | 2.0 | 1.0 | 1180 | $2,000 | $1.69 | 23d | 1 | 0.28mi |
| 9 Knights Bridge Rd #30 Naples, FL | 2.0 | 2.0 | 1296 | $3,000 | $2.31 | 13d | 1 | 0.28mi |
| 1435 Curlew Ave #1 Naples, FL | 2.0 | 2.0 | 975 | $2,850 | $2.92 | 23d | 1 | 0.31mi |
| 1435 Curlew Ave #1 Naples, FL | 2.0 | 2.0 | 975 | $2,850 | $2.92 | 21d | 1 | 0.31mi |
| 1950 Mayfair ST Unit 923 Naples, FL | 2.0 | 2.0 | 1142 | $4,490 | $3.93 | 13d | 1 | 0.31mi |
| 1950 Mayfair ST Unit 818 Naples, FL | 2.0 | 2.0 | 1142 | $4,415 | $3.87 | 13d | 1 | 0.31mi |
| 1950 Mayfair ST Unit 901 Naples, FL | 2.0 | 2.0 | 1025 | $4,560 | $4.45 | 13d | 1 | 0.31mi |
| 1950 Mayfair ST Unit 1027 Naples, FL | 1.0 | 1.0 | 888 | $3,525 | $3.97 | 13d | 1 | 0.31mi |
| 1395 Curlew Ave Unit 4-3 Naples, FL | 2.0 | 2.0 | 975 | $7,000 | $7.18 | 23d | 1 | 0.33mi |
| 24 Rivard Rd Naples, FL | 3.0 | 2.0 | 1314 | $6,500 | $4.95 | 23d | 1 | 0.33mi |
| 1950 Mayfair St Naples, FL | 3.0 | 1.0–3.5 | 1514 | $8,752 | $5.78 | 13d | 109 | 0.36mi |
| 105 Georgetown Blvd #105 Naples, FL | 2.0 | 2.0 | 1450 | $6,500 | $4.48 | 23d | 1 | 0.39mi |
| 69 Georgetown Blvd #69 Naples, FL | 2.0 | 2.0 | 1450 | $5,500 | $3.79 | 23d | 1 | 0.42mi |
| 91 Georgetown Blvd #91 Naples, FL | 2.0 | 2.0 | 1450 | $7,000 | $4.83 | 23d | 1 | 0.42mi |
| 1747 Sandpiper St Unit B Naples, FL | 3.0 | 2.0 | 1800 | $9,000 | $5.00 | 21d | 1 | 0.44mi |
| 84 Georgetown Blvd #84 Naples, FL | 2.0 | 2.0 | 1450 | $5,500 | $3.79 | 23d | 1 | 0.46mi |
HOA detail condo
- Monthly dues
- $745 · $8,940/yr
- Likely covers
- waterelectric
- Assessments
- None detected in remarks — confirm with the listing agent.
Listing history 17 events
-
2026-06-18days on market $399,000 Active 23 DOM
-
2026-06-17days on market $399,000 Active 22 DOM
-
2026-06-16days on market $399,000 Active 21 DOM
-
2026-06-15days on market $399,000 Active 20 DOM
-
2026-06-14days on market $399,000 Active 18 DOM
-
2026-06-10days on market $399,000 Active 15 DOM
-
2026-06-09days on market $399,000 Active 14 DOM
-
2026-06-08days on market $399,000 Active 13 DOM
-
2026-06-07days on market $399,000 Active 12 DOM
-
2026-06-03days on market $399,000 Active 8 DOM
-
2026-06-02days on market $399,000 Active 7 DOM
-
2026-06-01days on market $399,000 Active 6 DOM
-
2026-05-31days on market $399,000 Active 5 DOM
-
2026-05-30days on market $399,000 Active 4 DOM
-
2026-05-26$399,000 Active
-
1997-01-08soldstatus $118,000
-
1992-07-01soldstatus $122,000
ⓘ Source: listings_history table (triggers on properties + properties_extension) + one-shot
backfill from property_details.listing_events for pre-trigger history.
Tax reassessment forecast FL · Resets to sale price
- Current annual tax
- $930 · $77/mo
- Projected year-2 tax
- $3,312 · $276/mo
- Expected delta
- +$2,382/yr (+$199/mo · 256.3%)
ⓘ Screening estimate from a state-policy table — verify with the county assessor before closing.
Climate risk First Street
- Flood 9/10 Extreme FEMA zone AE · 99% chance over 30 yrs
- Wildfire 3/10 Moderate
- Heat 10/10 Extreme 7 d/yr ≥107°F today · 25 d/yr by 30 yrs out
- Wind 10/10 Extreme 99% chance of damaging wind over 30 yrs
- Air quality 3/10 Moderate 3 unhealthy d/yr today · 3 by 30 yrs out
Nearby sold comps map
Loading sold comps map…
Walkable amenities ~0.75 mi
Loading nearby amenities…
Taxation est. · year 1
- Rental income
- $62,271
- − Mortgage interest
- −$22,350
- − Property taxes
- −$930
- − Insurance
- −$7,114
- − Repairs & maintenance
- −$4,982
- − Management
- −$4,982
- − HOA
- −$8,940
- − Depreciation
- −$11,607
- Taxable income
- $1,367
- Est. tax owed @ 24.0%
- −$328
- After-tax cash flow
- $6,774/yr
For passive investors: Depreciation is non-cash, so a rental often shows a tax loss while cash-flowing — sheltering income. Rental losses are passive: they offset passive income freely, and up to $25,000/yr can offset ordinary (W-2) income if you actively participate and your MAGI is under $100k (phasing out to $0 by $150k); unused losses carry forward. On sale, claimed depreciation is recaptured at up to 25%, and gains may owe capital-gains tax (a 1031 exchange can defer both). Figures are a year-1 estimate at your 24.0% rate — not tax advice; consult a CPA.
Schools (NCES district)
No district data.
Livability — Naples
- Score
- 80/100
- State rank
- #126
- US rank
- #1903
Category grades
Schools grade is shown separately in the Schools card above.
Census & demographics
- Census place
- Naples, FL
- County
- Collier County · 396,295 people
- City population
- 344,941
- Metro
- Naples-Marco Island, FL
- Population (ZIP)
- 11,179
- Household income
- $130,929
- Rent vs Own
- Severe rent burden
- 333.0
Population outlook (Collier County) Hauer SSP2
- Today (2025)
- 420,858 people
- By 2030
- 450,054 · +6.9%
- By 2040
- 502,232 · +19.3%
- By 2050
- 544,932 · +29.5%
- By 2075
- 627,203 · +49.0%
- By 2100
- 659,015 · +56.6%
Race, ethnicity, and origin ACS 2023
- Neighborhood character
- Predominantly White (79%)
- Race & ethnicity
- White 79% Hispanic / Latino 9% Two or more races 8% Black 8% Asian 1%
- Hispanic origin (detail)
- Cuban 6%
- Common ancestry
- Hispanic 4% Lithuanian 4% Romanian 4%
- Foreign-born
- 17% · Canada, China
- Languages at home
- 87% English-only · Spanish 7% French/Haitian/Cajun 4% German/W. Germanic 1%
Political lean MEDSL · Collier
- 2024 margin
- Solid R (+33.1) · D 33.1% · R 66.2%
- 2008→2024 swing
- -10.6pp toward R · 2008: -22.5pp · 2024: -33.1pp
- All cycles
- 2024: R+33.1 2020: R+24.7 2016: R+26.0 2012: R+30.1 2008: R+22.5
Not yet ingested
- Civics
- —
Market trends
- HPI YoY
- ▲ 4.08%
- Current HPI
- 328.2755
- Rent YoY
- ▲ 8.75%
- Metro
- Naples-Marco Island, FL
- State GDP YoY
- ▲ 3.28%
- F500 in state
- 36
Industry mix (Fortune 500 HQ in FL)
| Industry | F500 HQs | Revenue |
|---|---|---|
| Industrial Technology | 2 | $29B |
|
||
| Insurance | 2 | $17B |
|
||
| Retail | 1 | $60B |
|
||
| Technology Distribution | 1 | $58B |
|
||
| Homebuilding | 1 | $35B |
|
||
| Technology Manufacturing | 1 | $35B |
|
||
Price history
+227.0% since first listed3 events — show timeline
- 2026-05-26 Listed $399,000 NAPLESMLS
- 1997-01-08 Sold (Public Records) $118,000 Public Records
- 1992-07-01 Sold (Public Records) $122,000 Public Records
Property tax history
-0.8%/yrLatest (2025): $930 · +3.0% YoY. Source: county tax records.
Cash-flow waterfall
monthlySold comps — $/sqft
last 12 mo · ≤1 miLoading sold comps…