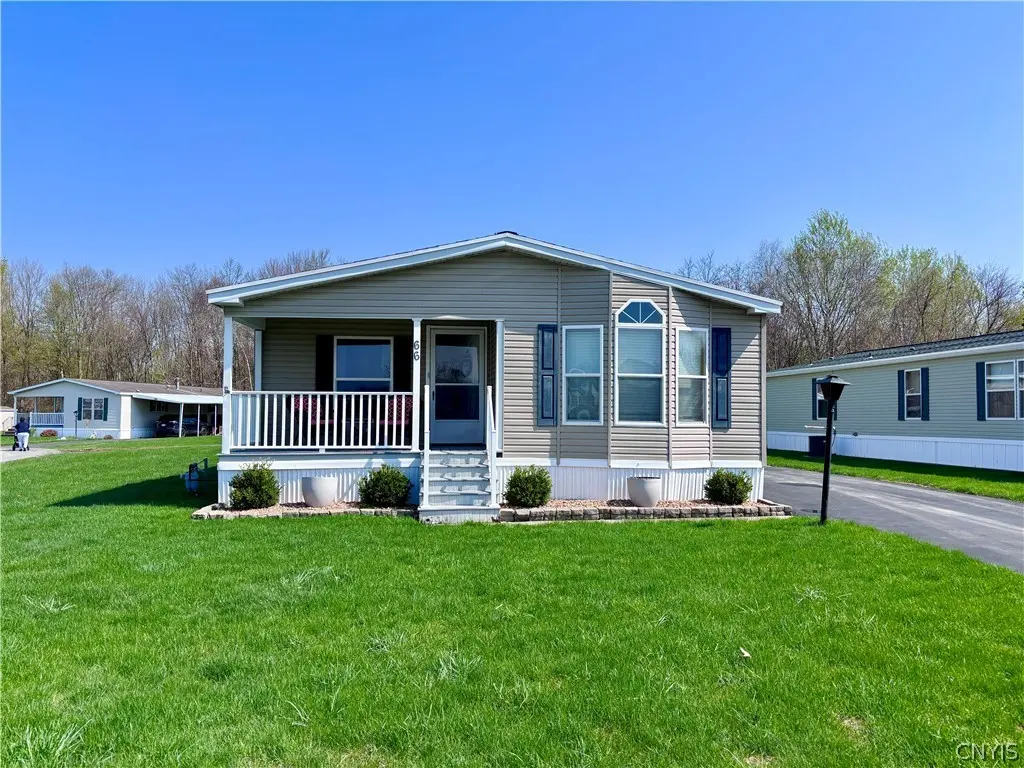
66 Norma Dr · Clark Mills, NY
Flood risk No data
- FEMA flood zone
- —
- Chance of flooding over 30 yrs
- —
- Est. flood insurance / yr
- —
Fire risk No data
- Est. fire insurance / yr
- —
Heat risk No data
- Hot days now (above threshold)
- —
- Hot days in 30 yrs
- —
Wind risk No data
- Chance of severe wind over 30 yrs
- —
Air-quality risk No data
- Unhealthy air days now
- —
- Unhealthy air days in 30 yrs
- —
Risk factors via First Street. Map © Google.
Why this score? — see what drove the B- grade
The composite is a weighted blend of 9 inputs, each scored 0–100. Each bar is that input's sub-score; the figure is the points it added to the 100-point composite (weight × sub-score).
- Cash flow +30.0/30.0
- DSCR +10.0/10.0
- 1% rule +8.9/10.0
- Schools +5.5/10.0
- Condition / age +4.0/5.0
- ARV discount +3.8/15.0
- Livability +3.6/5.0
- Rent growth +2.5/5.0
- Appreciation +0.0/10.0
$143,900
🖨 Deal sheet 📄 Offer letter ✓ Due diligence
Listing remarks MLS
Carefree living in a premier manufactured park featuring 3BD 2BA, oversized living room, dining room spectacular kitchen, and den. Meticulous still seems brand new built in 2006, with 1900 sq. ft. of fabulous open space. Wonderful spot and in Clinton School District.
Key facts
- Open floor plan
- New hot water tank
- One-level living
Tags
Neighborhood map
What this means for you Summary
Snapshot
- This is a 3-bed/2.0-bath manufactured listed at $144k. Condition is rated good.
Deal economics
- At list price, monthly cash flow is $589 ($7k/yr) — positive.
- The deal already cash-flows at list — no discount required.
- Meets the 1% rule at list price ($2k rent vs $144k).
Location & tenants
- Location reads 71/100 on livability (#383 in NY) — a middle-class / working-renter tenant base. Strengths: housing A+, health & safety A+, crime A; Watch: schools D-, amenities F, commute F.
- Clinton Central School District (suburban): math 57% / reading 71% proficiency, ranked #185 of 590 in NY (top 31%) — acceptable for families but not a draw, mixed tenant base, ~2y average lease; only 17% free/reduced lunch — higher-income household profile.
- Market conditions: 41 active listings in the ZIP; 204 units permitted in Oneida County in 2024 (68 in 5+ unit buildings).
Forward outlook
- Local home prices are declining (-3.0%/yr); year-one equity from $995 of loan paydown is wiped out by about $4k of value loss. Plan a longer hold.
- Oneida County population projected at -12% by 2050 — secular population decline; favor cash flow + early exit over multi-decade hold.
- At projected returns (-3.0% appreciation + 3.0% rent growth), your $40k cash investment doubles in ~7 years — after that, you're playing with house money.
Negotiation context
- Only 4 days on market — expect competitive offers; lowballing is unlikely to land.
- 2 sale attempts since 15y ago with the ask held roughly flat each time — persistent listings suggest the price (not the market) is what's stuck; bring a comps-based counter.
- Current owner paid $52k; list at $144k implies a 177% gain — meaningful room to come down on a strong offer.
Questions for the listing agent
- Is there a deadline driving the sale (1031 exchange, divorce, estate, relocation)? That informs how much negotiation room exists.
- Schools are D-rated, which usually means shorter tenancies and higher turnover. Who's the typical renter profile here, and what's been the actual vacancy rate?
- What's the average days-on-market for RENTAL listings here right now (not sales)? A rising rental-DOM trend means longer vacancies and softer asking-rent achievability than the comps imply.
- What's the recent tenant-quality profile in this submarket — average credit score on applications, eviction rate, late-payment / NSF rate, and stable-employment percentage? A property-management company in the area should have these aggregated.
- How much new for-sale + rental construction is in the pipeline within 1–3 miles? Heavy new supply typically softens prices + rents 12–24 months out; constrained supply supports both.
Investment metrics
- 1% rule
- 1.39% ✓
- Cap rate
- 11.20%
- Cash-on-cash
- 17.53%
- DSCR
- 1.78
- GRM
- 6.0
CMA / ARV
- ARV (on-the-fly)
- $133,000
- Comps found
- 7
Show comp detail 7 sales within ~0.75 mi
| Address | Dist | Beds/Ba | Sqft | Sold | Price | $/sf | Match |
|---|---|---|---|---|---|---|---|
| 144 Anthony Ln | 0.32mi | 3/2.0 | 1,764 (-7%) | 4mo | $68,000 | $39 | 70 |
| 320 Matthew Dr | 0.22mi | 3/2.0 | 1,716 (-10%) | 12mo | $125,000 | $73 | 64 |
| 462 Susan Dr | 0.12mi | 3/2.0 | 1,736 (-9%) | 21mo | $120,000 | $69 | 63 |
| 139 Royal Meadows Dr | 0.60mi | 3/2.0 | 1,792 (-6%) | 5mo | $126,000 | $70 | 58 |
| 3 Hickory Dr | 0.36mi | 3/2.0 | 2,016 (+6%) | 18mo | $110,000 | $55 | 58 |
| 7 Hickory Dr | 0.36mi | 3/2.0 | 1,736 (-9%) | 14mo | $122,500 | $71 | 57 |
| 17 Hickory Dr | 0.36mi | 3/2.0 | 1,680 (-12%) | 19mo | $127,900 | $76 | 48 |
Match score weights: distance 35% · size 25% · config 20% · recency 20%. Top-matched comps best support the ARV.
Projected returns pro-forma
-3.0% appreciation · 3.0% rent growth · sell at horizon
- IRR
- 9.0%
- Equity multiple
- 1.35×
- Total profit
- $14,202
- Equity at exit
- $21,456
- IRR
- 18.2%
- Equity multiple
- 2.51×
- Total profit
- $60,763
- Equity at exit
- $12,442
Cash invested: $40,292 (down + closing). Projections, not guarantees.
Landlord ↔ Tenant lean methodology
- Overall (STATE)
- 15 Strongly Tenant-Friendly
- State New York
- 15 Strongly Tenant-Friendly · D+10
- County
- — inherits STATE
- City
- — inherits STATE
ZIP-level market 13323
- Home prices YoY
- -22.2%
- Active inventory
- 41
- Price-to-rent
- 6.0×
Monthly cashflow live
- Estimated rent
- $2,004 medium interval (Pro) →
- Mortgage (P&I)
- −$755
- Tax est. 1.5%
- −$180 /mo · $2,158/yr
- Insurance
- −$60
- HOA
- −$0
- Vacancy / Maint / Mgmt
- −$421
- Net cashflow
- $589
Break-even live
UW: 25.0% down · 7.5% · 30yr · 1.5% tax · 5.0% vac · 8.0% maint · 8.0% mgmt
Financing live
Cash to close
- Down payment
- $35,975
- Closing costs
- $4,317
- Reserves months
- —
- Total cash needed
- —
Loan-product check · same deal, 3 products live
Conventional
25% down · 7.5% · 30yr
- Down + closing
- —
- Monthly P&I
- —
- Monthly cashflow
- —
- DSCR
- —
- Eligible?
- —
Personal DTI + credit; lowest rate.
DSCR
20% down · 8.5% · 30yr
- Down + closing
- —
- Monthly P&I
- —
- Monthly cashflow
- —
- DSCR
- —
- Eligible?
- —
No personal income docs; deal must DSCR.
Hard money
10% down · 12.0% · 12mo
- Down + closing
- —
- Monthly P&I
- —
- Monthly cashflow
- —
- DSCR
- —
- Eligible?
- —
Short-term bridge; refi at stabilization.
Listing history 4 events
-
2026-04-27status Pending
-
2026-04-23$143,900 Active
-
2011-08-24soldstatus $52,000 267-char remark
Show marketing remark (267 chars)
Carefree living in a premier manufactured park featuring 3BD 2BA, oversized living room, dining room spectacular kitchen, and den. Meticulous still seems brand new built in 2006, with 1900 sq. ft. of fabulous open space. Wonderful spot and in Clinton School District.
-
2011-04-04$58,000 267-char remark
Show marketing remark (267 chars)
Carefree living in a premier manufactured park featuring 3BD 2BA, oversized living room, dining room spectacular kitchen, and den. Meticulous still seems brand new built in 2006, with 1900 sq. ft. of fabulous open space. Wonderful spot and in Clinton School District.
ⓘ Source: listings_history table (triggers on properties + properties_extension) + one-shot
backfill from property_details.listing_events for pre-trigger history.
Nearby sold comps map
Loading sold comps map…
Walkable amenities ~0.75 mi
Loading nearby amenities…
Taxation est. · year 1
- Rental income
- $24,047
- − Mortgage interest
- −$8,061
- − Property taxes
- −$2,158
- − Insurance
- −$720
- − Repairs & maintenance
- −$1,924
- − Management
- −$1,924
- − Depreciation
- −$4,186
- Taxable income
- $5,074
- Est. tax owed @ 24.0%
- −$1,218
- After-tax cash flow
- $5,846/yr
For passive investors: Depreciation is non-cash, so a rental often shows a tax loss while cash-flowing — sheltering income. Rental losses are passive: they offset passive income freely, and up to $25,000/yr can offset ordinary (W-2) income if you actively participate and your MAGI is under $100k (phasing out to $0 by $150k); unused losses carry forward. On sale, claimed depreciation is recaptured at up to 25%, and gains may owe capital-gains tax (a 1031 exchange can defer both). Figures are a year-1 estimate at your 24.0% rate — not tax advice; consult a CPA.
Condition & rehab AI · 1 photo
This well-maintained, one-level manufactured home in the Applewood Community offers a good condition with minimal repairs needed. It is ready for a new owner to move in and enjoy.
Value-add opportunities
- Both Painting exterior and interior — Enhances curb appeal and interior aesthetics
- Both Landscaping improvements — Enhances curb appeal and property value
- Both New window treatments — Improves energy efficiency and aesthetics
- Both New flooring in bathrooms — Enhances aesthetics and functionality
Renovation cost estimate screening
Value-add ROI direction
- Both Painting exterior and interior — Enhances curb appeal and interior aesthetics ↑
- Both Landscaping improvements — Enhances curb appeal and property value ↑
- Both New window treatments — Improves energy efficiency and aesthetics ↑
- Both New flooring in bathrooms — Enhances aesthetics and functionality ↑
ⓘ Cost ranges are severity-bucket heuristics (US national rule-of-thumb). Get contractor quotes + a written scope before underwriting a rehab budget.
Schools (NCES district)
- District
- Clinton Central School District
- NCES district ID
- 3607770
- Math proficiency
- 57% ▼ -11.00%
- Reading proficiency
- 71% ▲ 6.00%
- Median HH income
- $57,439
- Composite
- 55.05/100
- National rank
- #1290
- State rank
- #185 of 590 in NY
Livability — Clark Mills
- Score
- 71/100
- State rank
- #383
- US rank
- #6606
Category grades
Schools grade is shown separately in the Schools card above.
Census & demographics
- City population
- 815
- Population (ZIP)
- 11,014
Population outlook (Oneida County) Hauer SSP2
- Today (2025)
- 225,223 people
- By 2030
- 220,384 · -2.1%
- By 2040
- 209,071 · -7.2%
- By 2050
- 197,920 · -12.1%
- By 2075
- 175,541 · -22.1%
- By 2100
- 148,491 · -34.1%
Race, ethnicity, and origin ACS 2023
- Neighborhood character
- Predominantly White (90%)
- Race & ethnicity
- White 90% Hispanic / Latino 4% Two or more races 3% Asian 2%
- Common ancestry
- Romanian 8% Lithuanian 3% Italian 2%
- Foreign-born
- 4% · Canada, China
- Languages at home
- 94% English-only · Spanish 2% Other Asian/Pacific 1% Other Indo-European 1%
Political lean MEDSL · Oneida
- 2024 margin
- Strong R (+21.3) · D 39.4% · R 60.6%
- 2008→2024 swing
- -15.2pp toward R · 2008: -6.1pp · 2024: -21.3pp
- All cycles
- 2024: R+21.3 2020: R+15.5 2016: R+21.1 2012: R+5.3 2008: R+6.1
Not yet ingested
- Civics
- —
Market trends
- HPI YoY
- ▼ -83.30%
- Current HPI
- 292.0471
- Rent YoY
- —
- Metro
- —
- State GDP YoY
- ▲ 2.60%
- F500 in state
- 92
Industry mix (Fortune 500 HQ in NY)
| Industry | F500 HQs | Revenue |
|---|---|---|
| Financial Services | 10 | $950B |
|
||
| Consumer Goods | 9 | $162B |
|
||
| Insurance | 4 | $225B |
|
||
| Telecommunications | 2 | $144B |
|
||
| Pharmaceuticals | 2 | $112B |
|
||
| Media / Entertainment | 2 | $69B |
|
||
Price history
+148.1% since first listed4 events — show timeline
- 2026-04-27 Pending — CNYIS
- 2026-04-23 Listed $143,900 CNYIS
- 2011-08-24 Sold (MLS) $52,000 CNYIS
- 2011-04-04 Listed $58,000 CNYIS
Cash-flow waterfall
monthlySold comps — $/sqft
last 12 mo · ≤1 miLoading sold comps…