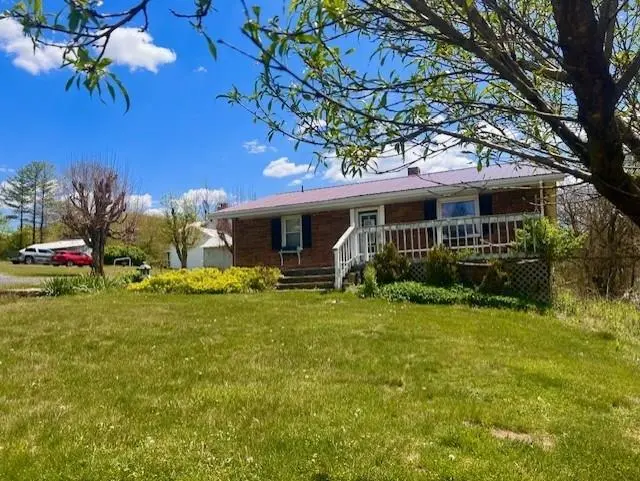
18 Lee St · Bland, VA
Flood risk 9/10 · Severe
- FEMA flood zone
- A
- Chance of flooding over 30 yrs
- 0.99%
- Est. flood insurance / yr
- $946 – $6,584
Fire risk 5/10 · Moderate
- Est. fire insurance / yr
- $666 – $1,236
Heat risk 3/10 · Minor
- Hot days now (above 90°F)
- 7 days/yr
- Hot days in 30 yrs
- 22 days/yr
Wind risk 2/10 · Minimal
- Chance of severe wind over 30 yrs
- 0.0%
Air-quality risk 1/10 · Minimal
- Unhealthy air days now
- 0 days/yr
- Unhealthy air days in 30 yrs
- 0 days/yr
Risk factors via First Street. Map © Google.
Why this score? — see what drove the C+ grade
The composite is a weighted blend of 9 inputs, each scored 0–100. Each bar is that input's sub-score; the figure is the points it added to the 100-point composite (weight × sub-score).
- Cash flow +19.8/30.0
- ARV discount +8.4/15.0
- Appreciation +7.7/10.0
- DSCR +6.3/10.0
- Schools +6.0/10.0
- 1% rule +4.0/10.0
- Livability +3.6/5.0
- Rent growth +2.5/5.0
- Condition / age +2.5/5.0
$125,000
🖨 Deal sheet (PDF) 📄 Offer letter ✓ Due diligence
Listing remarks
THIS CUTE COTTAGE IS CONVEINTLY LOCATED IN A SMALL HISTORICAL TOWN OF BLAND VIRGINIA!! IN THE HEART OF BEAUTIFUL SOUTHWEST VIRGINIA! ENJOY THE TRANQUILTY OF A SMALL STREAM AND YET WITHIN WALKING DISTANCE TO MAIN STREET!!
Key facts
- 0.5 acre lot
- Built 1952
- Listed 41 days
Tags
Property features AI
Exterior
- Utilities: Public water; Public sewer; Propane available
- Home design: Single-family residence; One story
- Construction: Brick construction; Metal roof
- Exterior features: Deck; Cleared corner lot; Level lot; Waterfront on a creek
Interior
- Kitchen: Electric range; Dishwasher
- Flooring: Tile; Wood
- Bathrooms: 1 full bathroom; 1 half bathroom
- Heating & cooling: Forced air heating; Oil heating; Propane heating
- Interior features: Insulated windows; Unfinished basement
- Laundry & utility: Washer; Dryer
Neighborhood map
What this means for you Summary
Snapshot
- This is a 3-bed/1.0-bath single-family listed at $125k.
Deal economics
- At list price, monthly cash flow is $-164 ($-2k/yr) — negative.
- To cash-flow at today's rent, offer at most $96k (23.2% below list).
- To meet the 1% rule (rent ≥ 1% of price), the offer needs to be $113k (9.6% below list).
- Recommended offer: $96k (23.2% below list) — sets the bar for cash-flow.
Location & tenants
- Location reads 72/100 on livability (#202 in VA) — a middle-class / working-renter tenant base. Strengths: cost of living A+, housing A+, health & safety A+; Watch: crime D+, employment D+, amenities F.
- Bland County Public School District (rural): math 62% / reading 80% proficiency, ranked #23 of 131 in VA (top 18%) — strong family-tenant draw, lease renewals of 3-5y typical.
- Zoned schools: Bland County Elementary (math 57% / reading 72%, grade B, #416 of 1,108 statewide, top 41%, 371 students, 67% FRL); Bland County High (math 62% / reading 87%, grade B+, #107 of 319 statewide, top 37%, 425 students, 68% FRL) — zoned schools average 67% FRL vs 32% district-wide (35 pts higher); higher-poverty schools than district average — tighter screening recommended.
- Market conditions: 21 active listings in the ZIP; 8 units permitted in Bland County in 2024 (0 in 5+ unit buildings).
Forward outlook
- In year one you build about $7k of equity ($864 loan paydown + $7k appreciation (5.3% local appreciation)).
- Bland County population projected at -20% by 2050 — secular population decline; favor cash flow + early exit over multi-decade hold.
- By year 5, paydown + projected appreciation supports a ~$33k cash-out refi (75% LTV) — recoverable capital for the next deal without selling this one.
Negotiation context
- It's been on market 42 days — a 3% lower offer ($121k) is reasonable based on typical stale-listing flexibility.
- 2 sale attempts with the ask held roughly flat each time — persistent listings suggest the price (not the market) is what's stuck; bring a comps-based counter.
- Current owner paid $16k; list at $125k implies a 681% gain — meaningful room to come down on a strong offer.
Risks & watch-outs
- Watch-outs: flood insurance adds $314/mo; built in 1952 — expect roof / HVAC / electrical / plumbing capex.
- Climate carrying-cost: in FEMA flood zone A (mandatory federal flood insurance); moderate wildfire risk — expect insurance premiums to compound above CPI over the hold.
Questions for the listing agent
- What do current leases actually rent for vs. the listed asking? Can we see a recent rent roll and the last 12 months of T-12 income?
- It's been on market 42 days. Have you received any prior offers? Is the seller open to a 23% concession, seller financing, or rate buy-down credit?
- Built in 1952 — when were the roof, HVAC, electrical panel, plumbing, and water heater last replaced?
- What's the actual annual flood-insurance premium (NFIP or private), and is the property in a SFHA with mandatory coverage?
- Is there a deadline driving the sale (1031 exchange, divorce, estate, relocation)? That informs how much negotiation room exists.
- Schools are A-rated — typically a magnet for longer-tenancy family renters. What's the average tenant stay here, and is there a school-zone premium baked into asking?
- Crime grade is D in this area — have there been break-ins, vandalism, or insurance claims at this property in the last 3 years? What carrier currently insures it and at what premium?
- What's the average days-on-market for RENTAL listings here right now (not sales)? A rising rental-DOM trend means longer vacancies and softer asking-rent achievability than the comps imply.
- What's the recent tenant-quality profile in this submarket — average credit score on applications, eviction rate, late-payment / NSF rate, and stable-employment percentage? A property-management company in the area should have these aggregated.
- How much new for-sale + rental construction is in the pipeline within 1–3 miles? Heavy new supply typically softens prices + rents 12–24 months out; constrained supply supports both.
Investment metrics
- 1% rule
- 0.90% ✗
- Cap rate
- 7.73%
- Cash-on-cash
- 5.13%
- DSCR
- 1.23
- GRM
- 9.2
CMA / ARV
- ARV (median comp)
- $127,688
- List price
- $125,000
- Delta
- -2.11%
- Verdict
- FAIR
- Comps
- 5 within 1.0 mi
Show comp detail 2 sales within ~0.75 mi
| Address | Dist | Beds/Ba | Sqft | Sold | Price | $/sf | Match |
|---|---|---|---|---|---|---|---|
| 2 3rd St | 0.07mi | 2/1.0 (-1) | 1,225 (-7%) | 1mo | $166,000 | $136 | 80 |
| 450 Seddon St | 0.09mi | 2/1.0 (-1) | 1,200 (-8%) | 21mo | $85,000 | $71 | 59 |
Match score weights: distance 35% · size 25% · config 20% · recency 20%. Top-matched comps best support the ARV.
Projected returns pro-forma
5.3% appreciation · 3.0% rent growth · sell at horizon
- IRR
- 9.0%
- Equity multiple
- 1.59×
- Total profit
- $20,672
- Equity at exit
- $73,157
- IRR
- 10.7%
- Equity multiple
- 3.02×
- Total profit
- $70,831
- Equity at exit
- $128,220
Cash invested: $35,000 (down + closing). Projections, not guarantees.
Landlord ↔ Tenant lean methodology
- Overall (STATE)
- 55 Moderately Landlord-Leaning
- State Virginia
- 55 Moderately Landlord-Leaning · D+2
- County
- — inherits STATE
- City
- — inherits STATE
ZIP-level market 24315
- Home prices YoY
- 3.3%
- Active inventory
- 21
- Price-to-rent
- 9.2×
Monthly cashflow live
- Estimated rent
- $1,130 medium interval (Pro) →
- Mortgage (P&I)
- −$656
- Tax from tax record
- −$36 /mo · $429/yr
- Insurance
- −$52
- Flood insurance flood zone
- −$314 /mo · $3,765/yr
- HOA
- −$0
- Vacancy / Maint / Mgmt
- −$237
- Net cashflow
- $-164
Break-even live
Sensitivity live
| Price | -10% $-93 | -5% $-129 | +0% $-164 | +5% $-200 | +10% $-235 |
|---|---|---|---|---|---|
| Rent | -10% $-253 | -5% $-209 | +0% $-164 | +5% $-120 | +10% $-75 |
| Rate | -1.0pp $-101 | -0.5pp $-132 | base $-164 | +0.5pp $-197 | +1.0pp $-230 |
UW: 25.0% down · 7.5% · 30yr · 1.5% tax · 5.0% vac · 8.0% maint · 8.0% mgmt
Financing live
Cash to close
- Down payment
- $31,250
- Closing costs
- $3,750
- Reserves months
- —
- Total cash needed
- —
Loan-product check · same deal, 3 products live
Conventional
25% down · 7.5% · 30yr
- Down + closing
- —
- Monthly P&I
- —
- Monthly cashflow
- —
- DSCR
- —
- Eligible?
- —
Personal DTI + credit; lowest rate.
DSCR
20% down · 8.5% · 30yr
- Down + closing
- —
- Monthly P&I
- —
- Monthly cashflow
- —
- DSCR
- —
- Eligible?
- —
No personal income docs; deal must DSCR.
Hard money
10% down · 12.0% · 12mo
- Down + closing
- —
- Monthly P&I
- —
- Monthly cashflow
- —
- DSCR
- —
- Eligible?
- —
Short-term bridge; refi at stabilization.
Listing history 10 events
-
2026-06-22days on market $125,000 Active 42 DOM
-
2026-06-21days on market $125,000 Active 41 DOM
-
2026-06-19days on market $125,000 Active 39 DOM
-
2026-06-18days on market $125,000 Active 38 DOM
-
2026-06-17days on market $125,000 Active 37 DOM
-
2026-06-16days on market $125,000 Active 36 DOM
-
2026-06-15days on market $125,000 Active 35 DOM
-
2026-06-14status $125,000 Active 33 DOM
-
2026-04-23$125,000 Active 220-char remark
-
1988-05-09soldstatus $16,000
ⓘ Source: listings_history table (triggers on properties + properties_extension) + one-shot
backfill from property_details.listing_events for pre-trigger history.
Tax reassessment forecast VA · Resets to sale price
- Current annual tax
- $429 · $36/mo
- Projected year-2 tax
- $1,025 · $85/mo
- Expected delta
- +$596/yr (+$50/mo · 138.9%)
ⓘ Screening estimate from a state-policy table — verify with the county assessor before closing.
Climate risk First Street
- Flood 9/10 Extreme FEMA zone A · 99% chance over 30 yrs
- Wildfire 5/10 Major
- Heat 3/10 Moderate 7 d/yr ≥90°F today · 22 d/yr by 30 yrs out
- Wind 2/10 Low 0% chance of damaging wind over 30 yrs
- Air quality 1/10 Low 0 unhealthy d/yr today · 0 by 30 yrs out
Nearby sold comps map
Loading sold comps map…
Walkable amenities ~0.75 mi
Loading nearby amenities…
Taxation est. · year 1
- Rental income
- $13,563
- − Mortgage interest
- −$7,002
- − Property taxes
- −$429
- − Insurance
- −$4,390
- − Repairs & maintenance
- −$1,085
- − Management
- −$1,085
- − Depreciation
- −$3,636
- Taxable loss
- −$4,064
- Est. tax savings @ 24.0%
- +$975
- After-tax cash flow
- $-995/yr
For passive investors: Depreciation is non-cash, so a rental often shows a tax loss while cash-flowing — sheltering income. Rental losses are passive: they offset passive income freely, and up to $25,000/yr can offset ordinary (W-2) income if you actively participate and your MAGI is under $100k (phasing out to $0 by $150k); unused losses carry forward. On sale, claimed depreciation is recaptured at up to 25%, and gains may owe capital-gains tax (a 1031 exchange can defer both). Figures are a year-1 estimate at your 24.0% rate — not tax advice; consult a CPA.
Schools (NCES district)
- District
- Bland County Public School District
- NCES district ID
- 5100390
- Math proficiency
- 62% ▼ -25.00%
- Reading proficiency
- 80% ▬ 0.00%
- Median HH income
- $44,048
- Composite
- 59.56/100
- National rank
- #917
- State rank
- #23 of 131 in VA
Livability — Bland
- Score
- 72/100
- State rank
- #202
- US rank
- #6245
Category grades
Schools grade is shown separately in the Schools card above.
Census & demographics
- Census place
- Bland, VA
- Population (ZIP)
- 3,789
Population outlook (Bland County) Hauer SSP2
- Today (2025)
- 6,172 people
- By 2030
- 5,928 · -4.0%
- By 2040
- 5,402 · -12.5%
- By 2050
- 4,926 · -20.2%
- By 2075
- 4,051 · -34.4%
- By 2100
- 3,028 · -50.9%
Race, ethnicity, and origin ACS 2023
- Neighborhood character
- Predominantly White (91%)
- Race & ethnicity
- White 91% Black 6% Two or more races 2% Hispanic / Latino 1%
- Common ancestry
- Serbian 2% Slovak 1% Lithuanian 1%
- Foreign-born
- 0%
- Languages at home
- 97% English-only · Spanish 2%
Political lean MEDSL · Bland
- 2024 margin
- Solid R (+69.7) · D 14.8% · R 84.5%
- 2008→2024 swing
- -30.3pp toward R · 2008: -39.4pp · 2024: -69.7pp
- All cycles
- 2024: R+69.7 2020: R+68.2 2016: R+67.8 2012: R+48.0 2008: R+39.4
Not yet ingested
- Civics
- —
Market trends
- HPI YoY
- ▲ 5.30%
- Current HPI
- 166.2616
- Rent YoY
- —
- Metro
- —
- State GDP YoY
- ▲ 2.40%
- F500 in state
- 50
Industry mix (Fortune 500 HQ in VA)
| Industry | F500 HQs | Revenue |
|---|---|---|
| Aerospace / Defense | 4 | $236B |
|
||
| Technology / Defense | 3 | $32B |
|
||
| Financial Services | 2 | $176B |
|
||
| Utilities | 2 | $27B |
|
||
| Insurance | 2 | $25B |
|
||
| Technology | 2 | $15B |
|
||
Price history
+681.2% since first listed4 events — show timeline
- 2026-06-13 Relisted — SWVAR
- 2026-05-26 Pending — SWVAR
- 2026-04-23 Listed $125,000 SWVAR
- 1988-05-09 Sold (Public Records) $16,000 Public Records
Property tax history
-0.6%/yrLatest (2025): $429 · +0.0% YoY. Source: county tax records.
Cash-flow waterfall
monthlySold comps — $/sqft
last 12 mo · ≤1 miLoading sold comps…