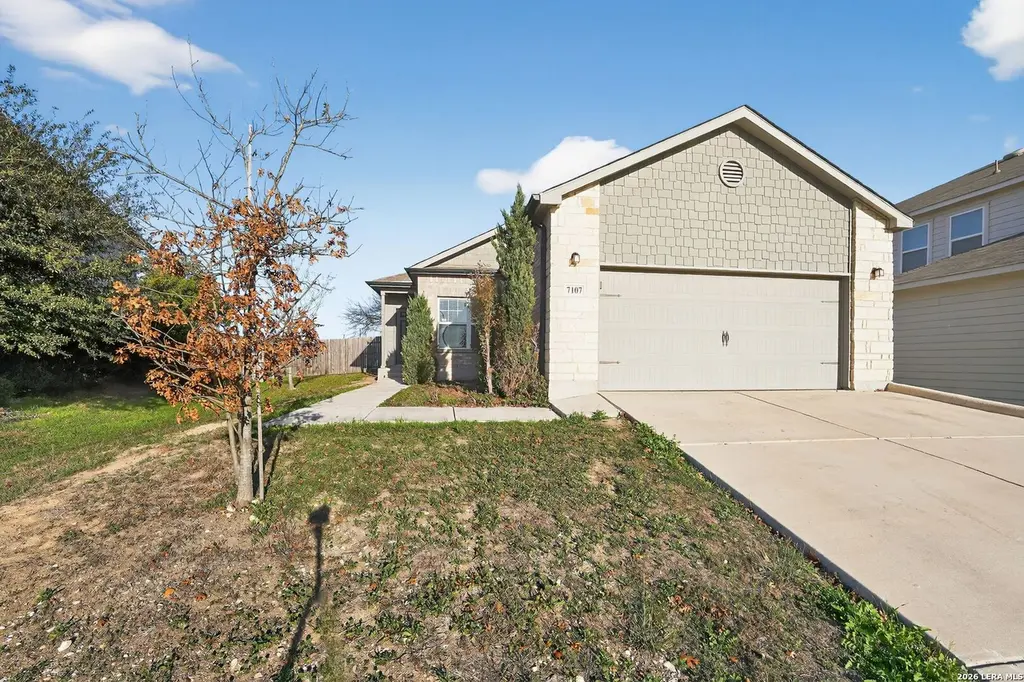
7107 Capricorn Way · San Antonio, TX
Flood risk 1/10 · Minimal
- FEMA flood zone
- X (unshaded)
- Chance of flooding over 30 yrs
- 0.0%
- Est. flood insurance / yr
- $507 – $1,088
Fire risk 4/10 · Minor
- Est. fire insurance / yr
- $1,222 – $2,270
Heat risk 8/10 · Major
- Hot days now (above 108°F)
- 7 days/yr
- Hot days in 30 yrs
- 22 days/yr
Wind risk 8/10 · Major
- Chance of severe wind over 30 yrs
- 80.0%
Air-quality risk 1/10 · Minimal
- Unhealthy air days now
- 0 days/yr
- Unhealthy air days in 30 yrs
- 0 days/yr
Risk factors via First Street. Map © Google.
Why this score? — see what drove the D grade
The composite is a weighted blend of 9 inputs, each scored 0–100. Each bar is that input's sub-score; the figure is the points it added to the 100-point composite (weight × sub-score).
- ARV discount +15.0/15.0
- Cash flow +8.2/30.0
- Livability +4.0/5.0
- 1% rule +3.5/10.0
- Condition / age +2.5/5.0
- Schools +2.4/10.0
- DSCR +2.2/10.0
- Rent growth +2.2/5.0
- Appreciation +0.0/10.0
$209,900
🖨 Deal sheet (PDF) 📄 Offer letter ✓ Due diligence
Listing remarks MLS
Fall in love with this beautiful 3-bedroom, 2-bathroom gem in the premier Horizon Pointe subdivision. Featuring a bright and airy open-concept floor plan, this home is perfect for modern living. The spacious kitchen flows effortlessly into the living area, while the private primary suite offers a serene escape. Enjoy the incredible community amenities, including a resort-style pool, basketball courts, and multiple playgrounds. Located just a stone's throw from Masters Elementary and minutes from Randolph AFB and major highways, this home offers the ultimate in convenience and comfort. No city taxes and a low HOA make this an unbeatable value in Converse. Schedule your showing today!
Key facts
- Multiple playgrounds
- Community amenities
- Resort-style pool
Tags
Neighborhood map
What this means for you Summary
Snapshot
- This is a 3-bed/2.0-bath single-family listed at $210k.
Deal economics
- At list price, monthly cash flow is $-195 ($-2k/yr) — negative.
- To cash-flow at today's rent, offer at most $175k (16.4% below list).
- To meet the 1% rule (rent ≥ 1% of price), the offer needs to be $178k (15.0% below list).
- Recommended offer: $175k (16.4% below list) — sets the bar for cash-flow.
- Cap rate 5.2% vs local median 3.8% in San Antonio — top-decile yield for the area; either an underpriced asset or a hidden risk that comps aren't pricing in. Stress-test before assuming the spread holds.
Location & tenants
- Location reads 80/100 on livability (#31 in TX, #1,616 nationally) — a professional / high-income tenant draw. Strengths: amenities A+, commute A+, cost of living A+; Watch: crime F.
- Judson ISD (suburban): math 21% / reading 33% proficiency, ranked #660 of 826 in TX (top 80%) — low school quality limits family demand, transient renter base, plan for 1-2y turnover.
- Zoned schools: James L Masters (math 17% / reading 32%, grade F, #3,052 of 4,322 statewide, top 74%, 802 students, 66% FRL); Henry Metzger Middle (math 12% / reading 20%, grade F, #1,543 of 1,662 statewide, top 94%, 953 students, 90% FRL); Karen Wagner H S (math 12% / reading 29%, grade F, #1,389 of 1,632 statewide, top 86%, 2,366 students, 80% FRL) — zoned schools average 79% FRL vs 57% district-wide (22 pts higher); higher-poverty schools than district average — tighter screening recommended.
- Market conditions: Rents soft (-1.1%/yr); 1207 active listings in the ZIP; 40 comparable units currently listed for rent nearby; rentals at typical pace (median 15d on market — plan ~3-4 weeks tenant-placement turnaround); solid renter incomes; 8,308 units permitted in Bexar County in 2024 (2,506 in 5+ unit buildings).
Forward outlook
- Local home prices are declining (-3.0%/yr); year-one equity from $1k of loan paydown is wiped out by about $6k of value loss. Plan a longer hold.
- Bexar County population projected at +50% by 2050 — long-run rental-demand tailwind backs the buy-and-hold thesis.
Negotiation context
- It's been on market 103 days — a 9% lower offer ($191k) is reasonable based on typical stale-listing flexibility.
- 2 sale attempts since 2y ago; this cycle's ask has dropped $35k (14%) from the opening price — seller is motivated, your offer sets the floor, not the list.
Risks & watch-outs
- Climate carrying-cost: severe wind risk, 80% chance of damaging wind over 30y; extreme-heat days projected 7→22/yr by 2055 (HVAC capex compounding) — expect insurance premiums to compound above CPI over the hold.
Questions for the listing agent
- What do current leases actually rent for vs. the listed asking? Can we see a recent rent roll and the last 12 months of T-12 income?
- It's been on market 103 days. Have you received any prior offers? Is the seller open to a 16% concession, seller financing, or rate buy-down credit?
- What does the HOA fee cover, when was the last increase, and are there any pending special assessments or reserve-fund shortfalls?
- Why hasn't it sold? Are there any deal-killer items the seller is aware of (foundation, flood, title, zoning, code violations)?
- Is there a deadline driving the sale (1031 exchange, divorce, estate, relocation)? That informs how much negotiation room exists.
- Crime grade is F in this area — have there been break-ins, vandalism, or insurance claims at this property in the last 3 years? What carrier currently insures it and at what premium?
- The area grade is low — what's the realistic commute time and amenity access for the typical tenant pool here? Any planned neighborhood developments (good or bad) we should know about?
- What's the average days-on-market for RENTAL listings here right now (not sales)? A rising rental-DOM trend means longer vacancies and softer asking-rent achievability than the comps imply.
- What's the recent tenant-quality profile in this submarket — average credit score on applications, eviction rate, late-payment / NSF rate, and stable-employment percentage? A property-management company in the area should have these aggregated.
- How much new for-sale + rental construction is in the pipeline within 1–3 miles? Heavy new supply typically softens prices + rents 12–24 months out; constrained supply supports both.
Investment metrics
- 1% rule
- 0.85% ✗
- Cap rate
- 5.18%
- Cash-on-cash
- -3.99%
- DSCR
- 0.82
- GRM
- 9.8
CMA / ARV
- ARV (median comp)
- $268,478
- List price
- $209,900
- Delta
- -21.82%
- Verdict
- UNDERPRICED
- Comps
- 20 within 1.0 mi
Show comp detail 12 sales within ~0.75 mi
| Address | Dist | Beds/Ba | Sqft | Sold | Price | $/sf | Match |
|---|---|---|---|---|---|---|---|
| 3019 Pacific Coast | 0.36mi | 3/2.0 | 1,654 (-1%) | 1mo | $245,000 | $148 | 82 |
| 2719 Pismo Bch | 0.03mi | 3/2.0 | 1,794 (+8%) | 6mo | $259,900 | $145 | 80 |
| 7231 Lunar Eclipse | 0.29mi | 4/2.0 (+1) | 1,755 (+6%) | 2mo | $284,900 | $162 | 71 |
| 7235 Lunar Eclipse | 0.29mi | 4/2.0 (+1) | 1,751 (+5%) | 3mo | $278,000 | $159 | 71 |
| 2615 Wolf Moon | 0.14mi | 3/2.0 | 1,885 (+13%) | 2mo | $340,000 | $180 | 70 |
| 7110 Pisces | 0.40mi | 3/2.0 | 1,612 (-3%) | 9mo | $275,000 | $171 | 68 |
| 7510 Josephs Way | 0.70mi | 3/2.0 | 1,664 (0%) | 3mo | $209,900 | $126 | 65 |
| 7118 Azure Waters | 0.35mi | 3/2.0 | 1,435 (-14%) | 4mo | $225,000 | $157 | 57 |
| 6818 Lucky Flds | 0.72mi | 3/2.0 | 1,708 (+3%) | 9mo | $239,999 | $141 | 55 |
| 3017 Neptunes Sea | 0.39mi | 4/2.0 (+1) | 1,459 (-12%) | 2mo | $234,995 | $161 | 54 |
| 3448 Meteor Night | 0.47mi | 3/2.0 | 1,428 (-14%) | 5mo | $312,990 | $219 | 50 |
| 3404 Taurus Sky | 0.49mi | 4/2.0 (+1) | 1,895 (+14%) | 2mo | $260,000 | $137 | 47 |
Match score weights: distance 35% · size 25% · config 20% · recency 20%. Top-matched comps best support the ARV.
Projected returns pro-forma
-3.0% appreciation · 0.0% rent growth · sell at horizon
- IRR
- -26.8%
- Equity multiple
- 0.12×
- Total profit
- $-51,554
- Equity at exit
- $31,297
- IRR
- -41.8%
- Equity multiple
- -0.37×
- Total profit
- $-80,617
- Equity at exit
- $18,148
Cash invested: $58,772 (down + closing). Projections, not guarantees.
Landlord ↔ Tenant lean methodology
- Overall (STATE)
- 87 Strongly Landlord-Friendly
- State Texas
- 87 Strongly Landlord-Friendly · R+5
- County
- — inherits STATE
- City
- — inherits STATE
ZIP-level market 78109
- Home prices YoY
- -17.8%
- Rents YoY
- -1.1%
- Active inventory
- 1207
- Price-to-rent
- 9.8×
Monthly cashflow live
- Estimated rent
- $1,784 high interval (Pro) →
- Mortgage (P&I)
- −$1,101
- Tax from tax record
- −$381 /mo · $4,567/yr
- Insurance
- −$87
- HOA
- −$36
- Vacancy / Maint / Mgmt
- −$375
- Net cashflow
- $-195
Break-even live
Sensitivity live
| Price | -10% $-76 | -5% $-136 | +0% $-195 | +5% $-255 | +10% $-314 |
|---|---|---|---|---|---|
| Rent | -10% $-336 | -5% $-266 | +0% $-195 | +5% $-125 | +10% $-54 |
| Rate | -1.0pp $-90 | -0.5pp $-142 | base $-195 | +0.5pp $-250 | +1.0pp $-305 |
UW: 25.0% down · 7.5% · 30yr · 1.5% tax · 5.0% vac · 8.0% maint · 8.0% mgmt
Financing live
Cash to close
- Down payment
- $52,475
- Closing costs
- $6,297
- Reserves months
- —
- Total cash needed
- —
Loan-product check · same deal, 3 products live
Conventional
25% down · 7.5% · 30yr
- Down + closing
- —
- Monthly P&I
- —
- Monthly cashflow
- —
- DSCR
- —
- Eligible?
- —
Personal DTI + credit; lowest rate.
DSCR
20% down · 8.5% · 30yr
- Down + closing
- —
- Monthly P&I
- —
- Monthly cashflow
- —
- DSCR
- —
- Eligible?
- —
No personal income docs; deal must DSCR.
Hard money
10% down · 12.0% · 12mo
- Down + closing
- —
- Monthly P&I
- —
- Monthly cashflow
- —
- DSCR
- —
- Eligible?
- —
Short-term bridge; refi at stabilization.
Rent comps 40 comps
| Address | Beds | Baths | Sqft | Rent | $/sqft | DOM | Units | Dist |
|---|---|---|---|---|---|---|---|---|
| 7022 Phoenix Path Converse, TX | 3.0 | 2.0 | 1209 | $1,750 | $1.45 | 18d | 1 | 0.21mi |
| 2411 Woodlake Pkwy Converse, TX | 1.0–4.0 | 1.0–2.0 | 1083 | $1,504 | $1.39 | 3d | 18 | 0.23mi |
| 3123 Saturn Path Converse, TX | 3.0 | 2.5 | 1935 | $1,975 | $1.02 | 6d | 1 | 0.27mi |
| 6926 Opal Clfs Converse, TX | 3.0 | 2.0 | 1274 | $1,525 | $1.20 | 6d | 1 | 0.28mi |
| 6926 Opal Clfs Converse, TX | 3.0 | 2.0 | 1274 | $1,550 | $1.22 | 19d | 1 | 0.28mi |
| 7163 Lunar Eclipse Converse, TX | 3.0 | 2.5 | 1935 | $2,200 | $1.14 | 12d | 1 | 0.30mi |
| 3023 Laguna Clfs Converse, TX | 3.0 | 2.0 | 1342 | $1,650 | $1.23 | 5d | 1 | 0.36mi |
| 2715 Point Sur Converse, TX | 4.0 | 2.5 | 2056 | $1,785 | $0.87 | 6d | 1 | 0.37mi |
| 7111 Azure Waters Converse, TX | 3.0 | 2.0 | 1654 | $1,800 | $1.09 | 16d | 1 | 0.41mi |
| 2409 Key Hole Vw Converse, TX | 3.0 | 2.0 | 1602 | $1,600 | $1.00 | 14d | 1 | 0.48mi |
| 3619 Storm Moon Converse, TX | 3.0 | 2.0 | 1620 | $1,695 | $1.05 | 45d | 1 | 0.58mi |
| 6634 Poseidon Way Converse, TX | 4.0 | 2.5 | 1990 | $1,750 | $0.88 | 23d | 1 | 0.61mi |
| 6634 Poseidon Way Converse, TX | 4.0 | 2.5 | 1990 | $1,750 | $0.88 | 45d | 1 | 0.61mi |
| 6615 Port Elizabeth Converse, TX | 3.0 | 2.0 | 1596 | $1,489 | $0.93 | 6d | 1 | 0.62mi |
| 6703 Foster Flds Converse, TX | 4.0 | 2.0 | 1894 | $1,850 | $0.98 | 16d | 1 | 0.68mi |
| 6941 Sunspot Converse, TX | 3.0 | 2.0 | 1355 | $1,240 | $0.92 | 14d | 1 | 0.69mi |
| 3907 Josephs Run Converse, TX | 4.0 | 2.5 | 2144 | $1,719 | $0.80 | 18d | 1 | 0.71mi |
| 3422 Dunlap Flds Converse, TX | 3.0 | 2.0 | 1450 | $1,540 | $1.06 | 22d | 1 | 0.72mi |
| 3907 Josephs Way Converse, TX | 4.0 | 2.5 | 2144 | $1,719 | $0.80 | 16d | 1 | 0.73mi |
| 3814 Pickles Way Converse, TX | 3.0 | 2.0 | 1450 | $1,595 | $1.10 | 45d | 1 | 0.73mi |
| 3711 Colemans Run Converse, TX | 3.0 | 2.0–2.5 | 1380 | $1,552 | $1.12 | 4d | 1 | 0.74mi |
| 6503 Davenport Bay Converse, TX | 3.0 | 2.0 | 1494 | $1,786 | $1.20 | 0d | 1 | 0.75mi |
| 2338 Camberly Vw Converse, TX | 4.0 | 3.0 | 2122 | $1,850 | $0.87 | 25d | 1 | 0.75mi |
| 3511 Dunlap Flds Converse, TX | 3.0 | 2.0 | 1317 | $1,650 | $1.25 | 12d | 1 | 0.77mi |
| 6510 Poseidon Way Converse, TX | 3.0 | 2.0 | 1408 | $1,539 | $1.09 | 4d | 1 | 0.77mi |
| 6527 San Miguel Way Converse, TX | 3.0 | 2.5 | 2042 | $1,475 | $0.72 | 45d | 1 | 0.77mi |
| 6458 Candleview Ct San Antonio, TX | 4.0 | 2.5 | 2008 | $1,645 | $0.82 | 6d | 1 | 0.82mi |
| 3603 Aranda Flds Converse, TX | 3.0 | 2.0 | 1346 | $1,650 | $1.23 | 45d | 1 | 0.82mi |
| 7516 Rose Robin Run Ct Converse, TX | 3.0 | 2.0 | 1612 | $1,599 | $0.99 | 6d | 1 | 0.84mi |
| 7528 Rose Robin Run Ct Converse, TX | 3.0 | 2.0 | 1651 | $1,575 | $0.95 | 6d | 1 | 0.86mi |
| 2610 Green Leaf Way San Antonio, TX | 3.0 | 2.5 | 2003 | $1,995 | $1.00 | 12d | 1 | 0.86mi |
| 2631 Green Leaf Way San Antonio, TX | 4.0 | 2.5 | 1918 | $1,689 | $0.88 | 25d | 1 | 0.89mi |
| 3327 Candlemoon Dr San Antonio, TX | 3.0 | 2.0 | 1344 | $1,550 | $1.15 | 45d | 1 | 0.91mi |
| 6402 Candlewick Ct San Antonio, TX | 4.0 | 2.5 | 2008 | $1,790 | $0.89 | 6d | 1 | 0.92mi |
| 6402 Candleview Ct San Antonio, TX | 3.0 | 2.0 | 1319 | $1,499 | $1.14 | 6d | 1 | 0.92mi |
| 2607 Bluff Xing San Antonio, TX | 3.0 | 2.5 | 2241 | $1,650 | $0.74 | 6d | 1 | 0.95mi |
| 6734 Summer Fest Dr San Antonio, TX | 3.0 | 2.5 | 1225 | $1,550 | $1.27 | 3d | 8 | 0.95mi |
| 6523 Candlecrest Ct San Antonio, TX | 4.0 | 2.0 | 1905 | $1,930 | $1.01 | 45d | 1 | 0.97mi |
| 6734 Summer Fest Dr Unit 130 San Antonio, TX | 3.0 | 2.5 | 1225 | $1,600 | $1.31 | 25d | 1 | 0.97mi |
| 6734 Summer Fest Dr Unit 108 San Antonio, TX | 3.0 | 2.5 | 1225 | $1,450 | $1.18 | 46d | 1 | 0.97mi |
HOA detail
- Monthly dues
- $36 · $432/yr
- Likely covers
- landscapingpool
Listing history 15 events
-
2026-06-04status $209,900 Pending 103 DOM
-
2026-06-03days on market $209,900 Active Option 103 DOM
-
2026-06-02days on market $209,900 Active Option 102 DOM
-
2026-06-01days on market $209,900 Active Option 101 DOM
-
2026-05-31days on market $209,900 Active Option 100 DOM
-
2026-05-15price $219,900 691-char remark
Show marketing remark (691 chars)
Fall in love with this beautiful 3-bedroom, 2-bathroom gem in the premier Horizon Pointe subdivision. Featuring a bright and airy open-concept floor plan, this home is perfect for modern living. The spacious kitchen flows effortlessly into the living area, while the private primary suite offers a serene escape. Enjoy the incredible community amenities, including a resort-style pool, basketball courts, and multiple playgrounds. Located just a stone's throw from Masters Elementary and minutes from Randolph AFB and major highways, this home offers the ultimate in convenience and comfort. No city taxes and a low HOA make this an unbeatable value in Converse. Schedule your showing today!
-
2026-04-18price $229,900 691-char remark
Show marketing remark (691 chars)
Fall in love with this beautiful 3-bedroom, 2-bathroom gem in the premier Horizon Pointe subdivision. Featuring a bright and airy open-concept floor plan, this home is perfect for modern living. The spacious kitchen flows effortlessly into the living area, while the private primary suite offers a serene escape. Enjoy the incredible community amenities, including a resort-style pool, basketball courts, and multiple playgrounds. Located just a stone's throw from Masters Elementary and minutes from Randolph AFB and major highways, this home offers the ultimate in convenience and comfort. No city taxes and a low HOA make this an unbeatable value in Converse. Schedule your showing today!
-
2026-03-27price $234,900 691-char remark
Show marketing remark (691 chars)
Fall in love with this beautiful 3-bedroom, 2-bathroom gem in the premier Horizon Pointe subdivision. Featuring a bright and airy open-concept floor plan, this home is perfect for modern living. The spacious kitchen flows effortlessly into the living area, while the private primary suite offers a serene escape. Enjoy the incredible community amenities, including a resort-style pool, basketball courts, and multiple playgrounds. Located just a stone's throw from Masters Elementary and minutes from Randolph AFB and major highways, this home offers the ultimate in convenience and comfort. No city taxes and a low HOA make this an unbeatable value in Converse. Schedule your showing today!
-
2026-02-20$244,900 New 691-char remark
Show marketing remark (691 chars)
Fall in love with this beautiful 3-bedroom, 2-bathroom gem in the premier Horizon Pointe subdivision. Featuring a bright and airy open-concept floor plan, this home is perfect for modern living. The spacious kitchen flows effortlessly into the living area, while the private primary suite offers a serene escape. Enjoy the incredible community amenities, including a resort-style pool, basketball courts, and multiple playgrounds. Located just a stone's throw from Masters Elementary and minutes from Randolph AFB and major highways, this home offers the ultimate in convenience and comfort. No city taxes and a low HOA make this an unbeatable value in Converse. Schedule your showing today!
-
2024-12-08historical $1,499
-
2024-11-22price $1,549
-
2024-11-01price $1,599
-
2024-10-25price $1,645
-
2024-10-15$1,685
-
2022-07-13price $1,650
ⓘ Source: listings_history table (triggers on properties + properties_extension) + one-shot
backfill from property_details.listing_events for pre-trigger history.
Tax reassessment forecast TX · Resets to sale price
- Current annual tax
- $4,567 · $381/mo
- Projected year-2 tax
- $4,567 · $381/mo
- Expected delta
- $0/yr ($0/mo · 0.0%)
ⓘ Screening estimate from a state-policy table — verify with the county assessor before closing.
Climate risk First Street
- Flood 1/10 Low FEMA zone X (unshaded) · 0% chance over 30 yrs
- Wildfire 4/10 Moderate
- Heat 8/10 Severe 7 d/yr ≥108°F today · 22 d/yr by 30 yrs out
- Wind 8/10 Severe 80% chance of damaging wind over 30 yrs
- Air quality 1/10 Low 0 unhealthy d/yr today · 0 by 30 yrs out
Nearby sold comps map
Loading sold comps map…
Walkable amenities ~0.75 mi
Loading nearby amenities…
Taxation est. · year 1
- Rental income
- $21,410
- − Mortgage interest
- −$11,758
- − Property taxes
- −$4,567
- − Insurance
- −$1,050
- − Repairs & maintenance
- −$1,713
- − Management
- −$1,713
- − HOA
- −$432
- − Depreciation
- −$6,106
- Taxable loss
- −$5,927
- Est. tax savings @ 24.0%
- +$1,423
- After-tax cash flow
- $-920/yr
For passive investors: Depreciation is non-cash, so a rental often shows a tax loss while cash-flowing — sheltering income. Rental losses are passive: they offset passive income freely, and up to $25,000/yr can offset ordinary (W-2) income if you actively participate and your MAGI is under $100k (phasing out to $0 by $150k); unused losses carry forward. On sale, claimed depreciation is recaptured at up to 25%, and gains may owe capital-gains tax (a 1031 exchange can defer both). Figures are a year-1 estimate at your 24.0% rate — not tax advice; consult a CPA.
Schools (NCES district)
- District
- Judson ISD
- NCES district ID
- 4824990
- Math proficiency
- 21% ▼ -21.00%
- Reading proficiency
- 33% ▼ -7.00%
- Median HH income
- $57,542
- Composite
- 24.39/100
- National rank
- #7689
- State rank
- #660 of 826 in TX
Livability — San Antonio
- Score
- 80/100
- State rank
- #31
- US rank
- #1616
Category grades
Schools grade is shown separately in the Schools card above.
Census & demographics
- County
- Bexar County · 1,990,555 people
- City population
- 1,806,925
- Metro
- San Antonio-New Braunfels, TX
- Population (ZIP)
- 63,067
- Household income
- $91,320
- Rent vs Own
- Severe rent burden
- 1732.0
Population outlook (Bexar County) Hauer SSP2
- Today (2025)
- 2,336,851 people
- By 2030
- 2,560,728 · +9.6%
- By 2040
- 3,020,569 · +29.3%
- By 2050
- 3,493,522 · +49.5%
- By 2075
- 4,668,459 · +99.8%
- By 2100
- 5,533,242 · +136.8%
Race, ethnicity, and origin ACS 2023
- Neighborhood character
- Diverse neighborhood (Simpson 0.69)
- Race & ethnicity
- Hispanic / Latino 44% White 27% Two or more races 21% Black 21% Asian 3%
- Hispanic origin (detail)
- Mexican 29% Puerto Rican 4%
- Common ancestry
- Lithuanian 1% Romanian 1% Italian 1%
- Foreign-born
- 11% · Canada, Vietnam, South Korea
- Languages at home
- 71% English-only · Spanish 23% Tagalog/Filipino 1% Other Asian/Pacific 1%
Political lean MEDSL · Bexar
- 2024 margin
- Lean D (+9.8) · D 54.3% · R 44.6% · Other 1.1%
- 2008→2024 swing
- +4.2pp toward D · 2008: 5.6pp · 2024: 9.8pp
- All cycles
- 2024: D+9.8 2020: D+18.2 2016: D+13.5 2012: D+4.6 2008: D+5.6
Not yet ingested
- Civics
- —
Market trends
- HPI YoY
- ▼ -51.02%
- Current HPI
- 236.4923
- Rent YoY
- ▼ -1.08%
- Metro
- San Antonio-New Braunfels, TX
- State GDP YoY
- ▲ 3.95%
- F500 in state
- 110
Industry mix (Fortune 500 HQ in TX)
| Industry | F500 HQs | Revenue |
|---|---|---|
| Energy | 16 | $1,198B |
|
||
| Technology | 5 | $198B |
|
||
| Engineering / Construction | 4 | $72B |
|
||
| Energy Services | 3 | $60B |
|
||
| Utilities | 3 | $41B |
|
||
| Healthcare | 2 | $330B |
|
||
Price history
+13227.3% since first listed10 events — show timeline
- 2026-05-15 Price Changed $219,900 LERA
- 2026-04-18 Price Changed $229,900 LERA
- 2026-03-27 Price Changed $234,900 LERA
- 2026-02-20 Listed $244,900 LERA
- 2024-12-08 Rental Removed $1,499 RENT.
- 2024-11-22 Price Changed $1,549 RENT.
- 2024-11-01 Price Changed $1,599 RENT.
- 2024-10-25 Price Changed $1,645 RENT.
- 2024-10-15 Listed for Rent $1,685 RENT.
- 2022-07-13 Price Changed $1,650 RENT.
Property tax history
+33.2%/yrLatest (2025): $4,567 · -12.7% YoY. Source: county tax records.
Cash-flow waterfall
monthlySold comps — $/sqft
last 12 mo · ≤1 miLoading sold comps…