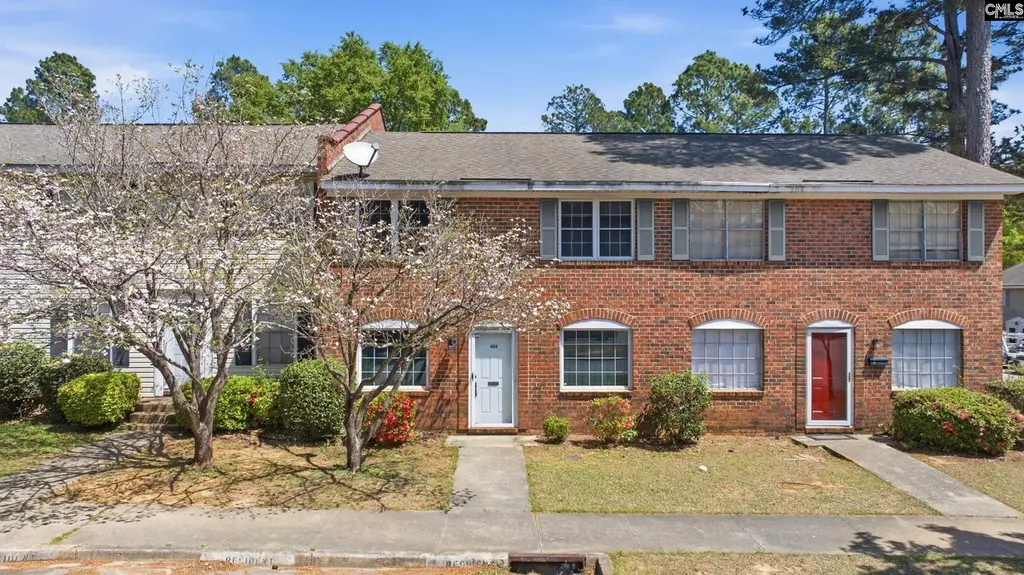
404 Wimbledon Ct · St. Andrews, SC
Flood risk 1/10 · Minimal
- FEMA flood zone
- X (unshaded)
- Chance of flooding over 30 yrs
- 0.0%
- Est. flood insurance / yr
- $507 – $1,088
Fire risk 1/10 · Minimal
- Est. fire insurance / yr
- $783 – $1,453
Heat risk 7/10 · Major
- Hot days now (above 108°F)
- 7 days/yr
- Hot days in 30 yrs
- 16 days/yr
Wind risk 6/10 · Moderate
- Chance of severe wind over 30 yrs
- 69.0%
Air-quality risk 3/10 · Minor
- Unhealthy air days now
- 2 days/yr
- Unhealthy air days in 30 yrs
- 2 days/yr
Risk factors via First Street. Map © Google.
Why this score? — see what drove the D grade
The composite is a weighted blend of 9 inputs, each scored 0–100. Each bar is that input's sub-score; the figure is the points it added to the 100-point composite (weight × sub-score).
- Cash flow +11.4/30.0
- ARV discount +7.5/15.0
- 1% rule +6.0/10.0
- Appreciation +5.0/10.0
- DSCR +3.4/10.0
- Schools +2.6/10.0
- Rent growth +2.5/5.0
- Livability +2.5/5.0
- Condition / age +2.5/5.0
$115,000
🖨 Deal sheet 📄 Offer letter ✓ Due diligence
Listing remarks
Price Improvement!! Welcome to 404 Wimbledon Ct, where style, comfort, and refined updates come together in one inviting residence. This beautifully updated condo offers 3 bedrooms, 2.5 bathrooms, and approximately 1,500 square feet of thoughtfully designed living space. Luxury vinyl flooring flows seamlessly throughout the home, creating a sophisticated and modern aesthetic. The kitchen is a true standout, featuring upgraded countertops and top-of-the-line tilework that adds elegance and visual appeal to the heart of the home. Designed for both everyday living and effortless entertaining, the interior features spacious, light-filled rooms with a warm, elevated feel. Step outside to a charm
Key facts
- Upgraded countertops
- Private sitting area
- $363 HOA
Tags
Property features AI
Finance
- Other: Paved road access
- HOA & community: Community association present; Association dues include common area maintenance
Exterior
- Parking: Two parking spaces
- Utilities: Public water; Public sewer
- Home design: Residential property
- Construction: Slab foundation
- Exterior features: Brick exterior above foundation on all sides; Private pool
Interior
- Kitchen: Kitchen located on the main level
- Bedrooms: Master bedroom on the second floor; Additional bedrooms on the second floor with ceiling fan in bedroom 2
- Flooring: Luxury vinyl plank flooring
- Bathrooms: Two full bathrooms; One half bathroom; One partial bathroom
- Heating & cooling: Central heating; Central air conditioning
- Interior features: Luxury vinyl plank flooring in living and formal dining areas; Main-level formal living room and dining room; Main-level kitchen; Main-level laundry
- Laundry & utility: Washer and dryer located on the main level
Neighborhood map
What this means for you Summary
Snapshot
- This is a 2-bed/2.0-bath condo listed at $115k.
Deal economics
- At list price, monthly cash flow is $-39 ($-469/yr) — negative.
- To cash-flow at today's rent, offer at most $108k (6.0% below list).
- Meets the 1% rule at list price ($1k rent vs $115k).
- Recommended offer: $108k (6.0% below list) — sets the bar for cash-flow.
Location & tenants
- Location reads: area grade D — affects rentability + tenant quality, not the cash-flow math above.
- Richland 01 (urban): math 26% / reading 36% proficiency, ranked #54 of 80 in SC (top 68%) — families likely to look elsewhere, expect single-tenant / working-renter base with shorter leases; 64% free/reduced lunch — lower-income household profile, screen leases tightly.
- Zoned schools: H. B. Rhame Elementary (math 15% / reading 20%, grade F, #512 of 597 statewide, top 86%, 446 students, 100% FRL); Columbia High (math 17% / reading 67%, grade F, #174 of 196 statewide, top 90%, 665 students, 100% FRL) — zoned schools average 100% FRL vs 64% district-wide (36 pts higher); higher-poverty schools than district average — tighter screening recommended.
- Market conditions: 1 active listings in the ZIP; 22 comparable units currently listed for rent nearby; rentals at typical pace (median 19d on market — plan ~3-4 weeks tenant-placement turnaround); 3,472 units permitted in Richland County in 2024 (1,096 in 5+ unit buildings).
Forward outlook
- In year one you build about $4k of equity ($795 loan paydown + $3k appreciation (3.0% local appreciation)).
- Richland County population projected at +30% by 2050 — long-run rental-demand tailwind backs the buy-and-hold thesis.
- At projected returns (3.0% appreciation + 3.0% rent growth), your $32k cash investment doubles in ~7 years — after that, you're playing with house money.
- By year 8, paydown + projected appreciation supports a ~$31k cash-out refi (75% LTV) — recoverable capital for the next deal without selling this one.
Negotiation context
- It's been on market 71 days — a 6% lower offer ($108k) is reasonable based on typical stale-listing flexibility.
- Current owner paid $40k; list at $115k implies a 188% gain — meaningful room to come down on a strong offer.
Risks & watch-outs
- Watch-outs: HOA is 29% of rent.
- Climate carrying-cost: major wind risk, 69% chance of damaging wind over 30y; extreme-heat days projected 7→16/yr by 2055 (HVAC capex compounding) — expect insurance premiums to compound above CPI over the hold.
Questions for the listing agent
- What do current leases actually rent for vs. the listed asking? Can we see a recent rent roll and the last 12 months of T-12 income?
- It's been on market 71 days. Have you received any prior offers? Is the seller open to a 6% concession, seller financing, or rate buy-down credit?
- Built in 1972 — when were the roof, HVAC, electrical panel, plumbing, and water heater last replaced?
- What does the HOA fee cover, when was the last increase, and are there any pending special assessments or reserve-fund shortfalls?
- Any open or pending special assessments — roof, HVAC, plumbing, elevator, façade? What's the per-unit balance and payoff schedule, and is the seller paying it off at close or rolling it to the buyer?
- Why hasn't it sold? Are there any deal-killer items the seller is aware of (foundation, flood, title, zoning, code violations)?
- Is there a deadline driving the sale (1031 exchange, divorce, estate, relocation)? That informs how much negotiation room exists.
- The area grade is low — what's the realistic commute time and amenity access for the typical tenant pool here? Any planned neighborhood developments (good or bad) we should know about?
- What's the average days-on-market for RENTAL listings here right now (not sales)? A rising rental-DOM trend means longer vacancies and softer asking-rent achievability than the comps imply.
- What's the recent tenant-quality profile in this submarket — average credit score on applications, eviction rate, late-payment / NSF rate, and stable-employment percentage? A property-management company in the area should have these aggregated.
- How much new apartment / multifamily construction is in the pipeline within 1–3 miles? Heavy new supply (>2% of stock underway) typically softens rents 12–24 months out; light construction supports rent growth.
Investment metrics
- 1% rule
- 1.10% ✓
- Cap rate
- 5.89%
- Cash-on-cash
- -1.46%
- DSCR
- 0.94
- GRM
- 7.6
CMA / ARV
No comps found within radius.
Projected returns pro-forma
3.0% appreciation · 3.0% rent growth · sell at horizon
- IRR
- 6.2%
- Equity multiple
- 1.36×
- Total profit
- $11,533
- Equity at exit
- $51,709
- IRR
- 9.2%
- Equity multiple
- 2.39×
- Total profit
- $44,794
- Equity at exit
- $79,690
Cash invested: $32,200 (down + closing). Projections, not guarantees.
Landlord ↔ Tenant lean methodology
- Overall (STATE)
- 90 Strongly Landlord-Friendly
- State South Carolina
- 90 Strongly Landlord-Friendly · R+6
- County
- — inherits STATE
- City
- — inherits STATE
ZIP-level market 29210-7104
- Active inventory
- 1
- Price-to-rent
- 7.6×
Monthly cashflow live
- Estimated rent
- $1,265 high interval (Pro) →
- Mortgage (P&I)
- −$603
- Tax from tax record
- −$25 /mo · $296/yr
- Insurance
- −$48
- HOA
- −$363
- Vacancy / Maint / Mgmt
- −$266
- Net cashflow
- $-39
Break-even live
UW: 25.0% down · 7.5% · 30yr · 1.5% tax · 5.0% vac · 8.0% maint · 8.0% mgmt
Financing live
Cash to close
- Down payment
- $28,750
- Closing costs
- $3,450
- Reserves months
- —
- Total cash needed
- —
Loan-product check · same deal, 3 products live
Conventional
25% down · 7.5% · 30yr
- Down + closing
- —
- Monthly P&I
- —
- Monthly cashflow
- —
- DSCR
- —
- Eligible?
- —
Personal DTI + credit; lowest rate.
DSCR
20% down · 8.5% · 30yr
- Down + closing
- —
- Monthly P&I
- —
- Monthly cashflow
- —
- DSCR
- —
- Eligible?
- —
No personal income docs; deal must DSCR.
Hard money
10% down · 12.0% · 12mo
- Down + closing
- —
- Monthly P&I
- —
- Monthly cashflow
- —
- DSCR
- —
- Eligible?
- —
Short-term bridge; refi at stabilization.
Rent comps 22 comps
| Address | Beds | Baths | Sqft | Rent | $/sqft | DOM | Units | Dist |
|---|---|---|---|---|---|---|---|---|
| 313 Cambout St Columbia, SC | 2.0 | 2.0 | 1100 | $1,450 | $1.32 | 23d | 1 | 0.10mi |
| 1800 Longcreek Dr Columbia, SC | 1.0–3.0 | 1.0–2.0 | 986 | $900 | $0.91 | 11d | 62 | 0.13mi |
| 1601 Longcreek Dr Columbia, SC | 1.0–2.0 | 1.0–2.0 | 706 | $1,051 | $1.49 | 14d | 51 | 0.16mi |
| 1401 Longcreek Dr Columbia, SC | 1.0–3.0 | 1.0–2.0 | 1000 | $1,116 | $1.12 | 14d | 9 | 0.32mi |
| 1340 Longcreek Dr Columbia, SC | 1.0–2.0 | 1.0–2.0 | 875 | $1,180 | $1.35 | 11d | 25 | 0.34mi |
| 2112 Chandler Ave Columbia, SC | 3.0 | 3.0 | 1350 | $1,850 | $1.37 | 23d | 1 | 0.55mi |
| 1808 Laredo Dr Columbia, SC | 3.0 | 2.0 | 1250 | $1,661 | $1.33 | 23d | 1 | 0.62mi |
| 4501 Bentley Dr Columbia, SC | 1.0–3.0 | 1.0–2.0 | 946 | $1,328 | $1.40 | 11d | 18 | 0.68mi |
| 1839 Hi Sierra Dr Columbia, SC | 3.0 | 2.0 | 1500 | $1,731 | $1.15 | 23d | 1 | 0.72mi |
| 1725 Kathleen Dr Unit B Columbia, SC | 2.0 | 2.0 | 1100 | $1,275 | $1.16 | 23d | 1 | 0.96mi |
| 825 Menlo Dr Columbia, SC | 1.0–4.0 | 1.0–2.0 | 1083 | $1,300 | $1.20 | 19d | 3 | 1.08mi |
| 324 Menlo Dr Unit BG0324 Columbia, SC | 2.0 | 1.0 | 912 | $1,175 | $1.29 | 14d | 1 | 1.09mi |
| 114 Menlo Dr Unit BG0114 Columbia, SC | 3.0 | 2.0 | 1300 | $1,675 | $1.29 | 19d | 1 | 1.15mi |
| 3900 Bentley Dr Columbia, SC | 1.0–2.0 | 1.0–2.0 | 873 | $1,330 | $1.52 | 11d | 40 | 1.19mi |
| 921 Old Manor Rd Unit BG0921 Columbia, SC | 2.0 | 1.0 | 912 | $1,100 | $1.21 | 23d | 1 | 1.19mi |
| 100 Bryton Trce Columbia, SC | 2.0 | 1.0–2.0 | 950 | $1,215 | $1.28 | 21d | 4 | 1.22mi |
| 1510 Saint Andrews Rd Columbia, SC | 3.0 | 2.0 | 1196 | $1,215 | $1.02 | 14d | 36 | 1.28mi |
| 2218 Apple Valley Rd Apt B Columbia, SC | 2.0 | 1.0 | 900 | $995 | $1.11 | 23d | 1 | 1.29mi |
| 2218 Apple Valley Rd Columbia, SC | 3.0 | 1.0 | 972 | $1,295 | $1.33 | 23d | 1 | 1.29mi |
| 200 Saluda River Rd Columbia, SC | 1.0–2.0 | 1.0–1.5 | 900 | $1,120 | $1.24 | 11d | 8 | 1.34mi |
| 2025 Apple Valley Rd Unit B Columbia, SC | 2.0 | 1.0 | 842 | $925 | $1.10 | 23d | 1 | 1.40mi |
| 716 Zimalcrest Dr Columbia, SC | 2.0 | 1.0–2.0 | 634 | $1,224 | $1.93 | 11d | 24 | 1.42mi |
HOA detail condo
- Monthly dues
- $363 · $4,356/yr
- Assessments
- None detected in remarks — confirm with the listing agent.
Listing history 18 events
-
2026-06-18days on market $115,000 Active 71 DOM
-
2026-06-17days on market $115,000 Active 70 DOM
-
2026-06-16days on market $115,000 Active 69 DOM
-
2026-06-15days on market $115,000 Active 68 DOM
-
2026-06-14days on market $115,000 Active 66 DOM
-
2026-06-10days on market $115,000 Active 63 DOM
-
2026-06-09days on market $115,000 Active 62 DOM
-
2026-06-08days on market $115,000 Active 61 DOM
-
2026-06-07days on market $115,000 Active 60 DOM
-
2026-06-03days on market $115,000 Active 56 DOM
-
2026-06-03days on market $115,000 Active 55 DOM
-
2026-06-02price $115,000 Active 54 DOM
-
2026-06-01days on market $125,000 Active 54 DOM
-
2026-05-31days on market $125,000 Active 53 DOM
-
2026-04-08$125,000 Active
-
2013-06-10soldstatus $39,900
-
1988-04-01soldstatus $52,000
-
1984-11-01soldstatus $46,000
ⓘ Source: listings_history table (triggers on properties + properties_extension) + one-shot
backfill from property_details.listing_events for pre-trigger history.
Tax reassessment forecast SC · Resets to sale price
- Current annual tax
- $296 · $25/mo
- Projected year-2 tax
- $656 · $55/mo
- Expected delta
- +$360/yr (+$30/mo · 121.5%)
ⓘ Screening estimate from a state-policy table — verify with the county assessor before closing.
Climate risk First Street
- Flood 1/10 Low FEMA zone X (unshaded) · 0% chance over 30 yrs
- Wildfire 1/10 Low
- Heat 7/10 Severe 7 d/yr ≥108°F today · 16 d/yr by 30 yrs out
- Wind 6/10 Major 69% chance of damaging wind over 30 yrs
- Air quality 3/10 Moderate 2 unhealthy d/yr today · 2 by 30 yrs out
Nearby sold comps map
Loading sold comps map…
Walkable amenities ~0.75 mi
Loading nearby amenities…
Taxation est. · year 1
- Rental income
- $15,183
- − Mortgage interest
- −$6,442
- − Property taxes
- −$296
- − Insurance
- −$575
- − Repairs & maintenance
- −$1,215
- − Management
- −$1,215
- − HOA
- −$4,356
- − Depreciation
- −$3,345
- Taxable loss
- −$2,260
- Est. tax savings @ 24.0%
- +$542
- After-tax cash flow
- $73/yr
For passive investors: Depreciation is non-cash, so a rental often shows a tax loss while cash-flowing — sheltering income. Rental losses are passive: they offset passive income freely, and up to $25,000/yr can offset ordinary (W-2) income if you actively participate and your MAGI is under $100k (phasing out to $0 by $150k); unused losses carry forward. On sale, claimed depreciation is recaptured at up to 25%, and gains may owe capital-gains tax (a 1031 exchange can defer both). Figures are a year-1 estimate at your 24.0% rate — not tax advice; consult a CPA.
Schools (NCES district)
- District
- Richland 01
- NCES district ID
- 4503360
- Math proficiency
- 26% ▼ -7.00%
- Reading proficiency
- 36% ▼ -5.00%
- Median HH income
- $38,931
- Composite
- 25.94/100
- National rank
- #7335
- State rank
- #54 of 80 in SC
Livability — St. Andrews
No livability data for this city. (Only ~50 U.S. cities are tracked.)
Census & demographics
- Census place
- St. Andrews, SC
Population outlook (Richland County) Hauer SSP2
- Today (2025)
- 459,667 people
- By 2030
- 487,524 · +6.1%
- By 2040
- 542,035 · +17.9%
- By 2050
- 595,371 · +29.5%
- By 2075
- 732,998 · +59.5%
- By 2100
- 820,415 · +78.5%
Not yet ingested
- Political lean
- —
- Race & ethnicity
- —
- Common origin
- —
- Civics
- —
Market trends
- HPI YoY
- —
- Current HPI
- —
- Rent YoY
- —
- Metro
- —
- State GDP YoY
- ▲ 4.51%
- F500 in state
- 2
Industry mix (Fortune 500 HQ in SC)
| Industry | F500 HQs | Revenue |
|---|---|---|
| Packaging | 1 | $7B |
|
||
Price history
+171.7% since first listed4 events — show timeline
- 2026-04-08 Listed $125,000 Consolidated MLS
- 2013-06-10 Sold (Public Records) $39,900 Public Records
- 1988-04-01 Sold (Public Records) $52,000 Public Records
- 1984-11-01 Sold (Public Records) $46,000 Public Records
Property tax history
-2.5%/yrLatest (2025): $296 · +4.2% YoY. Source: county tax records.
Cash-flow waterfall
monthlySold comps — $/sqft
last 12 mo · ≤1 miLoading sold comps…