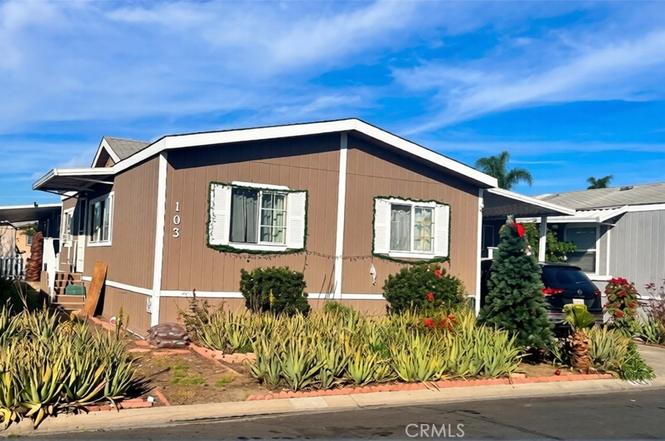
8200 Bolsa Ave #103 · Midway City, CA
Flood risk 1/10 · Minimal
- FEMA flood zone
- X (shaded)
- Chance of flooding over 30 yrs
- 0.0%
- Est. flood insurance / yr
- $507 – $1,088
Fire risk 1/10 · Minimal
- Est. fire insurance / yr
- $659 – $1,223
Heat risk 5/10 · Moderate
- Hot days now (above 87°F)
- 7 days/yr
- Hot days in 30 yrs
- 23 days/yr
Wind risk 1/10 · Minimal
- Chance of severe wind over 30 yrs
- —
Air-quality risk 4/10 · Minor
- Unhealthy air days now
- 5 days/yr
- Unhealthy air days in 30 yrs
- 7 days/yr
Risk factors via First Street. Map © Google.
Why this score? — see what drove the A grade
The composite is a weighted blend of 9 inputs, each scored 0–100. Each bar is that input's sub-score; the figure is the points it added to the 100-point composite (weight × sub-score).
- Cash flow +30.0/30.0
- ARV discount +15.0/15.0
- 1% rule +10.0/10.0
- DSCR +10.0/10.0
- Appreciation +10.0/10.0
- Schools +6.5/10.0
- Livability +3.0/5.0
- Rent growth +2.5/5.0
- Condition / age +2.5/5.0
$99,595
🖨 Deal sheet 📄 Offer letter ✓ Due diligence
Listing remarks
Located in a quiet, all-ages community, this 3-bedroom, 2-bath mobile home has fantastic potential! Ready for updates, it gives you the chance to make it your own. Enjoy a spacious backyard, close to schools, shopping, and everyday conveniences. An ideal opportunity for anyone looking for an affordable home with room to grow and personalize.
Key facts
- Close to schools
- Spacious backyard
- Close to shopping
Tags
Property features AI
Finance
- Other: Park name: Del Prado Bolsa; Manager approval required; Pets allowed
- Financial info: Monthly land lease of $2,457 (park-managed)
- HOA & community: Park community features; Rent includes trash, pool, sewer
Exterior
- Parking: Carport (2 spaces)
- Utilities: District/public water; Sewer or septic (unknown)
- Home design: Mobile home (doublewide); Model 1L6442; Single-story; Mobile home remains on site; Repairs cosmetic
- Construction: Pier jacks foundation
- Exterior features: Shingle roof; Wood fencing; Patio; Community pool; Wood skirting; Back yard
Interior
- Bathrooms: 2 full bathrooms
- Heating & cooling: Central cooling; Central furnace heating
- Interior features: One-level home; Entry on main level; Community spa
- Laundry & utility: Inside laundry; Electric dryer hookup; Gas and electric dryer hookup
Neighborhood map
What this means for you Summary
Snapshot
- This is a 3-bed/2.0-bath manufactured listed at $100k.
Deal economics
- At list price, monthly cash flow is $2k ($22k/yr) — positive.
- The deal already cash-flows at list — no discount required.
- Meets the 1% rule at list price ($3k rent vs $100k).
- Recommended offer: $88k (12.0% below list) — sets the bar for market timing.
Location & tenants
- Location reads 59/100 on livability (#624 in CA) — a working-class tenant base; expect higher turnover. Strengths: commute A+; Watch: crime D+, amenities D, employment F.
- Huntington Beach Union High (suburban): math 65% / reading 82% proficiency, ranked #39 of 517 in CA (top 8%) — strong family-tenant draw, lease renewals of 3-5y typical.
- Zoned schools: Westminster High (math 51% / reading 68%, grade C+, #205 of 1,170 statewide, top 19%, 2,637 students, 87% FRL).
- Zoned-school proficiency averages 60% at this address vs 74% district-wide (-14 pts) — the specific schools serving this property underperform the Huntington Beach Union High average; the district grade overstates school quality for this exact location.
- Market conditions: 15 active listings in the ZIP; 28 comparable units currently listed for rent nearby; rentals leasing fast (median 1d on market — plan ~1-2 weeks tenant-placement turnaround); 6,974 units permitted in Orange County in 2024 (3,839 in 5+ unit buildings).
Forward outlook
- In year one you build about $11k of equity ($688 loan paydown + $10k appreciation (10.0% local appreciation)).
- Orange County population projected at +14% by 2050 — modest demand growth; plan on rents tracking national, not racing it.
- At projected returns (10.0% appreciation + 3.0% rent growth), your $28k cash investment doubles in ~1 year — after that, you're playing with house money.
- By year 4, paydown + projected appreciation supports a ~$38k cash-out refi (75% LTV) — recoverable capital for the next deal without selling this one.
Negotiation context
- It's been on market 125 days — a 12% lower offer ($88k) is reasonable based on typical stale-listing flexibility.
- 3 sale attempts since 18y ago; this cycle's ask has dropped $20k (17%) from the opening price — seller is motivated, your offer sets the floor, not the list.
Risks & watch-outs
- Climate carrying-cost: extreme-heat days projected 7→23/yr by 2055 (HVAC capex compounding) — expect insurance premiums to compound above CPI over the hold.
Questions for the listing agent
- It's been on market 125 days. Have you received any prior offers? Is the seller open to a 12% concession, seller financing, or rate buy-down credit?
- Why hasn't it sold? Are there any deal-killer items the seller is aware of (foundation, flood, title, zoning, code violations)?
- Is there a deadline driving the sale (1031 exchange, divorce, estate, relocation)? That informs how much negotiation room exists.
- Crime grade is D in this area — have there been break-ins, vandalism, or insurance claims at this property in the last 3 years? What carrier currently insures it and at what premium?
- What's the average days-on-market for RENTAL listings here right now (not sales)? A rising rental-DOM trend means longer vacancies and softer asking-rent achievability than the comps imply.
- What's the recent tenant-quality profile in this submarket — average credit score on applications, eviction rate, late-payment / NSF rate, and stable-employment percentage? A property-management company in the area should have these aggregated.
- How much new for-sale + rental construction is in the pipeline within 1–3 miles? Heavy new supply typically softens prices + rents 12–24 months out; constrained supply supports both.
Investment metrics
- 1% rule
- 3.06% ✓
- Cap rate
- 28.34%
- Cash-on-cash
- 78.75%
- DSCR
- 4.50
- GRM
- 2.7
CMA / ARV
- ARV (on-the-fly)
- $160,480
- Comps found
- 4
Show comp detail 4 sales within ~0.75 mi
| Address | Dist | Beds/Ba | Sqft | Sold | Price | $/sf | Match |
|---|---|---|---|---|---|---|---|
| 15621 Beach Blvd. #121 | 0.68mi | 2/2.0 (-1) | 960 (+2%) | 8mo | $170,000 | $177 | 54 |
| 15621 Beach Blvd #160 | 0.68mi | 2/1.0 (-1) | 968 (+2%) | 2mo | $80,000 | $83 | 53 |
| 15621 BEACH Blvd #23 | 0.68mi | 2/2.0 (-1) | 1,040 (+10%) | 2mo | $105,000 | $101 | 45 |
| 15621 Beach Blvd #115 | 0.68mi | 2/2.0 (-1) | 1,060 (+12%) | 5mo | $180,000 | $170 | 38 |
Match score weights: distance 35% · size 25% · config 20% · recency 20%. Top-matched comps best support the ARV.
Projected returns pro-forma
10.0% appreciation · 3.0% rent growth · sell at horizon
- IRR
- 88.8%
- Equity multiple
- 7.12×
- Total profit
- $170,781
- Equity at exit
- $89,723
- IRR
- 83.5%
- Equity multiple
- 15.75×
- Total profit
- $411,222
- Equity at exit
- $193,491
Cash invested: $27,887 (down + closing). Projections, not guarantees.
Landlord ↔ Tenant lean methodology
- Overall (STATE)
- 18 Strongly Tenant-Friendly
- State California
- 18 Strongly Tenant-Friendly · D+13
- County
- — inherits STATE
- City
- — inherits STATE
ZIP-level market 92655
- Home prices YoY
- 11.1%
- Active inventory
- 15
- Price-to-rent
- 2.7×
Monthly cashflow live
- Estimated rent
- $3,052 high interval (Pro) →
- Mortgage (P&I)
- −$522
- Tax from tax record
- −$18 /mo · $211/yr
- Insurance
- −$41
- HOA
- −$0
- Vacancy / Maint / Mgmt
- −$641
- Net cashflow
- $1,830
Break-even live
UW: 25.0% down · 7.5% · 30yr · 1.5% tax · 5.0% vac · 8.0% maint · 8.0% mgmt
Financing live
Cash to close
- Down payment
- $24,899
- Closing costs
- $2,988
- Reserves months
- —
- Total cash needed
- —
Loan-product check · same deal, 3 products live
Conventional
25% down · 7.5% · 30yr
- Down + closing
- —
- Monthly P&I
- —
- Monthly cashflow
- —
- DSCR
- —
- Eligible?
- —
Personal DTI + credit; lowest rate.
DSCR
20% down · 8.5% · 30yr
- Down + closing
- —
- Monthly P&I
- —
- Monthly cashflow
- —
- DSCR
- —
- Eligible?
- —
No personal income docs; deal must DSCR.
Hard money
10% down · 12.0% · 12mo
- Down + closing
- —
- Monthly P&I
- —
- Monthly cashflow
- —
- DSCR
- —
- Eligible?
- —
Short-term bridge; refi at stabilization.
Rent comps 28 comps
| Address | Beds | Baths | Sqft | Rent | $/sqft | DOM | Units | Dist |
|---|---|---|---|---|---|---|---|---|
| 8041 Worthy Dr Westminster, CA | 2.0 | 1.0 | 900 | $2,700 | $3.00 | 1d | 1 | 0.53mi |
| 15200 Magnolia St Westminster, CA | 1.0–2.0 | 1.0 | 762 | $2,675 | $3.51 | 2d | 2 | 0.81mi |
| 14332 Joyce Ave Westminster, CA | 3.0 | 2.0 | 1100 | $3,890 | $3.54 | 1d | 1 | 0.99mi |
| 8400 Edinger Ave Huntington Beach, CA | 2.0 | 1.0–2.0 | 778 | $3,007 | $3.87 | 1d | 13 | 1.00mi |
| 7861 14th St Unit C Westminster, CA | 2.0 | 2.0 | 925 | $2,800 | $3.03 | 1d | 1 | 1.02mi |
| 16121 Malaga Ln Unit D Huntington Beach, CA | 2.0 | 2.0 | 1000 | $2,800 | $2.80 | 1d | 1 | 1.02mi |
| 7861 14th St Westminster, CA | 2.0 | 2.0 | 1025 | $2,700 | $2.63 | 2d | 1 | 1.02mi |
| 15100 Moran St Westminster, CA | 1.0–2.0 | 1.0–2.0 | 1204 | $3,847 | $3.19 | 2d | 8 | 1.04mi |
| 7400 Center Ave Huntington Beach, CA | 2.0 | 1.0–2.0 | 990 | $4,119 | $4.16 | 1d | 1 | 1.08mi |
| 7521 Edinger Ave Huntington Beach, CA | 3.0 | 1.0–2.0 | 1035 | $4,315 | $4.17 | 1d | 23 | 1.08mi |
| 7942 Stark Dr Huntington Beach, CA | 2.0 | 2.0 | 1000 | $2,495 | $2.50 | 15d | 1 | 1.11mi |
| 7643 14th St Westminster, CA | 2.0 | 2.0 | 1002 | $3,250 | $3.24 | 1d | 1 | 1.13mi |
| 7461 Edinger Ave Huntington Beach, CA | 2.0 | 1.0–2.0 | 1031 | $4,325 | $4.19 | 1d | 26 | 1.15mi |
| 16162 Sher Ln Huntington Beach, CA | 1.0–3.0 | 1.0–1.5 | 1090 | $2,825 | $2.59 | 1d | 9 | 1.16mi |
| 7891 Holt Dr Unit 03 Huntington Beach, CA | 2.0 | 1.0 | 850 | $2,295 | $2.70 | 19d | 1 | 1.17mi |
| 8631 Westminster Ave Garden Grove, CA | 1.0–2.0 | 1.0 | 660 | $2,489 | $3.77 | 1d | 9 | 1.21mi |
| 7661 Baylor Dr Westminster, CA | 1.0–2.0 | 1.0 | 787 | $2,400 | $3.05 | 1d | 2 | 1.22mi |
| 7601 Amazon Dr Unit 2 Huntington Beach, CA | 2.0 | 2.0 | 1000 | $2,650 | $2.65 | 1d | 1 | 1.26mi |
| 14523 Ontario Dr Westminster, CA | 2.0 | 2.0 | 750 | $2,600 | $3.47 | 43d | 1 | 1.27mi |
| 7912 Glencoe Dr Huntington Beach, CA | 3.0 | 1.0 | 1100 | $3,900 | $3.55 | 1d | 1 | 1.34mi |
| 7290 Edinger Ave Huntington Beach, CA | 1.0–2.0 | 1.0–2.0 | 941 | $3,824 | $4.06 | 1d | 19 | 1.36mi |
| 8810 Hewitt Pl #22 Garden Grove, CA | 2.0 | 2.5 | 1025 | $3,200 | $3.12 | 1d | 1 | 1.37mi |
| 13920 Hoover St Westminster, CA | 2.0 | 1.0–2.0 | 645 | $3,031 | $4.70 | 1d | 11 | 1.38mi |
| 15596 Dawson Ln Huntington Beach, CA | 3.0 | 2.0 | 1000 | $3,600 | $3.60 | 1d | 1 | 1.46mi |
| 7012 Main St Westminster, CA | 1.0–2.0 | 1.0 | 812 | $2,395 | $2.95 | 11d | 5 | 1.49mi |
| 7012 Main St Unit 7042-11 Westminster, CA | 2.0 | 1.0 | 900 | $2,395 | $2.66 | 1d | 1 | 1.50mi |
| 7012 Main St Unit 7022-16 Westminster, CA | 2.0 | 1.0 | 900 | $2,395 | $2.66 | 7d | 1 | 1.50mi |
| 7012 Main St Unit 7042-06 Westminster, CA | 2.0 | 1.0 | 900 | $2,395 | $2.66 | 17d | 1 | 1.50mi |
Listing history 20 events
-
2026-06-18days on market $99,595 Active 125 DOM
-
2026-06-17days on market $99,595 Active 124 DOM
-
2026-06-16days on market $99,595 Active 123 DOM
-
2026-06-15days on market $99,595 Active 122 DOM
-
2026-06-13days on market $99,595 Active 120 DOM
-
2026-06-13days on market $99,595 Active 119 DOM
-
2026-06-09days on market $99,595 Active 116 DOM
-
2026-06-08days on market $99,595 Active 115 DOM
-
2026-06-07days on market $99,595 Active 114 DOM
-
2026-06-04days on market $99,595 Active 111 DOM
-
2026-06-03days on market $99,595 Active 110 DOM
-
2026-06-02days on market $99,595 Active 109 DOM
-
2026-06-01days on market $99,595 Active 108 DOM
-
2026-05-31days on market $99,595 Active 107 DOM
-
2026-05-16price $99,595
-
2026-05-06status Active
-
2026-04-13status Pending Sale
-
2026-01-21$120,000 Active
-
2008-10-31historical
-
2008-07-26$39,900
ⓘ Source: listings_history table (triggers on properties + properties_extension) + one-shot
backfill from property_details.listing_events for pre-trigger history.
Tax reassessment forecast CA · Resets to sale price
- Current annual tax
- $211 · $18/mo
- Projected year-2 tax
- $757 · $63/mo
- Expected delta
- +$546/yr (+$46/mo · 259.2%)
ⓘ Screening estimate from a state-policy table — verify with the county assessor before closing.
Climate risk First Street
- Flood 1/10 Low FEMA zone X (shaded) · 0% chance over 30 yrs
- Wildfire 1/10 Low
- Heat 5/10 Major 7 d/yr ≥87°F today · 23 d/yr by 30 yrs out
- Wind 1/10 Low
- Air quality 4/10 Moderate 5 unhealthy d/yr today · 7 by 30 yrs out
Nearby sold comps map
Loading sold comps map…
Walkable amenities ~0.75 mi
Loading nearby amenities…
Taxation est. · year 1
- Rental income
- $36,629
- − Mortgage interest
- −$5,579
- − Property taxes
- −$211
- − Insurance
- −$498
- − Repairs & maintenance
- −$2,930
- − Management
- −$2,930
- − Depreciation
- −$2,897
- Taxable income
- $21,584
- Est. tax owed @ 24.0%
- −$5,180
- After-tax cash flow
- $16,781/yr
For passive investors: Depreciation is non-cash, so a rental often shows a tax loss while cash-flowing — sheltering income. Rental losses are passive: they offset passive income freely, and up to $25,000/yr can offset ordinary (W-2) income if you actively participate and your MAGI is under $100k (phasing out to $0 by $150k); unused losses carry forward. On sale, claimed depreciation is recaptured at up to 25%, and gains may owe capital-gains tax (a 1031 exchange can defer both). Figures are a year-1 estimate at your 24.0% rate — not tax advice; consult a CPA.
Schools (NCES district)
- District
- Huntington Beach Union High
- NCES district ID
- 0618060
- Math proficiency
- 65% ▲ 17.00%
- Reading proficiency
- 82% ▲ 8.00%
- Median HH income
- $78,159
- Composite
- 64.9/100
- National rank
- #511
- State rank
- #39 of 517 in CA
Livability — Midway City
- Score
- 59/100
- State rank
- #624
- US rank
- #19816
Category grades
Schools grade is shown separately in the Schools card above.
Census & demographics
- Census place
- Midway City, CA
- City population
- 8,101
- Population (ZIP)
- 8,101
Population outlook (Orange County) Hauer SSP2
- Today (2025)
- 3,477,456 people
- By 2030
- 3,613,117 · +3.9%
- By 2040
- 3,835,945 · +10.3%
- By 2050
- 3,968,736 · +14.1%
- By 2075
- 4,097,053 · +17.8%
- By 2100
- 3,903,633 · +12.3%
Race, ethnicity, and origin ACS 2023
- Neighborhood character
- Diverse neighborhood (Simpson 0.66)
- Race & ethnicity
- Asian 44% Hispanic / Latino 35% White 16% Two or more races 9% Native American 2%
- Hispanic origin (detail)
- Mexican 35%
- Common ancestry
- Lithuanian 1% Iranian 1%
- Foreign-born
- 49% · Vietnam, Canada, China
- Languages at home
- 28% English-only · Vietnamese 39% Spanish 26% Chinese 2%
Political lean MEDSL · Orange
- 2024 margin
- Toss-up / Even · D 49.7% · R 47.1% · Other 3.2%
- 2008→2024 swing
- +5.2pp toward D · 2008: -2.6pp · 2024: 2.6pp
- All cycles
- 2024: D+2.6 2020: D+9.0 2016: D+7.7 2012: R+8.3 2008: R+2.6
Not yet ingested
- Civics
- —
Market trends
- HPI YoY
- ▲ 97.88%
- Current HPI
- 980.41
- Rent YoY
- —
- Metro
- —
- State GDP YoY
- ▲ 3.21%
- F500 in state
- 116
Industry mix (Fortune 500 HQ in CA)
| Industry | F500 HQs | Revenue |
|---|---|---|
| Technology | 27 | $1,492B |
|
||
| Financial Services | 3 | $174B |
|
||
| Retail | 3 | $44B |
|
||
| Insurance | 3 | $26B |
|
||
| Media / Entertainment | 2 | $115B |
|
||
| Pharmaceuticals / Biotech | 2 | $62B |
|
||
Price history
+149.6% since first listed6 events — show timeline
- 2026-05-16 Price Changed $99,595 CRMLS
- 2026-05-06 Relisted — CRMLS
- 2026-04-13 Pending — CRMLS
- 2026-01-21 Listed $120,000 CRMLS
- 2008-10-31 Listing Removed — CRMLS
- 2008-07-26 Listed $39,900 CRMLS
Property tax history
-3.4%/yrLatest (2025): $211 · -0.8% YoY. Source: county tax records.
Cash-flow waterfall
monthlySold comps — $/sqft
last 12 mo · ≤1 miLoading sold comps…