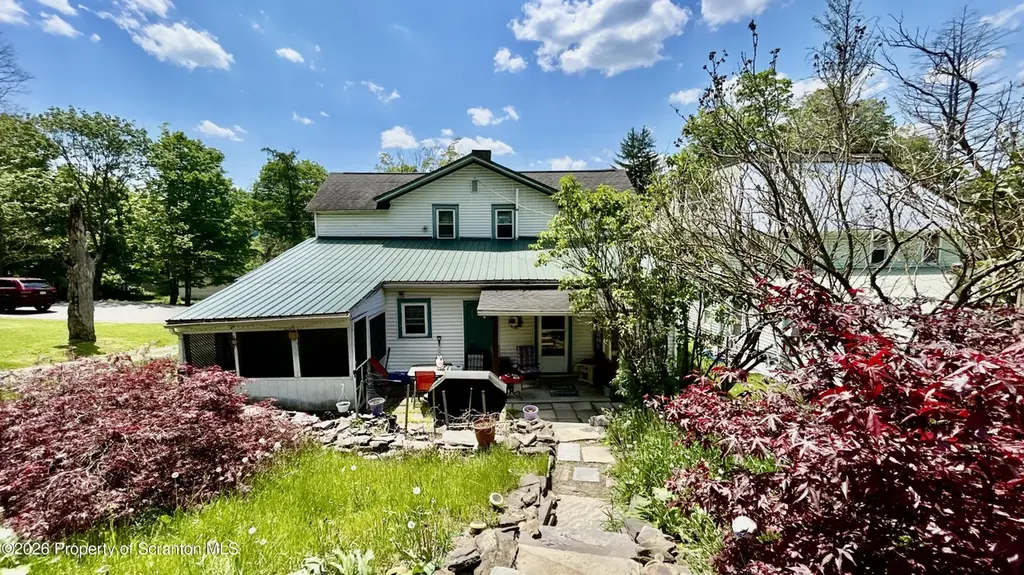
94 Franklin St · Great Bend, PA
Flood risk 1/10 · Minimal
- FEMA flood zone
- X (unshaded)
- Chance of flooding over 30 yrs
- 0.0%
- Est. flood insurance / yr
- $473 – $860
Fire risk 1/10 · Minimal
- Est. fire insurance / yr
- $511 – $949
Heat risk 3/10 · Minor
- Hot days now (above 92°F)
- 7 days/yr
- Hot days in 30 yrs
- 16 days/yr
Wind risk 2/10 · Minimal
- Chance of severe wind over 30 yrs
- 3.0%
Air-quality risk 2/10 · Minimal
- Unhealthy air days now
- 0 days/yr
- Unhealthy air days in 30 yrs
- 1 days/yr
Risk factors via First Street. Map © Google.
Why this score? — see what drove the C- grade
The composite is a weighted blend of 9 inputs, each scored 0–100. Each bar is that input's sub-score; the figure is the points it added to the 100-point composite (weight × sub-score).
- ARV discount +15.0/15.0
- Cash flow +11.9/30.0
- Appreciation +5.0/10.0
- Schools +3.6/10.0
- 1% rule +3.5/10.0
- DSCR +3.5/10.0
- Livability +3.4/5.0
- Rent growth +2.5/5.0
- Condition / age +2.5/5.0
$159,900
🖨 Deal sheet (PDF) 📄 Offer letter ✓ Due diligence
Listing remarks
Classic 2-story Center Hall Colonial full of character, charm, and endless potential! A welcoming wraparound porch, mature landscaping, and timeless curb appeal create a warm first impression from the moment you arrive. Inside, you'll find spacious rooms, beautiful hardwood floors, and a traditional layout ready to be personalized and restored to its full beauty. The applianced country kitchen features a walk-in pantry and access to the rear patio, where landscaped tiered brick steps lead to a large 2-story barn and workshop -- perfect for storage, hobbies, projects, or additional possibilities. Step outside and enjoy the above-ground pool, offering the perfect place to relax and entertain
Key facts
- 2-story barn
- Wraparound porch
- Rear patio
Tags
Property features AI
Exterior
- Parking: Detached garage (1 car); Driveway; Gravel parking
- Utilities: Private water source; Public sewer; Electricity connected (200 amp or less); Sewer connected; Water connected
- Home design: Single-family residence; Residential property; Built in 1900
- Construction: Stone foundation; Stone and vinyl siding exterior; Asphalt and foam roof
- Exterior features: Storage; Above-ground pool; Cleared lot; City street frontage with asphalt road
Interior
- Kitchen: Dishwasher; Refrigerator
- Bedrooms: 4 bedrooms (sizes include 8 x 6; 10 x 8; 14 x 9; 14 x 11)
- Flooring: Carpet; Linoleum; Hardwood
- Bathrooms: 2 full bathrooms
- Heating & cooling: Ceiling fans; Baseboard heating; Oil heating; Forced air; Electric heating
- Interior features: Eat-in kitchen; Pantry; Crawl opening attic; Full basement with interior entry; 9 total rooms (living room, family room, dining room, foyer, den, kitchen, 4 bedrooms, 2 bathrooms)
- Laundry & utility: Basement utility access
Neighborhood map
What this means for you Summary
Snapshot
- This is a 4-bed/2.0-bath single-family listed at $160k.
Deal economics
- At list price, monthly cash flow is $-41 ($-495/yr) — negative.
- To cash-flow at today's rent, offer at most $153k (4.6% below list).
- To meet the 1% rule (rent ≥ 1% of price), the offer needs to be $136k (14.7% below list).
- Recommended offer: $136k (14.7% below list) — sets the bar for 1% rule.
Location & tenants
- Location reads 67/100 on livability (#1,008 in PA) — a middle-class / working-renter tenant base. Strengths: crime A+, cost of living A+, housing A+; Watch: amenities F, commute F, employment F.
- Blue Ridge SD (rural): math 29% / reading 56% proficiency, ranked #319 of 539 in PA (top 59%) — families likely to look elsewhere, expect single-tenant / working-renter base with shorter leases.
- Zoned schools: Blue Ridge El Sch (math 35% / reading 54%, grade F, #815 of 1,518 statewide, top 56%, 495 students, 100% FRL); Blue Ridge Ms (math 19% / reading 58%, grade F, #275 of 512 statewide, top 55%, 219 students, 100% FRL); Blue Ridge Hs (math 54%, 290 students, 94% FRL) — zoned schools average 98% FRL vs 42% district-wide (56 pts higher); higher-poverty schools than district average — tighter screening recommended.
- Market conditions: 9 active listings in the ZIP; 80 units permitted in Susquehanna County in 2024 (5 in 5+ unit buildings).
Forward outlook
- In year one you build about $6k of equity ($1k loan paydown + $5k appreciation (3.0% local appreciation)).
- Susquehanna County population projected at -30% by 2050 — secular population decline; favor cash flow + early exit over multi-decade hold.
- At projected returns (3.0% appreciation + 3.0% rent growth), your $45k cash investment doubles in ~7 years — after that, you're playing with house money.
- By year 6, paydown + projected appreciation supports a ~$31k cash-out refi (75% LTV) — recoverable capital for the next deal without selling this one.
Negotiation context
- It's been on market 30 days — a 2% lower offer ($158k) is reasonable based on typical stale-listing flexibility.
- 2 sale attempts since 15y ago with the ask held roughly flat each time — persistent listings suggest the price (not the market) is what's stuck; bring a comps-based counter.
Risks & watch-outs
- Watch-outs: built in 1900 — expect roof / HVAC / electrical / plumbing capex.
Questions for the listing agent
- What do current leases actually rent for vs. the listed asking? Can we see a recent rent roll and the last 12 months of T-12 income?
- Built in 1900 — when were the roof, HVAC, electrical panel, plumbing, and water heater last replaced?
- Is there a deadline driving the sale (1031 exchange, divorce, estate, relocation)? That informs how much negotiation room exists.
- Schools are F-rated, which usually means shorter tenancies and higher turnover. Who's the typical renter profile here, and what's been the actual vacancy rate?
- What's the average days-on-market for RENTAL listings here right now (not sales)? A rising rental-DOM trend means longer vacancies and softer asking-rent achievability than the comps imply.
- What's the recent tenant-quality profile in this submarket — average credit score on applications, eviction rate, late-payment / NSF rate, and stable-employment percentage? A property-management company in the area should have these aggregated.
- How much new for-sale + rental construction is in the pipeline within 1–3 miles? Heavy new supply typically softens prices + rents 12–24 months out; constrained supply supports both.
Investment metrics
- 1% rule
- 0.85% ✗
- Cap rate
- 5.98%
- Cash-on-cash
- -1.11%
- DSCR
- 0.95
- GRM
- 9.8
CMA / ARV
- ARV (on-the-fly)
- $308,066
- Comps found
- 1
Show comp detail 1 sale within ~0.75 mi
| Address | Dist | Beds/Ba | Sqft | Sold | Price | $/sf | Match |
|---|---|---|---|---|---|---|---|
| 535 Washington St | 0.44mi | 3/2.5 (-1) | 2,488 (-2%) | 7mo | $299,900 | $121 | 62 |
Match score weights: distance 35% · size 25% · config 20% · recency 20%. Top-matched comps best support the ARV.
Projected returns pro-forma
3.0% appreciation · 3.0% rent growth · sell at horizon
- IRR
- 6.5%
- Equity multiple
- 1.37×
- Total profit
- $16,664
- Equity at exit
- $71,898
- IRR
- 9.3%
- Equity multiple
- 2.41×
- Total profit
- $63,069
- Equity at exit
- $110,803
Cash invested: $44,772 (down + closing). Projections, not guarantees.
Landlord ↔ Tenant lean methodology
- Overall (STATE)
- 62 Landlord-Friendly
- State Pennsylvania
- 62 Landlord-Friendly · EVEN
- County
- — inherits STATE
- City
- — inherits STATE
ZIP-level market 18821
- Active inventory
- 9
- Price-to-rent
- 9.8×
Monthly cashflow live
- Estimated rent
- $1,364 medium interval (Pro) →
- Mortgage (P&I)
- −$839
- Tax from tax record
- −$213 /mo · $2,560/yr
- Insurance
- −$67
- HOA
- −$0
- Vacancy / Maint / Mgmt
- −$286
- Net cashflow
- $-41
Break-even live
Sensitivity live
| Price | -10% $49 | -5% $4 | +0% $-41 | +5% $-87 | +10% $-132 |
|---|---|---|---|---|---|
| Rent | -10% $-149 | -5% $-95 | +0% $-41 | +5% $13 | +10% $66 |
| Rate | -1.0pp $39 | -0.5pp $-1 | base $-41 | +0.5pp $-83 | +1.0pp $-125 |
UW: 25.0% down · 7.5% · 30yr · 1.5% tax · 5.0% vac · 8.0% maint · 8.0% mgmt
Financing live
Cash to close
- Down payment
- $39,975
- Closing costs
- $4,797
- Reserves months
- —
- Total cash needed
- —
Loan-product check · same deal, 3 products live
Conventional
25% down · 7.5% · 30yr
- Down + closing
- —
- Monthly P&I
- —
- Monthly cashflow
- —
- DSCR
- —
- Eligible?
- —
Personal DTI + credit; lowest rate.
DSCR
20% down · 8.5% · 30yr
- Down + closing
- —
- Monthly P&I
- —
- Monthly cashflow
- —
- DSCR
- —
- Eligible?
- —
No personal income docs; deal must DSCR.
Hard money
10% down · 12.0% · 12mo
- Down + closing
- —
- Monthly P&I
- —
- Monthly cashflow
- —
- DSCR
- —
- Eligible?
- —
Short-term bridge; refi at stabilization.
Listing history 18 events
-
2026-06-21days on market $159,900 Active 30 DOM
-
2026-06-21days on market $159,900 Active 29 DOM
-
2026-06-18days on market $159,900 Active 27 DOM
-
2026-06-17days on market $159,900 Active 26 DOM
-
2026-06-16days on market $159,900 Active 25 DOM
-
2026-06-15days on market $159,900 Active 24 DOM
-
2026-06-13days on market $159,900 Active 22 DOM
-
2026-06-12days on market $159,900 Active 21 DOM
-
2026-06-09days on market $159,900 Active 18 DOM
-
2026-06-08days on market $159,900 Active 17 DOM
-
2026-06-08days on market $159,900 Active 16 DOM
-
2026-06-07days on market $159,900 Active 15 DOM
-
2026-06-04days on market $159,900 Active 12 DOM
-
2026-06-02days on market $159,900 Active 11 DOM
-
2026-06-01days on market $159,900 Active 10 DOM
-
2026-05-31days on market $159,900 Active 9 DOM
-
2026-05-22$159,900 Active
-
2011-08-20$140,000
ⓘ Source: listings_history table (triggers on properties + properties_extension) + one-shot
backfill from property_details.listing_events for pre-trigger history.
Tax reassessment forecast PA · Partial reset (capped growth)
- Current annual tax
- $2,560 · $213/mo
- Projected year-2 tax
- $2,560 · $213/mo
- Expected delta
- $0/yr ($0/mo · 0.0%)
ⓘ Screening estimate from a state-policy table — verify with the county assessor before closing.
Climate risk First Street
- Flood 1/10 Low FEMA zone X (unshaded) · 0% chance over 30 yrs
- Wildfire 1/10 Low
- Heat 3/10 Moderate 7 d/yr ≥92°F today · 16 d/yr by 30 yrs out
- Wind 2/10 Low 3% chance of damaging wind over 30 yrs
- Air quality 2/10 Low 0 unhealthy d/yr today · 1 by 30 yrs out
Nearby sold comps map
Loading sold comps map…
Walkable amenities ~0.75 mi
Loading nearby amenities…
Taxation est. · year 1
- Rental income
- $16,363
- − Mortgage interest
- −$8,957
- − Property taxes
- −$2,560
- − Insurance
- −$800
- − Repairs & maintenance
- −$1,309
- − Management
- −$1,309
- − Depreciation
- −$4,652
- Taxable loss
- −$3,223
- Est. tax savings @ 24.0%
- +$773
- After-tax cash flow
- $279/yr
For passive investors: Depreciation is non-cash, so a rental often shows a tax loss while cash-flowing — sheltering income. Rental losses are passive: they offset passive income freely, and up to $25,000/yr can offset ordinary (W-2) income if you actively participate and your MAGI is under $100k (phasing out to $0 by $150k); unused losses carry forward. On sale, claimed depreciation is recaptured at up to 25%, and gains may owe capital-gains tax (a 1031 exchange can defer both). Figures are a year-1 estimate at your 24.0% rate — not tax advice; consult a CPA.
Schools (NCES district)
- District
- Blue Ridge SD
- NCES district ID
- 4203900
- Math proficiency
- 29% ▼ -15.00%
- Reading proficiency
- 56% ▼ -10.00%
- Median HH income
- $45,421
- Composite
- 36.02/100
- National rank
- #4781
- State rank
- #319 of 539 in PA
Livability — Great Bend
- Score
- 67/100
- State rank
- #1008
- US rank
- #11121
Category grades
Schools grade is shown separately in the Schools card above.
Census & demographics
- Census place
- Great Bend, PA
- Population (ZIP)
- 1,046
Population outlook (Susquehanna County) Hauer SSP2
- Today (2025)
- 37,552 people
- By 2030
- 35,270 · -6.1%
- By 2040
- 30,663 · -18.3%
- By 2050
- 26,492 · -29.5%
- By 2075
- 19,658 · -47.7%
- By 2100
- 15,179 · -59.6%
Race, ethnicity, and origin ACS 2023
- Neighborhood character
- Predominantly White (91%)
- Race & ethnicity
- White 91% Two or more races 6% Hispanic / Latino 3% Asian 2%
- Common ancestry
- Romanian 3% Russian 2% Iranian 2%
- Foreign-born
- 3% · China, Canada, Vietnam
- Languages at home
- 97% English-only · Spanish 1% Chinese 1%
Political lean MEDSL · Susquehanna
- 2024 margin
- Solid R (+44.7) · D 27.2% · R 71.9%
- 2008→2024 swing
- -33.0pp toward R · 2008: -11.7pp · 2024: -44.7pp
- All cycles
- 2024: R+44.7 2020: R+41.2 2016: R+42.9 2012: R+21.4 2008: R+11.7
Not yet ingested
- Civics
- —
Market trends
- HPI YoY
- —
- Current HPI
- —
- Rent YoY
- —
- Metro
- —
- State GDP YoY
- ▲ 1.68%
- F500 in state
- 34
Industry mix (Fortune 500 HQ in PA)
| Industry | F500 HQs | Revenue |
|---|---|---|
| Healthcare | 2 | $309B |
|
||
| Insurance | 2 | $27B |
|
||
| Telecommunications / Media | 1 | $124B |
|
||
| Industrial Distribution | 1 | $22B |
|
||
| Financial Services | 1 | $20B |
|
||
| Chemicals / Materials | 1 | $18B |
|
||
Price history
+14.2% since first listed2 events — show timeline
- 2026-05-22 Listed $159,900 GSBR as distributed by MLS GRID
- 2011-08-20 Listed $140,000 GSBR as distributed by MLS GRID
Property tax history
+1.7%/yrLatest (2026): $2,560 · +7.2% YoY. Source: county tax records.
Cash-flow waterfall
monthlySold comps — $/sqft
last 12 mo · ≤1 miLoading sold comps…