321 Gabriels Frk · Phelps, KY
Flood risk No data
- FEMA flood zone
- —
- Chance of flooding over 30 yrs
- —
- Est. flood insurance / yr
- —
Fire risk No data
- Est. fire insurance / yr
- —
Heat risk No data
- Hot days now (above threshold)
- —
- Hot days in 30 yrs
- —
Wind risk No data
- Chance of severe wind over 30 yrs
- —
Air-quality risk No data
- Unhealthy air days now
- —
- Unhealthy air days in 30 yrs
- —
Risk factors via First Street. Map © Google.
Why this score? — see what drove the B grade
The composite is a weighted blend of 9 inputs, each scored 0–100. Each bar is that input's sub-score; the figure is the points it added to the 100-point composite (weight × sub-score).
- Cash flow +30.0/30.0
- DSCR +10.0/10.0
- 1% rule +8.7/10.0
- ARV discount +7.5/15.0
- Appreciation +6.6/10.0
- Schools +2.6/10.0
- Rent growth +2.5/5.0
- Livability +2.5/5.0
- Condition / age +2.5/5.0
$85,000
🖨 Deal sheet 📄 Offer letter ✓ Due diligence
Listing remarks MLS
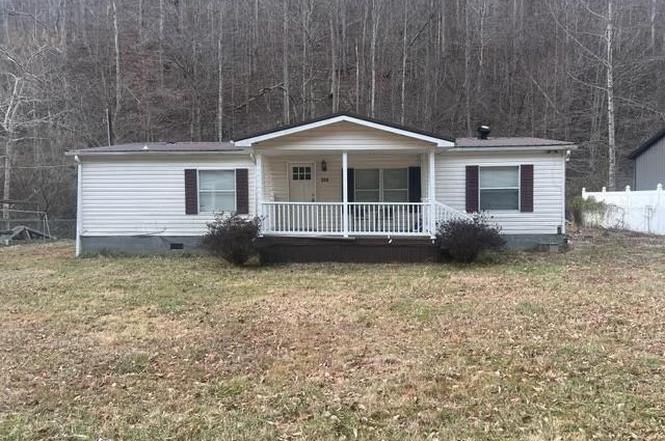
Charming 3 bedroom, 1.5 bath doublewide available for immediate occupancy. This home sits on nearly 1/2 acres with a nice fenced in yard. Located in a peaceful neighborhood, don't miss your chance to own this delightful home! Call today to schedule your private showing.
Key facts
- Fenced in yard
- 0.45 acre lot
- Built 1992
Tags
Neighborhood map
What this means for you Summary
Snapshot
- This is a 3-bed/1.5-bath manufactured listed at $85k.
Deal economics
- At list price, monthly cash flow is $333 ($4k/yr) — positive.
- The deal already cash-flows at list — no discount required.
- Meets the 1% rule at list price ($1k rent vs $85k).
- Recommended offer: $80k (6.0% below list) — sets the bar for market timing.
Location & tenants
- Location reads 50/100 on livability (#504 in KY) — a working-class tenant base; expect higher turnover. Strengths: cost of living A+; Watch: amenities F, commute F, employment F.
- Pike County (rural): math 24% / reading 40% proficiency, ranked #98 of 165 in KY (top 59%) — families likely to look elsewhere, expect single-tenant / working-renter base with shorter leases.
- Zoned schools: Belfry Middle School (math 27% / reading 44%, grade F, #94 of 217 statewide, top 44%, 349 students, 75% FRL); Belfry High School (math 17% / reading 42%, grade F, #127 of 254 statewide, top 58%, 531 students, 62% FRL) — zoned schools average 69% FRL vs 54% district-wide (15 pts higher); higher-poverty schools than district average — tighter screening recommended.
- Market conditions: 13 active listings in the ZIP; 4 units permitted in Pike County in 2024 (0 in 5+ unit buildings).
Forward outlook
- In year one you build about $3k of equity ($588 loan paydown + $3k appreciation (3.2% local appreciation)).
- Pike County population projected at -33% by 2050 — secular population decline; favor cash flow + early exit over multi-decade hold.
- At projected returns (3.2% appreciation + 3.0% rent growth), your $24k cash investment doubles in ~4 years — after that, you're playing with house money.
- By year 10, paydown + projected appreciation supports a ~$32k cash-out refi (75% LTV) — recoverable capital for the next deal without selling this one.
Negotiation context
- It's been on market 88 days — a 6% lower offer ($80k) is reasonable based on typical stale-listing flexibility.
- 3 sale attempts with the ask held roughly flat each time — persistent listings suggest the price (not the market) is what's stuck; bring a comps-based counter.
Questions for the listing agent
- It's been on market 88 days. Have you received any prior offers? Is the seller open to a 6% concession, seller financing, or rate buy-down credit?
- Why hasn't it sold? Are there any deal-killer items the seller is aware of (foundation, flood, title, zoning, code violations)?
- Is there a deadline driving the sale (1031 exchange, divorce, estate, relocation)? That informs how much negotiation room exists.
- Schools are F-rated, which usually means shorter tenancies and higher turnover. Who's the typical renter profile here, and what's been the actual vacancy rate?
- What's the average days-on-market for RENTAL listings here right now (not sales)? A rising rental-DOM trend means longer vacancies and softer asking-rent achievability than the comps imply.
- What's the recent tenant-quality profile in this submarket — average credit score on applications, eviction rate, late-payment / NSF rate, and stable-employment percentage? A property-management company in the area should have these aggregated.
- How much new for-sale + rental construction is in the pipeline within 1–3 miles? Heavy new supply typically softens prices + rents 12–24 months out; constrained supply supports both.
Investment metrics
- 1% rule
- 1.37% ✓
- Cap rate
- 10.99%
- Cash-on-cash
- 16.77%
- DSCR
- 1.75
- GRM
- 6.1
CMA / ARV
No comps found within radius.
Projected returns pro-forma
3.23% appreciation · 3.0% rent growth · sell at horizon
- IRR
- 23.7%
- Equity multiple
- 2.36×
- Total profit
- $32,455
- Equity at exit
- $39,304
- IRR
- 24.4%
- Equity multiple
- 4.56×
- Total profit
- $84,642
- Equity at exit
- $61,429
Cash invested: $23,800 (down + closing). Projections, not guarantees.
Landlord ↔ Tenant lean methodology
- Overall (STATE)
- 83 Strongly Landlord-Friendly
- State Kentucky
- 83 Strongly Landlord-Friendly · R+16
- County
- — inherits STATE
- City
- — inherits STATE
ZIP-level market 41539
- Home prices YoY
- 2.5%
- Active inventory
- 13
- Price-to-rent
- 6.1×
Monthly cashflow live
- Estimated rent
- $1,164 medium interval (Pro) →
- Mortgage (P&I)
- −$446
- Tax est. 1.5%
- −$106 /mo · $1,275/yr
- Insurance
- −$35
- HOA
- −$0
- Vacancy / Maint / Mgmt
- −$245
- Net cashflow
- $333
Break-even live
UW: 25.0% down · 7.5% · 30yr · 1.5% tax · 5.0% vac · 8.0% maint · 8.0% mgmt
Financing live
Cash to close
- Down payment
- $21,250
- Closing costs
- $2,550
- Reserves months
- —
- Total cash needed
- —
Loan-product check · same deal, 3 products live
Conventional
25% down · 7.5% · 30yr
- Down + closing
- —
- Monthly P&I
- —
- Monthly cashflow
- —
- DSCR
- —
- Eligible?
- —
Personal DTI + credit; lowest rate.
DSCR
20% down · 8.5% · 30yr
- Down + closing
- —
- Monthly P&I
- —
- Monthly cashflow
- —
- DSCR
- —
- Eligible?
- —
No personal income docs; deal must DSCR.
Hard money
10% down · 12.0% · 12mo
- Down + closing
- —
- Monthly P&I
- —
- Monthly cashflow
- —
- DSCR
- —
- Eligible?
- —
Short-term bridge; refi at stabilization.
Listing history 9 events
-
2026-04-24soldstatus $75,000 Closed 270-char remark
Show marketing remark (270 chars)
Charming 3 bedroom, 1.5 bath doublewide available for immediate occupancy. This home sits on nearly 1/2 acres with a nice fenced in yard. Located in a peaceful neighborhood, don't miss your chance to own this delightful home! Call today to schedule your private showing.
-
2026-04-20status Pending 270-char remark
Show marketing remark (270 chars)
Charming 3 bedroom, 1.5 bath doublewide available for immediate occupancy. This home sits on nearly 1/2 acres with a nice fenced in yard. Located in a peaceful neighborhood, don't miss your chance to own this delightful home! Call today to schedule your private showing.
-
2026-04-20status Pending
Show marketing remark (270 chars)
Charming 3 bedroom, 1.5 bath doublewide available for immediate occupancy. This home sits on nearly 1/2 acres with a nice fenced in yard. Located in a peaceful neighborhood, don't miss your chance to own this delightful home! Call today to schedule your private showing.
-
2026-01-21$85,000 Active 270-char remark
Show marketing remark (270 chars)
Charming 3 bedroom, 1.5 bath doublewide available for immediate occupancy. This home sits on nearly 1/2 acres with a nice fenced in yard. Located in a peaceful neighborhood, don't miss your chance to own this delightful home! Call today to schedule your private showing.
-
2026-01-20$85,000 Active
-
2025-08-19price $109,000
-
2025-06-05$119,000 Active
-
2023-07-03soldstatus $67,000
-
2011-03-07soldstatus $67,000
ⓘ Source: listings_history table (triggers on properties + properties_extension) + one-shot
backfill from property_details.listing_events for pre-trigger history.
Nearby sold comps map
Loading sold comps map…
Walkable amenities ~0.75 mi
Loading nearby amenities…
Taxation est. · year 1
- Rental income
- $13,974
- − Mortgage interest
- −$4,761
- − Property taxes
- −$1,275
- − Insurance
- −$425
- − Repairs & maintenance
- −$1,118
- − Management
- −$1,118
- − Depreciation
- −$2,473
- Taxable income
- $2,804
- Est. tax owed @ 24.0%
- −$673
- After-tax cash flow
- $3,317/yr
For passive investors: Depreciation is non-cash, so a rental often shows a tax loss while cash-flowing — sheltering income. Rental losses are passive: they offset passive income freely, and up to $25,000/yr can offset ordinary (W-2) income if you actively participate and your MAGI is under $100k (phasing out to $0 by $150k); unused losses carry forward. On sale, claimed depreciation is recaptured at up to 25%, and gains may owe capital-gains tax (a 1031 exchange can defer both). Figures are a year-1 estimate at your 24.0% rate — not tax advice; consult a CPA.
Schools (NCES district)
- District
- Pike County
- NCES district ID
- 2104800
- Math proficiency
- 24% ▼ -24.00%
- Reading proficiency
- 40% ▼ -20.00%
- Median HH income
- $32,601
- Composite
- 26.14/100
- National rank
- #7276
- State rank
- #98 of 165 in KY
Livability — Phelps
- Score
- 50/100
- State rank
- #504
- US rank
- #25548
Category grades
Schools grade is shown separately in the Schools card above.
Census & demographics
- Population (ZIP)
- 1,486
Population outlook (Pike County) Hauer SSP2
- Today (2025)
- 55,108 people
- By 2030
- 51,235 · -7.0%
- By 2040
- 43,573 · -20.9%
- By 2050
- 36,797 · -33.2%
- By 2075
- 24,330 · -55.9%
- By 2100
- 15,611 · -71.7%
Race, ethnicity, and origin ACS 2023
- Neighborhood character
- Predominantly White (85%)
- Race & ethnicity
- White 85% Two or more races 10% Hispanic / Latino 4%
- Common ancestry
- Scottish 1% Slovak 1% Lithuanian 1%
- Languages at home
- 98% English-only · Spanish 2%
Political lean MEDSL · Pike
- 2024 margin
- Solid R (+65.4) · D 16.8% · R 82.2%
- 2008→2024 swing
- -51.6pp toward R · 2008: -13.8pp · 2024: -65.4pp
- All cycles
- 2024: R+65.4 2020: R+60.7 2016: R+62.8 2012: R+50.5 2008: R+13.8
Not yet ingested
- Civics
- —
Market trends
- HPI YoY
- ▲ 3.23%
- Current HPI
- 135.053
- Rent YoY
- —
- Metro
- —
- State GDP YoY
- ▲ 1.81%
- F500 in state
- 4
Industry mix (Fortune 500 HQ in KY)
| Industry | F500 HQs | Revenue |
|---|---|---|
| Healthcare | 1 | $118B |
|
||
| Food / Beverage | 1 | $7B |
|
||
Price history
+11.9% since first listed9 events — show timeline
- 2026-04-24 Sold (MLS) $75,000 EKAR
- 2026-04-20 Pending — EKAR
- 2026-04-20 Pending — ImagineMLS
- 2026-01-21 Listed $85,000 EKAR
- 2026-01-20 Listed $85,000 ImagineMLS
- 2025-08-19 Price Changed $109,000 EKAR
- 2025-06-05 Listed $119,000 EKAR
- 2023-07-03 Sold (Public Records) $67,000 Public Records
- 2011-03-07 Sold (Public Records) $67,000 Public Records
Property tax history
-15.7%/yrLatest (2025): $48 · +0.0% YoY. Source: county tax records.
Cash-flow waterfall
monthlySold comps — $/sqft
last 12 mo · ≤1 miLoading sold comps…