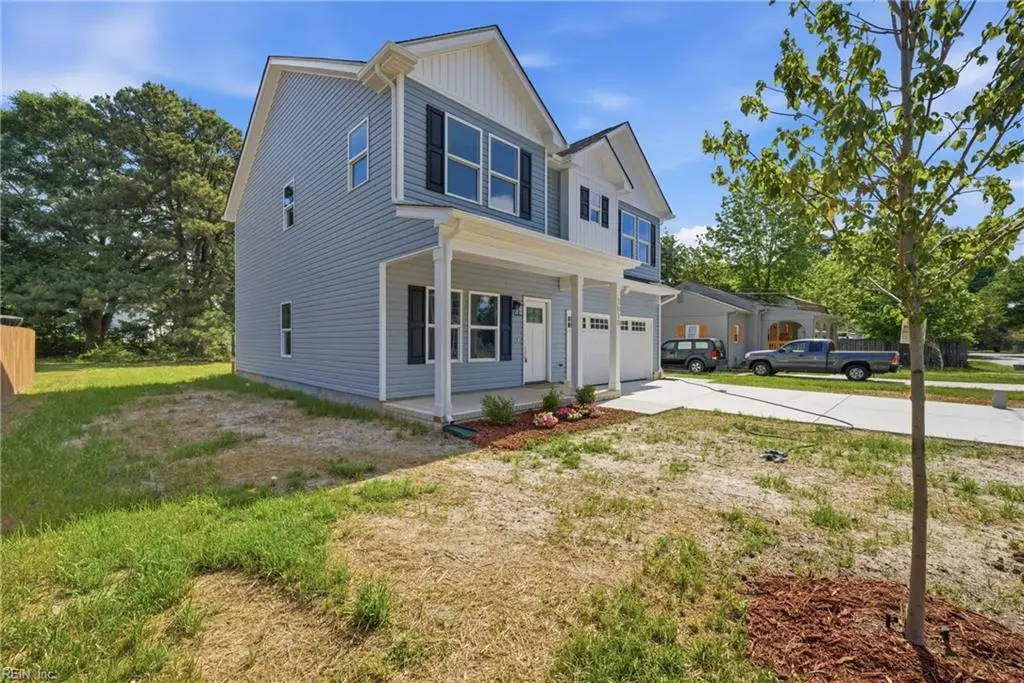
3010 Smithfield Rd · Portsmouth, VA
Flood risk 3/10 · Minor
- FEMA flood zone
- X (unshaded)
- Chance of flooding over 30 yrs
- 0.2%
- Est. flood insurance / yr
- $507 – $1,088
Fire risk 1/10 · Minimal
- Est. fire insurance / yr
- $666 – $1,236
Heat risk 9/10 · Severe
- Hot days now (above 106°F)
- 7 days/yr
- Hot days in 30 yrs
- 16 days/yr
Wind risk 8/10 · Major
- Chance of severe wind over 30 yrs
- 80.0%
Air-quality risk 5/10 · Moderate
- Unhealthy air days now
- 6 days/yr
- Unhealthy air days in 30 yrs
- 7 days/yr
Risk factors via First Street. Map © Google.
Why this score? — see what drove the D- grade
The composite is a weighted blend of 9 inputs, each scored 0–100. Each bar is that input's sub-score; the figure is the points it added to the 100-point composite (weight × sub-score).
- Appreciation +10.0/10.0
- Cash flow +6.5/30.0
- ARV discount +4.4/15.0
- Schools +3.9/10.0
- Livability +3.7/5.0
- Rent growth +3.5/5.0
- Condition / age +2.5/5.0
- 1% rule +1.2/10.0
- DSCR +0.7/10.0
$409,900
🖨 Deal sheet (PDF) 📄 Offer letter ✓ Due diligence
Listing remarks
As soon as you get here you'll see how much attention to detail and pride goes into a home built by American Quality Enterprises. Awesome design and finishes on an enormous over . 25 acre lot that backs up to a tranquil pond. Wide plank lvp compliments the 1st floor living areas. Spacious great room open to dynamite kitchen with full stainless appliance package including fridge. Quartz counters throughout. Soft close cabinets with tile back splash. Primary suite is incredible with 3 closets, double tray ceiling with crown molding, barn door at luxury bath with custom tiled shower, double vanity with powered mirrors! Ceiling fans in all bedrooms, incredible value here. Includes builder warra
Key facts
- Quartz counters
- 3 closets
- Tile back splash
Tags
Property features AI
Finance
- Other: Warranty plan
- HOA & community: No HOA fees listed
Exterior
- Parking: Attached 2-car garage; Multi-car parking; Off-street parking; Driveway space (garage approx. 395 sq ft)
- Utilities: City/County water; City/County sewer; Electric service
- Home design: Detached property; Transitional style; 2 stories; Slab foundation; Vinyl siding; Asphalt shingle roof
- Construction: Vinyl siding construction; Slab foundation; Asphalt shingle roof
- Exterior features: Patio; Pond and wooded views; On waterfront
Interior
- Kitchen: Electric range; Microwave; Refrigerator; Dishwasher; Disposal
- Bedrooms: Master bedroom (2nd level); Additional bedroom (2nd level)
- Flooring: Carpet; Ceramic; Laminate
- Bathrooms: 2 full bathrooms; 1 half bathroom
- Heating & cooling: Heat pump heating; Electric heating; Central air conditioning; Electric water heater
- Interior features: Ceiling fan; Primary double sink; Pull-down attic stairs; Walk-in closet; Attic; Pantry; Porch; Utility closet
- Laundry & utility: Washer hookup; Dryer hookup; Utility room (2nd level)
Neighborhood map
What this means for you Summary
Snapshot
- This is a 4-bed/2.5-bath single-family listed at $410k.
Deal economics
- At list price, monthly cash flow is $-700 ($-8k/yr) — negative.
- To cash-flow at today's rent, offer at most $286k (30.2% below list).
- To meet the 1% rule (rent ≥ 1% of price), the offer needs to be $254k (38.0% below list).
- Recommended offer: $254k (38.0% below list) — sets the bar for 1% rule.
Location & tenants
- Location reads 73/100 on livability (#172 in VA) — a middle-class / working-renter tenant base. Strengths: amenities A+, cost of living A+, housing A+; Watch: employment C-, crime F, commute F.
- Portsmouth City Public School District (urban): math 34% / reading 58% proficiency, ranked #107 of 131 in VA (top 82%) — families likely to look elsewhere, expect single-tenant / working-renter base with shorter leases.
- Zoned schools: Victory Elementary (math 37% / reading 57%, grade D-, #794 of 1,108 statewide, top 74%, 589 students, 117% FRL); Cradock Middle (math 32% / reading 62%, grade D+, #257 of 342 statewide, top 77%, 533 students, 100% FRL); Manor High (math 48% / reading 75%, grade B-, #240 of 319 statewide, top 75%, 1,236 students, 99% FRL) — zoned schools average 105% FRL vs 60% district-wide (45 pts higher); higher-poverty schools than district average — tighter screening recommended.
- Market conditions: Rents rising (+4.0%/yr); 65 active listings in the ZIP; 9 comparable units currently listed for rent nearby; rentals at typical pace (median 26d on market — plan ~3-4 weeks tenant-placement turnaround); 44% of comp listings sitting > 30 days — soft ceiling on asking rent; 300 units permitted in Portsmouth city in 2024 (112 in 5+ unit buildings).
- At $2,541/mo this rent would consume 62% of the median local household income ($49k/yr) (locally 534% of renters already pay >50% of income on rent) — very limited rent-growth headroom before tenants either downsize or default.
Forward outlook
- In year one you build about $44k of equity ($3k loan paydown + $41k appreciation (10.0% local appreciation)).
- By year 2, paydown + projected appreciation supports a ~$70k cash-out refi (75% LTV) — recoverable capital for the next deal without selling this one.
Negotiation context
- It's been on market 18 days — a 2% lower offer ($404k) is reasonable based on typical stale-listing flexibility.
Risks & watch-outs
- Climate carrying-cost: severe wind risk, 80% chance of damaging wind over 30y; extreme-heat days projected 7→16/yr by 2055 (HVAC capex compounding) — expect insurance premiums to compound above CPI over the hold.
Questions for the listing agent
- What do current leases actually rent for vs. the listed asking? Can we see a recent rent roll and the last 12 months of T-12 income?
- Is there a deadline driving the sale (1031 exchange, divorce, estate, relocation)? That informs how much negotiation room exists.
- Schools are B-rated — typically a magnet for longer-tenancy family renters. What's the average tenant stay here, and is there a school-zone premium baked into asking?
- Crime grade is F in this area — have there been break-ins, vandalism, or insurance claims at this property in the last 3 years? What carrier currently insures it and at what premium?
- The area grade is low — what's the realistic commute time and amenity access for the typical tenant pool here? Any planned neighborhood developments (good or bad) we should know about?
- What's the average days-on-market for RENTAL listings here right now (not sales)? A rising rental-DOM trend means longer vacancies and softer asking-rent achievability than the comps imply.
- What's the recent tenant-quality profile in this submarket — average credit score on applications, eviction rate, late-payment / NSF rate, and stable-employment percentage? A property-management company in the area should have these aggregated.
- How much new for-sale + rental construction is in the pipeline within 1–3 miles? Heavy new supply typically softens prices + rents 12–24 months out; constrained supply supports both.
Investment metrics
- 1% rule
- 0.62% ✗
- Cap rate
- 4.24%
- Cash-on-cash
- -7.32%
- DSCR
- 0.67
- GRM
- 13.4
CMA / ARV
- ARV (on-the-fly)
- $383,460
- Comps found
- 12
Show comp detail 12 sales within ~0.75 mi
| Address | Dist | Beds/Ba | Sqft | Sold | Price | $/sf | Match |
|---|---|---|---|---|---|---|---|
| 303 Gust Ln | 0.27mi | 4/2.5 | 2,449 (+5%) | 12mo | $345,000 | $141 | 68 |
| 2539 Bird Ln | 0.53mi | 4/3.0 | 2,308 (-1%) | 10mo | $399,000 | $173 | 64 |
| 305 Taft Dr | 0.49mi | 4/3.0 | 2,414 (+4%) | 9mo | $345,000 | $143 | 61 |
| 3215 Greenwood Dr | 0.48mi | 3/2.5 (-1) | 2,172 (-6%) | 1mo | $375,000 | $173 | 61 |
| 616 Normandy St | 0.37mi | 3/2.5 (-1) | 2,184 (-6%) | 9mo | $340,000 | $156 | 60 |
| 2922 Greenwood Dr | 0.66mi | 4/3.0 | 2,420 (+4%) | 8mo | $380,000 | $157 | 54 |
| 507 Water Lilly Rd | 0.42mi | 3/2.5 (-1) | 2,138 (-8%) | 10mo | $325,000 | $152 | 53 |
| 525 Normandy St | 0.37mi | 4/2.5 | 2,016 (-13%) | 11mo | $349,000 | $173 | 51 |
| 248 Harmony Dr | 0.67mi | 4/2.5 | 2,112 (-9%) | 3mo | $364,000 | $172 | 51 |
| 220 Avondale Rd | 0.35mi | 5/3.0 (+1) | 2,000 (-14%) | 6mo | $300,000 | $150 | 48 |
| 310 Harmony Dr | 0.69mi | 4/2.5 | 2,112 (-9%) | 9mo | $348,000 | $165 | 45 |
| 1344 Deep Creek Blvd | 0.71mi | 4/2.5 | 2,520 (+8%) | 9mo | $435,000 | $173 | 45 |
Match score weights: distance 35% · size 25% · config 20% · recency 20%. Top-matched comps best support the ARV.
Projected returns pro-forma
10.0% appreciation · 3.97% rent growth · sell at horizon
- IRR
- 19.3%
- Equity multiple
- 2.58×
- Total profit
- $181,137
- Equity at exit
- $369,270
- IRR
- 18.0%
- Equity multiple
- 6.00×
- Total profit
- $573,678
- Equity at exit
- $796,346
Cash invested: $114,772 (down + closing). Projections, not guarantees.
Landlord ↔ Tenant lean methodology
- Overall (STATE)
- 55 Moderately Landlord-Leaning
- State Virginia
- 55 Moderately Landlord-Leaning · D+2
- County
- — inherits STATE
- City
- — inherits STATE
ZIP-level market 23702
- Home prices YoY
- 5.2%
- Rents YoY
- 4.0%
- Active inventory
- 65
- Price-to-rent
- 13.4×
Monthly cashflow live
- Estimated rent
- $2,541 high interval (Pro) →
- Mortgage (P&I)
- −$2,150
- Tax from tax record
- −$387 /mo · $4,643/yr
- Insurance
- −$171
- HOA
- −$0
- Vacancy / Maint / Mgmt
- −$534
- Net cashflow
- $-700
Break-even live
Sensitivity live
| Price | -10% $-468 | -5% $-584 | +0% $-700 | +5% $-816 | +10% $-932 |
|---|---|---|---|---|---|
| Rent | -10% $-901 | -5% $-800 | +0% $-700 | +5% $-599 | +10% $-499 |
| Rate | -1.0pp $-493 | -0.5pp $-596 | base $-700 | +0.5pp $-806 | +1.0pp $-914 |
UW: 25.0% down · 7.5% · 30yr · 1.5% tax · 5.0% vac · 8.0% maint · 8.0% mgmt
Financing live
Cash to close
- Down payment
- $102,475
- Closing costs
- $12,297
- Reserves months
- —
- Total cash needed
- —
Loan-product check · same deal, 3 products live
Conventional
25% down · 7.5% · 30yr
- Down + closing
- —
- Monthly P&I
- —
- Monthly cashflow
- —
- DSCR
- —
- Eligible?
- —
Personal DTI + credit; lowest rate.
DSCR
20% down · 8.5% · 30yr
- Down + closing
- —
- Monthly P&I
- —
- Monthly cashflow
- —
- DSCR
- —
- Eligible?
- —
No personal income docs; deal must DSCR.
Hard money
10% down · 12.0% · 12mo
- Down + closing
- —
- Monthly P&I
- —
- Monthly cashflow
- —
- DSCR
- —
- Eligible?
- —
Short-term bridge; refi at stabilization.
Rent comps 9 comps
| Address | Beds | Baths | Sqft | Rent | $/sqft | DOM | Units | Dist |
|---|---|---|---|---|---|---|---|---|
| 108 Marcy St Portsmouth, VA | 4.0 | 2.5 | 2100 | $2,500 | $1.19 | 45d | 1 | 0.29mi |
| 528 Normandy St Portsmouth, VA | 3.0 | 2.5 | 2262 | $2,800 | $1.24 | 25d | 1 | 0.40mi |
| 521 Weaver Cir Portsmouth, VA | 4.0 | 2.0 | 1890 | $2,125 | $1.12 | 45d | 1 | 0.62mi |
| 203 Median Cir Portsmouth, VA | 4.0 | 2.5 | 2200 | $2,195 | $1.00 | 25d | 1 | 0.68mi |
| 207 Falcon Ave Portsmouth, VA | 3.0 | 2.5 | 1720 | $3,000 | $1.74 | 45d | 1 | 0.78mi |
| 213 Monmouth St Portsmouth, VA | 3.0 | 2.5 | 1800 | $2,450 | $1.36 | 46d | 1 | 1.09mi |
| 2117 Battery Park Rd Chesapeake, VA | 5.0 | 3.0 | 2500 | $3,500 | $1.40 | 25d | 1 | 1.20mi |
| 10 Parkside Pl Portsmouth, VA | 3.0 | 2.0 | 1800 | $2,095 | $1.16 | 19d | 1 | 1.34mi |
| 22 Radford St Portsmouth, VA | 4.0 | 3.0 | 1651 | $2,550 | $1.54 | 5d | 1 | 1.46mi |
Listing history 7 events
-
2026-06-08statusdays on market $409,900 Under Contract 18 DOM
-
2026-06-07days on market $409,900 Active Under Contract 17 DOM
-
2026-06-03days on market $409,900 Active Under Contract 13 DOM
-
2026-06-02days on market $409,900 Active Under Contract 12 DOM
-
2026-06-01days on market $409,900 Active Under Contract 11 DOM
-
2026-05-31days on market $409,900 Active Under Contract 10 DOM
-
2026-05-21$409,900 Active
ⓘ Source: listings_history table (triggers on properties + properties_extension) + one-shot
backfill from property_details.listing_events for pre-trigger history.
Tax reassessment forecast VA · Resets to sale price
- Current annual tax
- $4,643 · $387/mo
- Projected year-2 tax
- $4,643 · $387/mo
- Expected delta
- $0/yr ($0/mo · 0.0%)
ⓘ Screening estimate from a state-policy table — verify with the county assessor before closing.
Climate risk First Street
- Flood 3/10 Moderate FEMA zone X (unshaded) · 20% chance over 30 yrs
- Wildfire 1/10 Low
- Heat 9/10 Extreme 7 d/yr ≥106°F today · 16 d/yr by 30 yrs out
- Wind 8/10 Severe 80% chance of damaging wind over 30 yrs
- Air quality 5/10 Major 6 unhealthy d/yr today · 7 by 30 yrs out
Nearby sold comps map
Loading sold comps map…
Walkable amenities ~0.75 mi
Loading nearby amenities…
Taxation est. · year 1
- Rental income
- $30,493
- − Mortgage interest
- −$22,961
- − Property taxes
- −$4,643
- − Insurance
- −$2,050
- − Repairs & maintenance
- −$2,439
- − Management
- −$2,439
- − Depreciation
- −$11,924
- Taxable loss
- −$15,963
- Est. tax savings @ 24.0%
- +$3,831
- After-tax cash flow
- $-4,566/yr
For passive investors: Depreciation is non-cash, so a rental often shows a tax loss while cash-flowing — sheltering income. Rental losses are passive: they offset passive income freely, and up to $25,000/yr can offset ordinary (W-2) income if you actively participate and your MAGI is under $100k (phasing out to $0 by $150k); unused losses carry forward. On sale, claimed depreciation is recaptured at up to 25%, and gains may owe capital-gains tax (a 1031 exchange can defer both). Figures are a year-1 estimate at your 24.0% rate — not tax advice; consult a CPA.
Schools (NCES district)
- District
- Portsmouth City Public School District
- NCES district ID
- 5103000
- Math proficiency
- 34% ▼ -40.00%
- Reading proficiency
- 58% ▼ -12.00%
- Median HH income
- $46,152
- Composite
- 39.01/100
- National rank
- #4071
- State rank
- #107 of 131 in VA
Livability — Portsmouth
- Score
- 73/100
- State rank
- #172
- US rank
- #5381
Category grades
Schools grade is shown separately in the Schools card above.
Census & demographics
- Census place
- Portsmouth, VA
- County
- Portsmouth City · 96,366 people
- City population
- 96,366
- Metro
- Virginia Beach-Norfolk-Newport News, VA-NC
- Population (ZIP)
- 12,485
- Household income
- $48,835
- Rent vs Own
- Severe rent burden
- 534.0
Population outlook (Portsmouth County) Hauer SSP2
- Today (2025)
- 96,730 people
- By 2030
- 96,760 · +0.0%
- By 2040
- 96,573 · -0.2%
- By 2050
- 95,606 · -1.2%
- By 2075
- 93,579 · -3.3%
- By 2100
- 83,756 · -13.4%
Race, ethnicity, and origin ACS 2023
- Neighborhood character
- Diverse neighborhood (Simpson 0.62)
- Race & ethnicity
- Black 50% White 35% Two or more races 9% Hispanic / Latino 8%
- Hispanic origin (detail)
- Mexican 2% Puerto Rican 3%
- Common ancestry
- Lithuanian 1% Italian 1% Slovak 1%
- Foreign-born
- 4% · Canada, South Korea
- Languages at home
- 95% English-only · Spanish 4%
Political lean MEDSL · Portsmouth
- 2024 margin
- Solid D (+38.6) · D 68.6% · R 30.0% · Other 1.4%
- 2008→2024 swing
- -0.7pp no change · 2008: 39.3pp · 2024: 38.6pp
- All cycles
- 2024: D+38.6 2020: D+40.8 2016: D+36.5 2012: D+39.6 2008: D+39.3
Not yet ingested
- Civics
- —
Market trends
- HPI YoY
- ▲ 16.70%
- Current HPI
- 340.0817
- Rent YoY
- ▲ 3.97%
- Metro
- Virginia Beach-Norfolk-Newport News, VA-NC
- State GDP YoY
- ▲ 2.40%
- F500 in state
- 50
Industry mix (Fortune 500 HQ in VA)
| Industry | F500 HQs | Revenue |
|---|---|---|
| Aerospace / Defense | 4 | $236B |
|
||
| Technology / Defense | 3 | $32B |
|
||
| Financial Services | 2 | $176B |
|
||
| Utilities | 2 | $27B |
|
||
| Insurance | 2 | $25B |
|
||
| Technology | 2 | $15B |
|
||
Price history
1 event — show timeline
- 2026-05-21 Listed $409,900 REINMLS
Property tax history
+20.6%/yrLatest (2025): $4,643 · +460.7% YoY. Source: county tax records.
Cash-flow waterfall
monthlySold comps — $/sqft
last 12 mo · ≤1 miLoading sold comps…