13811 Flagstone Dr · Houston, TX
Flood risk 1/10 · Minimal
- FEMA flood zone
- X (unshaded)
- Chance of flooding over 30 yrs
- 0.0%
- Est. flood insurance / yr
- $507 – $1,088
Fire risk 1/10 · Minimal
- Est. fire insurance / yr
- $1,222 – $2,270
Heat risk 9/10 · Severe
- Hot days now (above 110°F)
- 7 days/yr
- Hot days in 30 yrs
- 22 days/yr
Wind risk 8/10 · Major
- Chance of severe wind over 30 yrs
- 99.0%
Air-quality risk 3/10 · Minor
- Unhealthy air days now
- 2 days/yr
- Unhealthy air days in 30 yrs
- 3 days/yr
Risk factors via First Street. Map © Google.
Why this score? — see what drove the D grade
The composite is a weighted blend of 9 inputs, each scored 0–100. Each bar is that input's sub-score; the figure is the points it added to the 100-point composite (weight × sub-score).
- Cash flow +10.4/30.0
- ARV discount +7.9/15.0
- Schools +4.4/10.0
- Appreciation +4.3/10.0
- Livability +3.7/5.0
- 1% rule +3.3/10.0
- DSCR +3.0/10.0
- Rent growth +2.6/5.0
- Condition / age +2.2/5.0
$220,000
🖨 Deal sheet (PDF) 📄 Offer letter ✓ Due diligence
Listing remarks
Investor special! This 3-bedroom, 2-bath home offers a great opportunity for investors, flippers, or buyers looking to add value. Featuring a functional single-story floor plan, spacious living area, attached garage, and a fenced backyard, this property has strong potential for renovation and customization. Situated in an established neighborhood with convenient access to Hwy 290, Hwy 6, shopping, dining, and major employment centers. Whether you're looking for your next fix-and-flip project or a long-term rental investment, this property presents an excellent opportunity to maximize value. Property is being sold as-is.
Key facts
- Spacious living area
- Fenced backyard
- 6,050 sq ft lot
Tags
Property features AI
Finance
- Other: Rooms total: 8; Living area reported as 1,414
- HOA & community: Chimney Hill Community association; Annual association fee; Community clubhouse, playground, and tennis courts; Association fee covers clubhouse and recreation facilities
Exterior
- Parking: Attached 2-car garage
- Utilities: Public sewer
- Home design: Residential property; Built in 1980; Slab foundation; Composition roof
- Construction: Brick and cement siding construction
- Exterior features: Fenced backyard; Subdivision lot
Interior
- Kitchen: Dishwasher; Electric cooktop; Electric oven; Microwave; Granite counters
- Bedrooms: Primary bedroom (First level); Bedroom (First level); Bedroom (First level)
- Flooring: Tile
- Bathrooms: 2 full bathrooms
- Heating & cooling: Central heating (electric); Central air (electric)
- Interior features: Granite counters; Wood-burning fireplace
- Laundry & utility: Electric dryer hookup
Neighborhood map
What this means for you Summary
Snapshot
- This is a 3-bed/2.0-bath single-family listed at $220k. Condition is rated fair.
Deal economics
- At list price, monthly cash flow is $-116 ($-1k/yr) — negative.
- To cash-flow at today's rent, offer at most $203k (7.6% below list).
- To meet the 1% rule (rent ≥ 1% of price), the offer needs to be $182k (17.2% below list).
- Recommended offer: $182k (17.2% below list) — sets the bar for 1% rule.
- Cap rate 5.7% vs local median 3.2% in Houston — top-decile yield for the area; either an underpriced asset or a hidden risk that comps aren't pricing in. Stress-test before assuming the spread holds.
Location & tenants
- Location reads 74/100 on livability (#184 in TX, #4,771 nationally) — a middle-class / working-renter tenant base. Strengths: amenities A+, cost of living A+, housing A+; Watch: crime F.
- Cypress-Fairbanks ISD (suburban): math 45% / reading 52% proficiency, ranked #161 of 826 in TX (top 20%) — families likely to look elsewhere, expect single-tenant / working-renter base with shorter leases.
- Zoned schools: Hairgrove El (math 52% / reading 53%, grade C-, #720 of 4,322 statewide, top 17%, 769 students, 88% FRL); Labay Middle (math 46% / reading 47%, grade D+, #443 of 1,662 statewide, top 28%, 1,199 students, 70% FRL); Cypress-Fairbanks J J A E P (12 students, 0% FRL).
- Market conditions: Rents flat; 177 active listings in the ZIP; 40 comparable units currently listed for rent nearby; rentals at typical pace (median 15d on market — plan ~3-4 weeks tenant-placement turnaround); solid renter incomes; 29,883 units permitted in Harris County in 2024 (8,621 in 5+ unit buildings).
Forward outlook
- Local home prices are declining (-1.5%/yr); year-one equity from $2k of loan paydown is wiped out by about $3k of value loss. Plan a longer hold.
- Harris County population projected at +47% by 2050 — long-run rental-demand tailwind backs the buy-and-hold thesis.
Negotiation context
- Only 14 days on market — expect competitive offers; lowballing is unlikely to land.
Risks & watch-outs
- Climate carrying-cost: severe wind risk, 99% chance of damaging wind over 30y; extreme-heat days projected 7→22/yr by 2055 (HVAC capex compounding) — expect insurance premiums to compound above CPI over the hold.
Questions for the listing agent
- What do current leases actually rent for vs. the listed asking? Can we see a recent rent roll and the last 12 months of T-12 income?
- Have any recent inspections been done? Can we get a copy of the seller's disclosures and any deferred-maintenance estimates?
- What does the HOA fee cover, when was the last increase, and are there any pending special assessments or reserve-fund shortfalls?
- Is there a deadline driving the sale (1031 exchange, divorce, estate, relocation)? That informs how much negotiation room exists.
- Schools are D-rated, which usually means shorter tenancies and higher turnover. Who's the typical renter profile here, and what's been the actual vacancy rate?
- Crime grade is F in this area — have there been break-ins, vandalism, or insurance claims at this property in the last 3 years? What carrier currently insures it and at what premium?
- The area grade is low — what's the realistic commute time and amenity access for the typical tenant pool here? Any planned neighborhood developments (good or bad) we should know about?
- What's the average days-on-market for RENTAL listings here right now (not sales)? A rising rental-DOM trend means longer vacancies and softer asking-rent achievability than the comps imply.
- What's the recent tenant-quality profile in this submarket — average credit score on applications, eviction rate, late-payment / NSF rate, and stable-employment percentage? A property-management company in the area should have these aggregated.
- How much new for-sale + rental construction is in the pipeline within 1–3 miles? Heavy new supply typically softens prices + rents 12–24 months out; constrained supply supports both.
Investment metrics
- 1% rule
- 0.83% ✗
- Cap rate
- 5.66%
- Cash-on-cash
- -2.26%
- DSCR
- 0.90
- GRM
- 10.1
CMA / ARV
- ARV (on-the-fly)
- $221,998
- Comps found
- 12
Show comp detail 12 sales within ~0.75 mi
| Address | Dist | Beds/Ba | Sqft | Sold | Price | $/sf | Match |
|---|---|---|---|---|---|---|---|
| 7607 Wovenwood Ln | 0.04mi | 3/2.0 | 1,430 (+1%) | 6mo | $215,000 | $150 | 91 |
| 7611 Millbrae Ln | 0.08mi | 3/2.0 | 1,450 (+2%) | 7mo | $215,000 | $148 | 86 |
| 7439 Kite Hill Dr | 0.20mi | 3/2.0 | 1,356 (-4%) | 2mo | $219,000 | $162 | 82 |
| 7614 Kite Hill Dr | 0.14mi | 3/2.0 | 1,301 (-8%) | 4mo | $195,000 | $150 | 77 |
| 13215 Vista Oro Dr | 0.57mi | 3/1.5 | 1,430 (+1%) | 2mo | $169,900 | $119 | 68 |
| 13322 Chaston Dr | 0.52mi | 3/2.0 | 1,364 (-4%) | 6mo | $219,997 | $161 | 65 |
| 7315 Weatherhill Ln | 0.37mi | 3/2.0 | 1,573 (+11%) | 1mo | $239,900 | $153 | 63 |
| 13222 Noblecrest Dr | 0.59mi | 3/2.0 | 1,348 (-5%) | 2mo | $212,000 | $157 | 62 |
| 7315 Millbrae Ln | 0.34mi | 3/2.0 | 1,589 (+12%) | 4mo | $254,900 | $160 | 60 |
| 13411 Blazey Dr | 0.34mi | 3/2.5 | 1,603 (+13%) | 0mo | $235,000 | $147 | 60 |
| 7331 Burkridge Dr | 0.64mi | 3/2.0 | 1,302 (-8%) | 8mo | $229,900 | $177 | 50 |
| 13122 Eldridge Chase Ct | 0.72mi | 3/2.0 | 1,556 (+10%) | 2mo | $270,000 | $174 | 48 |
Match score weights: distance 35% · size 25% · config 20% · recency 20%. Top-matched comps best support the ARV.
Projected returns pro-forma
-1.47% appreciation · 0.25% rent growth · sell at horizon
- IRR
- -13.5%
- Equity multiple
- 0.46×
- Total profit
- $-33,423
- Equity at exit
- $48,189
- IRR
- -9.4%
- Equity multiple
- 0.28×
- Total profit
- $-44,207
- Equity at exit
- $46,523
Cash invested: $61,600 (down + closing). Projections, not guarantees.
Landlord ↔ Tenant lean methodology
- Overall (STATE)
- 87 Strongly Landlord-Friendly
- State Texas
- 87 Strongly Landlord-Friendly · R+5
- County
- — inherits STATE
- City
- — inherits STATE
ZIP-level market 77041
- Home prices YoY
- -0.6%
- Rents YoY
- 0.2%
- Active inventory
- 177
- Price-to-rent
- 10.1×
Monthly cashflow live
- Estimated rent
- $1,822 high interval (Pro) →
- Mortgage (P&I)
- −$1,154
- Tax est. 1.5%
- −$275 /mo · $3,300/yr
- Insurance
- −$92
- HOA
- −$35
- Vacancy / Maint / Mgmt
- −$383
- Net cashflow
- $-116
Break-even live
Sensitivity live
| Price | -10% $36 | -5% $-40 | +0% $-116 | +5% $-192 | +10% $-268 |
|---|---|---|---|---|---|
| Rent | -10% $-260 | -5% $-188 | +0% $-116 | +5% $-44 | +10% $28 |
| Rate | -1.0pp $-5 | -0.5pp $-60 | base $-116 | +0.5pp $-173 | +1.0pp $-231 |
UW: 25.0% down · 7.5% · 30yr · 1.5% tax · 5.0% vac · 8.0% maint · 8.0% mgmt
Financing live
Cash to close
- Down payment
- $55,000
- Closing costs
- $6,600
- Reserves months
- —
- Total cash needed
- —
Loan-product check · same deal, 3 products live
Conventional
25% down · 7.5% · 30yr
- Down + closing
- —
- Monthly P&I
- —
- Monthly cashflow
- —
- DSCR
- —
- Eligible?
- —
Personal DTI + credit; lowest rate.
DSCR
20% down · 8.5% · 30yr
- Down + closing
- —
- Monthly P&I
- —
- Monthly cashflow
- —
- DSCR
- —
- Eligible?
- —
No personal income docs; deal must DSCR.
Hard money
10% down · 12.0% · 12mo
- Down + closing
- —
- Monthly P&I
- —
- Monthly cashflow
- —
- DSCR
- —
- Eligible?
- —
Short-term bridge; refi at stabilization.
Rent comps 40 comps
| Address | Beds | Baths | Sqft | Rent | $/sqft | DOM | Units | Dist |
|---|---|---|---|---|---|---|---|---|
| 7511 Stamen Dr Houston, TX | 3.0 | 2.5 | 1575 | $2,350 | $1.49 | 45d | 1 | 0.23mi |
| 13200 Firebrick Dr Houston, TX | 2.0 | 2.0 | 1131 | $1,708 | $1.51 | 26d | 1 | 0.65mi |
| 14811 West Rd Houston, TX | 2.0 | 2.0 | 943 | $1,455 | $1.54 | 45d | 1 | 0.77mi |
| 14811 West Rd Houston, TX | 2.0 | 2.0 | 943 | $1,455 | $1.54 | 26d | 1 | 0.77mi |
| 8261 Sunbury Ln Houston, TX | 2.0 | 2.0 | 900 | $1,322 | $1.47 | 45d | 1 | 0.80mi |
| 14811 West Rd Unit 14844 Houston, TX | 3.0 | 2.0 | 1570 | $2,172 | $1.38 | 12d | 1 | 0.80mi |
| 14811 West Rd Unit 422 Houston, TX | 2.0 | 2.0 | 1081 | $1,658 | $1.53 | 9d | 1 | 0.80mi |
| 14811 West Rd Unit 3148 Houston, TX | 3.0 | 2.0 | 1570 | $2,132 | $1.36 | 0d | 1 | 0.80mi |
| 14811 West Rd Unit 425 Houston, TX | 2.0 | 2.0 | 1081 | $1,642 | $1.52 | 0d | 1 | 0.80mi |
| 14811 West Rd Unit 14834 Houston, TX | 2.0 | 2.0 | 1081 | $1,682 | $1.56 | 12d | 1 | 0.80mi |
| 14811 West Rd Unit 14848 Houston, TX | 2.0 | 2.0 | 1187 | $1,809 | $1.52 | 45d | 1 | 0.80mi |
| 14811 West Rd Unit 424 Houston, TX | 2.0 | 2.0 | 1081 | $1,658 | $1.53 | 7d | 1 | 0.80mi |
| 14811 West Rd Unit 14838 Houston, TX | 2.0 | 2.0 | 943 | $1,599 | $1.70 | 14d | 1 | 0.80mi |
| 8335 Columbia Forest Dr Houston, TX | 3.0 | 3.0 | 1767 | $2,000 | $1.13 | 45d | 1 | 0.88mi |
| 8255 Sunbury Ln Unit 8288 Houston, TX | 3.0 | 2.0 | 1185 | $1,561 | $1.32 | 18d | 1 | 0.93mi |
| 8255 Sunbury Ln Apt 424 Houston, TX | 2.0 | 2.0 | 900 | $1,051 | $1.17 | 18d | 1 | 0.93mi |
| 13339 West Rd Houston, TX | 2.0 | 2.0 | 1327 | $1,500 | $1.13 | 45d | 1 | 0.96mi |
| 8255 Sunbury Ln Houston, TX | 1.0–3.0 | 1.0–2.0 | 892 | $1,709 | $1.91 | 1d | 27 | 0.99mi |
| 13330 West Rd Houston, TX | 1.0–3.0 | 1.0–2.0 | 1021 | $1,837 | $1.80 | 0d | 38 | 1.02mi |
| 13333 West Rd Unit 525 Houston, TX | 3.0 | 2.0 | 1337 | $1,873 | $1.40 | 0d | 1 | 1.03mi |
| 13333 West Rd Unit 422 Houston, TX | 2.0 | 2.0 | 995 | $1,415 | $1.42 | 9d | 1 | 1.03mi |
| 13333 West Rd Unit 13366 Houston, TX | 3.0 | 2.0 | 1337 | $1,934 | $1.45 | 45d | 1 | 1.03mi |
| 13333 West Rd Unit 2162 Houston, TX | 2.0 | 2.0 | 995 | $1,415 | $1.42 | 7d | 1 | 1.03mi |
| 13333 West Rd Unit 13370 Houston, TX | 2.0 | 2.0 | 995 | $1,439 | $1.45 | 12d | 1 | 1.03mi |
| 13333 West Rd Unit 2228 Houston, TX | 2.0 | 2.0 | 995 | $1,399 | $1.41 | 0d | 1 | 1.03mi |
| 13333 West Rd Unit 13390 Houston, TX | 2.0 | 2.0 | 995 | $1,500 | $1.51 | 45d | 1 | 1.03mi |
| 13333 West Rd Unit 2165 Houston, TX | 2.0 | 2.0 | 995 | $1,440 | $1.45 | 0d | 1 | 1.03mi |
| 13333 West Rd Unit 3174 Houston, TX | 3.0 | 2.0 | 1337 | $1,924 | $1.44 | 0d | 1 | 1.03mi |
| 8440 Easton Commons Dr Unit 8497 Houston, TX | 2.0 | 2.0 | 907 | $1,233 | $1.36 | 12d | 1 | 1.06mi |
| 8440 Easton Commons Dr Unit 2165 Houston, TX | 2.0 | 2.0 | 907 | $1,193 | $1.32 | 0d | 1 | 1.06mi |
| 13333 West Rd Houston, TX | 2.0 | 2.0 | 1131 | $1,708 | $1.51 | 45d | 1 | 1.09mi |
| 13333 West Rd Houston, TX | 2.0 | 2.0 | 1131 | $1,708 | $1.51 | 14d | 1 | 1.09mi |
| 13333 West Rd Unit 3047 Houston, TX | 3.0 | 2.0 | 1337 | $1,924 | $1.44 | 13d | 1 | 1.11mi |
| 8550 Easton Commons Dr Unit 8583 Houston, TX | 3.0 | 2.0 | 1325 | $1,837 | $1.39 | 18d | 1 | 1.17mi |
| 15125 West Rd Houston, TX | 1.0–3.0 | 1.0–2.0 | 969 | $1,995 | $2.06 | 1d | 29 | 1.19mi |
| 8550 Easton Commons Dr Houston, TX | 1.0–2.0 | 1.0–2.0 | 824 | $1,675 | $2.03 | 1d | 16 | 1.20mi |
| 8550 Easton Commons Dr Houston, TX | 3.0 | 2.0 | 1325 | $1,945 | $1.47 | 45d | 1 | 1.20mi |
| 15131 West Rd Houston, TX | 3.0 | 2.0 | 1295 | $1,885 | $1.46 | 45d | 1 | 1.25mi |
| 15131 West Rd Houston, TX | 2.0 | 2.0 | 1095 | $1,440 | $1.32 | 26d | 1 | 1.25mi |
| 15131 West Rd Houston, TX | 3.0 | 2.0 | 1295 | $1,885 | $1.46 | 24d | 1 | 1.25mi |
HOA detail
- Monthly dues
- $35 · $420/yr
Listing history 10 events
-
2026-06-21days on market $220,000 Active 14 DOM
-
2026-06-18days on market $220,000 Active 11 DOM
-
2026-06-17days on market $220,000 Active 10 DOM
-
2026-06-16days on market $220,000 Active 9 DOM
-
2026-06-15days on market $220,000 Active 8 DOM
-
2026-06-13days on market $220,000 Active 6 DOM
-
2026-06-13days on market $220,000 Active 5 DOM
-
2026-06-09pricedays on market $220,000 Active 2 DOM
-
2026-06-08remarks 627-char remark
-
2026-06-08$215,000 Active 1 DOM
ⓘ Source: listings_history table (triggers on properties + properties_extension) + one-shot
backfill from property_details.listing_events for pre-trigger history.
Climate risk First Street
- Flood 1/10 Low FEMA zone X (unshaded) · 0% chance over 30 yrs
- Wildfire 1/10 Low
- Heat 9/10 Extreme 7 d/yr ≥110°F today · 22 d/yr by 30 yrs out
- Wind 8/10 Severe 99% chance of damaging wind over 30 yrs
- Air quality 3/10 Moderate 2 unhealthy d/yr today · 3 by 30 yrs out
Nearby sold comps map
Loading sold comps map…
Walkable amenities ~0.75 mi
Loading nearby amenities…
Taxation est. · year 1
- Rental income
- $21,866
- − Mortgage interest
- −$12,323
- − Property taxes
- −$3,300
- − Insurance
- −$1,100
- − Repairs & maintenance
- −$1,749
- − Management
- −$1,749
- − HOA
- −$420
- − Depreciation
- −$6,400
- Taxable loss
- −$5,176
- Est. tax savings @ 24.0%
- +$1,242
- After-tax cash flow
- $-148/yr
For passive investors: Depreciation is non-cash, so a rental often shows a tax loss while cash-flowing — sheltering income. Rental losses are passive: they offset passive income freely, and up to $25,000/yr can offset ordinary (W-2) income if you actively participate and your MAGI is under $100k (phasing out to $0 by $150k); unused losses carry forward. On sale, claimed depreciation is recaptured at up to 25%, and gains may owe capital-gains tax (a 1031 exchange can defer both). Figures are a year-1 estimate at your 24.0% rate — not tax advice; consult a CPA.
Condition & rehab AI · 6 photos
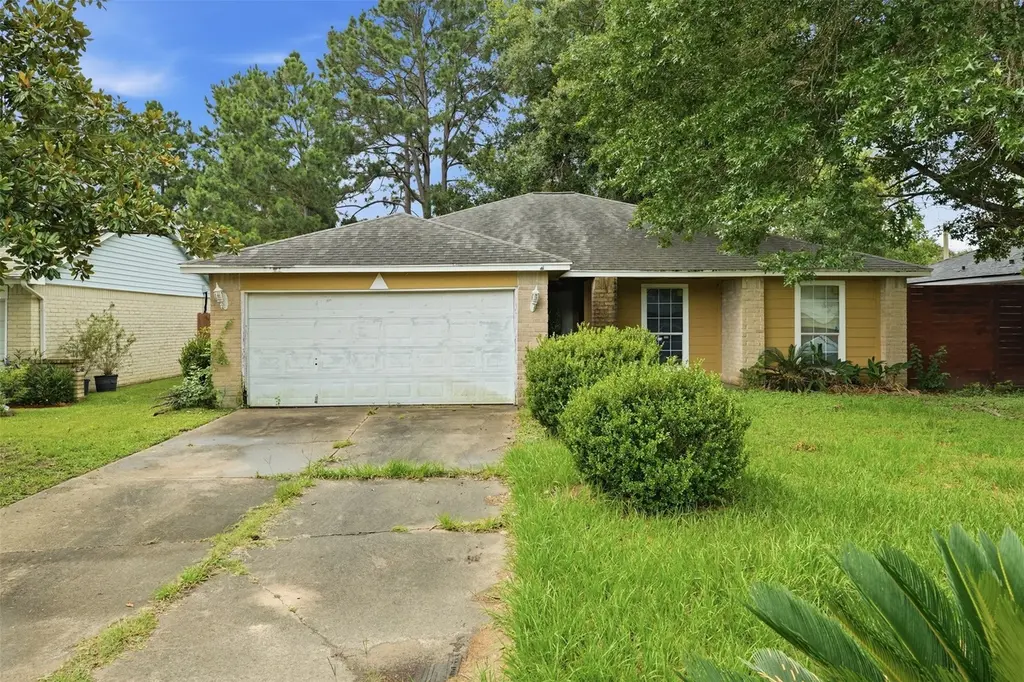
This single-family home requires significant repairs and maintenance, including a new roof, exterior and interior painting, and landscaping improvements. While it has potential, the current condition is not investor-ready and requires substantial work to increase its value.
Repairs flagged
- Major roof — The satellite image suggests potential roof damage.
- Major exterior siding — The siding is peeling and the paint is chipping.
- Major interior walls — The walls have visible damage and the paint is peeling.
- Major landscaping — The landscaping is overgrown and in need of maintenance.
- Major HVAC/mechanicals — The overall condition suggests they may need attention, though specific details are not visible.
Value-add opportunities
- Both Paint the exterior and interior walls — Fresh paint can improve the curb appeal and interior aesthetics, making the home more attractive to buyers and renters.
- Both Replace the roof — A new roof will protect the home from water damage and improve its overall appearance.
- Both Trim and maintain the landscaping — A well-maintained yard can enhance the home's curb appeal and add value to the property.
Renovation cost estimate screening
| Repair item | Severity | Est. cost |
|---|---|---|
| roof · The satellite image suggests potential roof damage. | Major | $15,000–50,000 |
| exterior siding · The siding is peeling and the paint is chipping. | Major | $15,000–50,000 |
| interior walls · The walls have visible damage and the paint is peeling. | Major | $15,000–50,000 |
| landscaping · The landscaping is overgrown and in need of maintenance. | Major | $15,000–50,000 |
| HVAC/mechanicals · The overall condition suggests they may need attention, though specific details are not visible. | Major | $15,000–50,000 |
| Total estimated repair cost · 5 items | $75,000–250,000 |
Value-add ROI direction
- Both Paint the exterior and interior walls — Fresh paint can improve the curb appeal and interior aesthetics, making the home more attractive to buyers and renters. ↑
- Both Replace the roof — A new roof will protect the home from water damage and improve its overall appearance. ↑
- Both Trim and maintain the landscaping — A well-maintained yard can enhance the home's curb appeal and add value to the property. ↑
ⓘ Cost ranges are severity-bucket heuristics (US national rule-of-thumb). Get contractor quotes + a written scope before underwriting a rehab budget.
Schools (NCES district)
- District
- Cypress-Fairbanks ISD
- NCES district ID
- 4816110
- Math proficiency
- 45% ▼ -12.00%
- Reading proficiency
- 52% ▼ -2.00%
- Median HH income
- $72,025
- Composite
- 43.63/100
- National rank
- #2968
- State rank
- #161 of 826 in TX
Livability — Houston
- Score
- 74/100
- State rank
- #184
- US rank
- #4771
Category grades
Schools grade is shown separately in the Schools card above.
Census & demographics
- County
- Harris County · 4,702,590 people
- City population
- 3,226,434
- Metro
- Houston-The Woodlands-Sugar Land, TX
- Population (ZIP)
- 33,349
- Household income
- $77,083
- Rent vs Own
- Severe rent burden
- 537.0
Population outlook (Harris County) Hauer SSP2
- Today (2025)
- 5,571,493 people
- By 2030
- 6,089,821 · +9.3%
- By 2040
- 7,142,806 · +28.2%
- By 2050
- 8,185,864 · +46.9%
- By 2075
- 10,574,329 · +89.8%
- By 2100
- 12,109,958 · +117.4%
Race, ethnicity, and origin ACS 2023
- Neighborhood character
- Diverse neighborhood (Simpson 0.67)
- Race & ethnicity
- Hispanic / Latino 50% Two or more races 25% White 23% Asian 16% Black 9% Native American 3%
- Hispanic origin (detail)
- Mexican 36% Cuban 2% Salvadoran 1%
- Common ancestry
- Italian 1% Portuguese 1% Romanian 1%
- Foreign-born
- 38% · Canada, Vietnam, China
- Languages at home
- 45% English-only · Spanish 39% Vietnamese 8% Other Indo-European 3%
Political lean MEDSL · Harris
- 2024 margin
- Lean D (+5.5) · D 52.0% · R 46.4% · Other 1.6%
- 2008→2024 swing
- +3.9pp toward D · 2008: 1.6pp · 2024: 5.5pp
- All cycles
- 2024: D+5.5 2020: D+13.3 2016: D+12.4 2012: D+0.1 2008: D+1.6
Not yet ingested
- Civics
- —
Market trends
- HPI YoY
- ▼ -1.47%
- Current HPI
- 241.5096
- Rent YoY
- ▲ 0.25%
- Metro
- Houston-The Woodlands-Sugar Land, TX
- State GDP YoY
- ▲ 3.95%
- F500 in state
- 110
Industry mix (Fortune 500 HQ in TX)
| Industry | F500 HQs | Revenue |
|---|---|---|
| Energy | 16 | $1,198B |
|
||
| Technology | 5 | $198B |
|
||
| Engineering / Construction | 4 | $72B |
|
||
| Energy Services | 3 | $60B |
|
||
| Utilities | 3 | $41B |
|
||
| Healthcare | 2 | $330B |
|
||
Price history
1 event — show timeline
- 2026-06-07 Listed $215,000 HARMLS
Cash-flow waterfall
monthlySold comps — $/sqft
last 12 mo · ≤1 miLoading sold comps…