403 Main St · Paris, AR
Flood risk 1/10 · Minimal
- FEMA flood zone
- X (unshaded)
- Chance of flooding over 30 yrs
- 0.0%
- Est. flood insurance / yr
- $507 – $1,088
Fire risk 5/10 · Moderate
- Est. fire insurance / yr
- $1,499 – $2,785
Heat risk 7/10 · Major
- Hot days now (above 113°F)
- 7 days/yr
- Hot days in 30 yrs
- 21 days/yr
Wind risk 2/10 · Minimal
- Chance of severe wind over 30 yrs
- 1.0%
Air-quality risk 1/10 · Minimal
- Unhealthy air days now
- 0 days/yr
- Unhealthy air days in 30 yrs
- 0 days/yr
Risk factors via First Street. Map © Google.
Why this score? — see what drove the D- grade
The composite is a weighted blend of 9 inputs, each scored 0–100. Each bar is that input's sub-score; the figure is the points it added to the 100-point composite (weight × sub-score).
- Cash flow +11.3/30.0
- ARV discount +8.1/15.0
- Livability +3.5/5.0
- DSCR +3.3/10.0
- Schools +3.2/10.0
- Rent growth +2.5/5.0
- Condition / age +2.5/5.0
- 1% rule +2.4/10.0
- Appreciation +0.0/10.0
$155,000
🖨 Deal sheet 📄 Offer letter ✓ Due diligence
Listing remarks
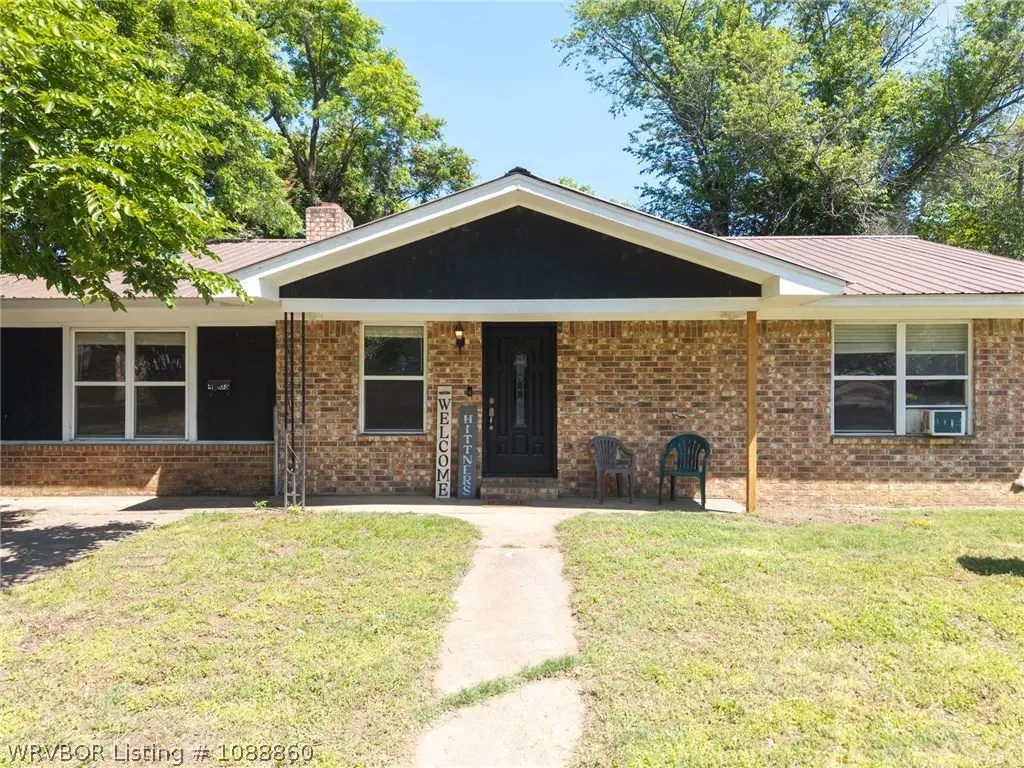
Beautiful brick home on corner lot in Paris, AR. Convenient location close to town, shopping, amenities. Walking distance from the city park and the city pool. You can also walk to the square to attend the Butterfly and Frontier Day Festivals. Here you can enjoy watching the parades and court house lighting for the holidays with just a short stroll to the center of town. No need to try and find parking for all the Hallmark Paris events. Recent renovations include new doors, new trim, new windows, stained concrete floors, new butcher block countertops, new cabinets, new vents, new tile in bathrooms, new toilets, whirlpool tub and new light fixtures. Water heater is 3 years old, the roof is a
Key facts
- New doors
- Recent renovations
- New trim
Tags
Property features AI
Exterior
- Parking: Attached carport; 2 covered parking spaces; Concrete parking surface
- Security: Smoke detector(s)
- Utilities: Cable available; Electricity available; Natural gas available
- Home design: Single family house; One story; Slab foundation; Facing unknown
- Construction: Brick construction; Metal roof; Built on slab foundation
- Exterior features: Partial fencing; Corner lot; Level lot; Public maintained road
Interior
- Kitchen: Dishwasher; Microwave; Oven
- Flooring: Concrete; Ceramic tile
- Bathrooms: 2 full bathrooms
- Heating & cooling: Natural gas heating; Central air; Ceiling fan(s)
- Interior features: Ceiling fan(s); Eat-in kitchen; Family room fireplace
- Laundry & utility: Electric dryer hookup; Electric water heater
Neighborhood map
What this means for you Summary
Snapshot
- This is a 3-bed/2.0-bath single-family listed at $155k.
Deal economics
- At list price, monthly cash flow is $-57 ($-683/yr) — negative.
- To cash-flow at today's rent, offer at most $145k (6.5% below list).
- To meet the 1% rule (rent ≥ 1% of price), the offer needs to be $115k (26.1% below list).
- Recommended offer: $115k (26.1% below list) — sets the bar for 1% rule.
Location & tenants
- Location reads 69/100 on livability (#68 in AR) — a middle-class / working-renter tenant base. Strengths: cost of living A+, housing A+, health & safety A+; Watch: crime F, amenities F, commute F.
- Paris School District (town): math 41% / reading 37% proficiency, ranked #83 of 238 in AR (top 35%) — families likely to look elsewhere, expect single-tenant / working-renter base with shorter leases.
- Zoned schools: Paris Elementary School (math 57% / reading 27%, grade F, #173 of 454 statewide, top 43%, 431 students, 100% FRL); Paris Middle School (math 39% / reading 43%, grade F, #83 of 201 statewide, top 44%, 317 students, 100% FRL); Paris High School (math 32% / reading 37%, grade F, #92 of 292 statewide, top 37%, 335 students, 100% FRL) — zoned schools average 100% FRL vs 54% district-wide (46 pts higher); higher-poverty schools than district average — tighter screening recommended.
- Market conditions: 78 active listings in the ZIP; 11 units permitted in Logan County in 2024 (0 in 5+ unit buildings).
Forward outlook
- Local home prices are declining (-3.0%/yr); year-one equity from $1k of loan paydown is wiped out by about $5k of value loss. Plan a longer hold.
- Logan County population projected at -13% by 2050 — secular population decline; favor cash flow + early exit over multi-decade hold.
Negotiation context
- It's been on market 45 days — a 3% lower offer ($150k) is reasonable based on typical stale-listing flexibility.
Risks & watch-outs
- Climate carrying-cost: moderate wildfire risk; extreme-heat days projected 7→21/yr by 2055 (HVAC capex compounding) — expect insurance premiums to compound above CPI over the hold.
Questions for the listing agent
- What do current leases actually rent for vs. the listed asking? Can we see a recent rent roll and the last 12 months of T-12 income?
- It's been on market 45 days. Have you received any prior offers? Is the seller open to a 26% concession, seller financing, or rate buy-down credit?
- Is there a deadline driving the sale (1031 exchange, divorce, estate, relocation)? That informs how much negotiation room exists.
- Schools are D-rated, which usually means shorter tenancies and higher turnover. Who's the typical renter profile here, and what's been the actual vacancy rate?
- Crime grade is F in this area — have there been break-ins, vandalism, or insurance claims at this property in the last 3 years? What carrier currently insures it and at what premium?
- The area grade is low — what's the realistic commute time and amenity access for the typical tenant pool here? Any planned neighborhood developments (good or bad) we should know about?
- What's the average days-on-market for RENTAL listings here right now (not sales)? A rising rental-DOM trend means longer vacancies and softer asking-rent achievability than the comps imply.
- What's the recent tenant-quality profile in this submarket — average credit score on applications, eviction rate, late-payment / NSF rate, and stable-employment percentage? A property-management company in the area should have these aggregated.
- How much new for-sale + rental construction is in the pipeline within 1–3 miles? Heavy new supply typically softens prices + rents 12–24 months out; constrained supply supports both.
Investment metrics
- 1% rule
- 0.74% ✗
- Cap rate
- 5.85%
- Cash-on-cash
- -1.57%
- DSCR
- 0.93
- GRM
- 11.3
CMA / ARV
- ARV (median comp)
- $157,076
- List price
- $155,000
- Delta
- -1.32%
- Verdict
- FAIR
- Comps
- 20 within 1.0 mi
Show comp detail 12 sales within ~0.75 mi
| Address | Dist | Beds/Ba | Sqft | Sold | Price | $/sf | Match |
|---|---|---|---|---|---|---|---|
| 702 5th St | 0.29mi | 3/1.0 | 1,440 (+2%) | 1mo | $57,000 | $40 | 78 |
| 801 Main St | 0.21mi | 3/1.0 | 1,392 (-1%) | 12mo | $144,000 | $103 | 75 |
| 1104 Fuller St | 0.43mi | 3/2.0 | 1,372 (-3%) | 11mo | $140,000 | $102 | 66 |
| 118 Hall St | 0.68mi | 3/2.0 | 1,432 (+2%) | 2mo | $163,500 | $114 | 64 |
| 1112 Elm St | 0.63mi | 3/2.0 | 1,413 (+0%) | 12mo | $136,000 | $96 | 60 |
| 1104 N 4th St | 0.61mi | 3/1.5 | 1,479 (+5%) | 4mo | $62,000 | $42 | 58 |
| 1312 N 5th St | 0.64mi | 2/2.0 (-1) | 1,464 (+4%) | 6mo | $175,000 | $120 | 54 |
| 406 E Rosedale St | 0.49mi | 4/3.0 (+1) | 1,468 (+4%) | 13mo | $50,000 | $34 | 50 |
| 1107 N 4th St | 0.64mi | 3/2.0 | 1,542 (+9%) | 6mo | $163,500 | $106 | 50 |
| 1112 E Wood St | 0.50mi | 3/2.0 | 1,209 (-14%) | 9mo | $152,700 | $126 | 45 |
| 817 E Chism St | 0.29mi | 2/1.0 (-1) | 1,232 (-13%) | 15mo | $57,400 | $47 | 44 |
| 1304 S Elm St | 0.75mi | 3/2.0 | 1,579 (+12%) | 9mo | $209,000 | $132 | 38 |
Match score weights: distance 35% · size 25% · config 20% · recency 20%. Top-matched comps best support the ARV.
Projected returns pro-forma
-3.0% appreciation · 3.0% rent growth · sell at horizon
- IRR
- -18.9%
- Equity multiple
- 0.34×
- Total profit
- $-28,792
- Equity at exit
- $23,111
- IRR
- -11.6%
- Equity multiple
- 0.31×
- Total profit
- $-29,942
- Equity at exit
- $13,402
Cash invested: $43,400 (down + closing). Projections, not guarantees.
Landlord ↔ Tenant lean methodology
- Overall (STATE)
- 92 Strongly Landlord-Friendly
- State Arkansas
- 92 Strongly Landlord-Friendly · R+14
- County
- — inherits STATE
- City
- — inherits STATE
ZIP-level market 72855
- Home prices YoY
- -8.3%
- Active inventory
- 78
- Price-to-rent
- 11.3×
Monthly cashflow live
- Estimated rent
- $1,146 medium interval (Pro) →
- Mortgage (P&I)
- −$813
- Tax from tax record
- −$85 /mo · $1,017/yr
- Insurance
- −$65
- HOA
- −$0
- Vacancy / Maint / Mgmt
- −$241
- Net cashflow
- $-57
Break-even live
UW: 25.0% down · 7.5% · 30yr · 1.5% tax · 5.0% vac · 8.0% maint · 8.0% mgmt
Financing live
Cash to close
- Down payment
- $38,750
- Closing costs
- $4,650
- Reserves months
- —
- Total cash needed
- —
Loan-product check · same deal, 3 products live
Conventional
25% down · 7.5% · 30yr
- Down + closing
- —
- Monthly P&I
- —
- Monthly cashflow
- —
- DSCR
- —
- Eligible?
- —
Personal DTI + credit; lowest rate.
DSCR
20% down · 8.5% · 30yr
- Down + closing
- —
- Monthly P&I
- —
- Monthly cashflow
- —
- DSCR
- —
- Eligible?
- —
No personal income docs; deal must DSCR.
Hard money
10% down · 12.0% · 12mo
- Down + closing
- —
- Monthly P&I
- —
- Monthly cashflow
- —
- DSCR
- —
- Eligible?
- —
Short-term bridge; refi at stabilization.
Listing history 17 events
-
2026-06-19days on market $155,000 Active 45 DOM
-
2026-06-18days on market $155,000 Active 44 DOM
-
2026-06-17days on market $155,000 Active 43 DOM
-
2026-06-16days on market $155,000 Active 42 DOM
-
2026-06-15days on market $155,000 Active 41 DOM
-
2026-06-14days on market $155,000 Active 39 DOM
-
2026-06-12pricedays on market $155,000 Active 38 DOM
-
2026-06-09days on market $156,000 Active 35 DOM
-
2026-06-08days on market $156,000 Active 34 DOM
-
2026-06-07days on market $156,000 Active 33 DOM
-
2026-06-07days on market $156,000 Active 32 DOM
-
2026-06-04days on market $156,000 Active 29 DOM
-
2026-06-02days on market $156,000 Active 28 DOM
-
2026-06-01days on market $156,000 Active 27 DOM
-
2026-05-31days on market $156,000 Active 26 DOM
-
2026-05-31days on market $156,000 Active 25 DOM
-
2026-05-05$159,000 Active 1227-char remark
ⓘ Source: listings_history table (triggers on properties + properties_extension) + one-shot
backfill from property_details.listing_events for pre-trigger history.
Tax reassessment forecast AR · Resets to sale price
- Current annual tax
- $1,017 · $85/mo
- Projected year-2 tax
- $1,017 · $85/mo
- Expected delta
- $0/yr ($0/mo · 0.0%)
ⓘ Screening estimate from a state-policy table — verify with the county assessor before closing.
Climate risk First Street
- Flood 1/10 Low FEMA zone X (unshaded) · 0% chance over 30 yrs
- Wildfire 5/10 Major
- Heat 7/10 Severe 7 d/yr ≥113°F today · 21 d/yr by 30 yrs out
- Wind 2/10 Low 100% chance of damaging wind over 30 yrs
- Air quality 1/10 Low 0 unhealthy d/yr today · 0 by 30 yrs out
Nearby sold comps map
Loading sold comps map…
Walkable amenities ~0.75 mi
Loading nearby amenities…
Taxation est. · year 1
- Rental income
- $13,751
- − Mortgage interest
- −$8,682
- − Property taxes
- −$1,017
- − Insurance
- −$775
- − Repairs & maintenance
- −$1,100
- − Management
- −$1,100
- − Depreciation
- −$4,509
- Taxable loss
- −$3,433
- Est. tax savings @ 24.0%
- +$824
- After-tax cash flow
- $141/yr
For passive investors: Depreciation is non-cash, so a rental often shows a tax loss while cash-flowing — sheltering income. Rental losses are passive: they offset passive income freely, and up to $25,000/yr can offset ordinary (W-2) income if you actively participate and your MAGI is under $100k (phasing out to $0 by $150k); unused losses carry forward. On sale, claimed depreciation is recaptured at up to 25%, and gains may owe capital-gains tax (a 1031 exchange can defer both). Figures are a year-1 estimate at your 24.0% rate — not tax advice; consult a CPA.
Schools (NCES district)
- District
- Paris School District
- NCES district ID
- 0511130
- Math proficiency
- 41% ▼ -9.00%
- Reading proficiency
- 37% ▼ -6.00%
- Median HH income
- $34,950
- Composite
- 32.25/100
- National rank
- #5763
- State rank
- #83 of 238 in AR
Livability — Paris
- Score
- 69/100
- State rank
- #68
- US rank
- #8544
Category grades
Schools grade is shown separately in the Schools card above.
Census & demographics
- Census place
- Paris, AR
- Population (ZIP)
- 6,462
Population outlook (Logan County) Hauer SSP2
- Today (2025)
- 21,046 people
- By 2030
- 20,537 · -2.4%
- By 2040
- 19,443 · -7.6%
- By 2050
- 18,220 · -13.4%
- By 2075
- 16,164 · -23.2%
- By 2100
- 14,858 · -29.4%
Race, ethnicity, and origin ACS 2023
- Neighborhood character
- Predominantly White (87%)
- Race & ethnicity
- White 87% Two or more races 8% Asian 3% Hispanic / Latino 2%
- Common ancestry
- Italian 1% Serbian 1% Lithuanian 1%
- Foreign-born
- 2% · China, Vietnam
- Languages at home
- 95% English-only · Spanish 3% Other Asian/Pacific 1% Chinese 1%
Political lean MEDSL · Logan
- 2024 margin
- Solid R (+62.2) · D 17.8% · R 80.0% · Other 2.1%
- 2008→2024 swing
- -23.5pp toward R · 2008: -38.8pp · 2024: -62.2pp
- All cycles
- 2024: R+62.2 2020: R+59.5 2016: R+51.4 2012: R+41.9 2008: R+38.8
Not yet ingested
- Civics
- —
Market trends
- HPI YoY
- ▼ -15.40%
- Current HPI
- 170.513
- Rent YoY
- —
- Metro
- —
- State GDP YoY
- ▲ 3.80%
- F500 in state
- 10
Industry mix (Fortune 500 HQ in AR)
| Industry | F500 HQs | Revenue |
|---|---|---|
| Retail | 1 | $681B |
|
||
| Food / Agriculture | 1 | $53B |
|
||
| Retail / Energy | 1 | $22B |
|
||
| Transportation / Logistics | 1 | $12B |
|
||
| Energy | 1 | $4B |
|
||
Price history
-2.5% since first listed5 events — show timeline
- 2026-06-11 Price Changed $155,000 WRVBOR
- 2026-05-28 Price Changed $156,000 WRVBOR
- 2026-05-19 Price Changed $157,000 WRVBOR
- 2026-05-19 Price Changed $15,700 WRVBOR
- 2026-05-05 Listed $159,000 WRVBOR
Property tax history
+13.5%/yrLatest (2025): $1,017 · +10.0% YoY. Source: county tax records.
Cash-flow waterfall
monthlySold comps — $/sqft
last 12 mo · ≤1 miLoading sold comps…