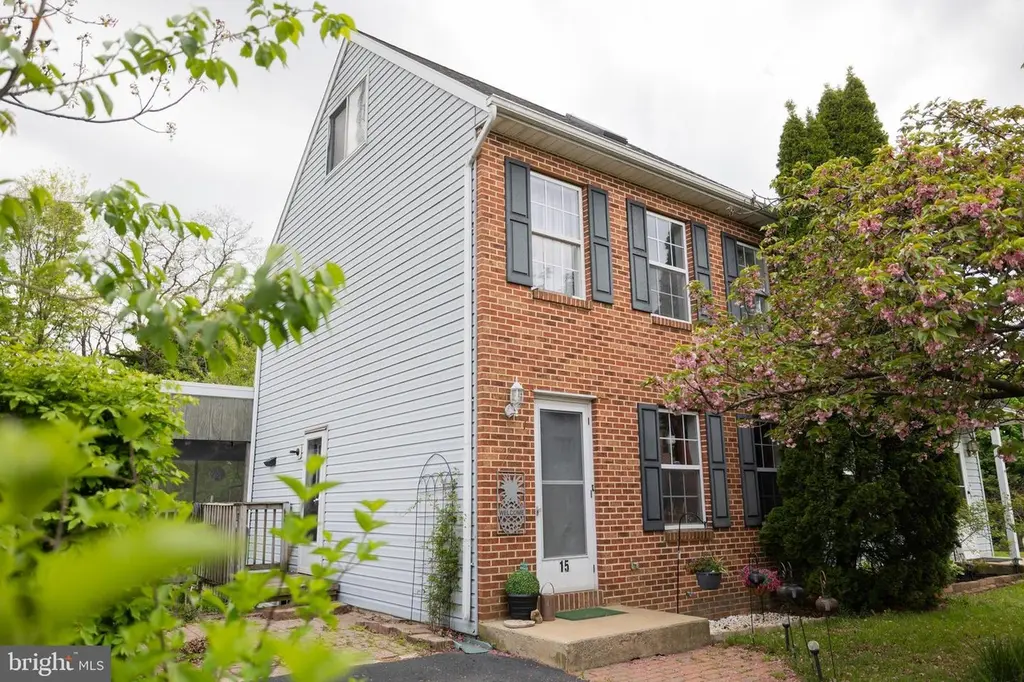
15 School House Ln · Warwick, PA
Flood risk 1/10 · Minimal
- FEMA flood zone
- X (unshaded)
- Chance of flooding over 30 yrs
- 0.0%
- Est. flood insurance / yr
- $473 – $860
Fire risk 2/10 · Minimal
- Est. fire insurance / yr
- $511 – $949
Heat risk 5/10 · Moderate
- Hot days now (above 102°F)
- 7 days/yr
- Hot days in 30 yrs
- 15 days/yr
Wind risk 4/10 · Minor
- Chance of severe wind over 30 yrs
- 18.0%
Air-quality risk 4/10 · Minor
- Unhealthy air days now
- 4 days/yr
- Unhealthy air days in 30 yrs
- 6 days/yr
Risk factors via First Street. Map © Google.
Why this score? — see what drove the D grade
The composite is a weighted blend of 9 inputs, each scored 0–100. Each bar is that input's sub-score; the figure is the points it added to the 100-point composite (weight × sub-score).
- ARV discount +14.6/15.0
- Cash flow +10.4/30.0
- Schools +4.4/10.0
- DSCR +3.0/10.0
- 1% rule +2.7/10.0
- Rent growth +2.5/5.0
- Livability +2.5/5.0
- Condition / age +2.5/5.0
- Appreciation +0.0/10.0
$285,900
🖨 Deal sheet (PDF) 📄 Offer letter ✓ Due diligence
Listing remarks MLS
One owner, well-cared-for home, large lot, nice landscaping, daylight basement, quiet cul-de-sac. Home Warranty included. Water softener and wall-mounted air conditioner included in sale.
Key facts
- 3 parking spots
- Built 1993
- Listed 5 days
Property features AI
Exterior
- Parking: Asphalt driveway with three driveway spaces; Off-street parking (total of 3 garage/parking spaces)
- Utilities: Public water; Public sewer; Electric service available
- Home design: Semi-detached home; Estimated year built; major remodel/renovation in 2025; Building winterized
- Construction: Vinyl siding; Brick/mortar foundation; Asphalt roof
- Exterior features: Not in a federal flood zone; Above-grade and below-grade structures
Interior
- Kitchen: Stove
- Bedrooms: Three bedrooms on the main level
- Bathrooms: One full bathroom
- Heating & cooling: Central heating (natural gas); Central air conditioning; Electric hot water
- Interior features: Fully finished basement; Has one wood-burning fireplace
- Laundry & utility: Washer and dryer in the basement
Neighborhood map
What this means for you Summary
Snapshot
- This is a 3-bed/1.0-bath townhouse listed at $286k.
Deal economics
- At list price, monthly cash flow is $-149 ($-2k/yr) — negative.
- To cash-flow at today's rent, offer at most $260k (9.2% below list).
- To meet the 1% rule (rent ≥ 1% of price), the offer needs to be $220k (22.9% below list).
- Recommended offer: $220k (22.9% below list) — sets the bar for 1% rule.
Location & tenants
- Location reads: area grade D — affects rentability + tenant quality, not the cash-flow math above.
- Warwick SD (suburban): math 42% / reading 58% proficiency, ranked #158 of 539 in PA (top 29%) — acceptable for families but not a draw, mixed tenant base, ~2y average lease; only 20% free/reduced lunch — higher-income household profile.
- Zoned schools: John R Bonfield El Sch (math 35% / reading 55%, grade D-, #809 of 1,518 statewide, top 54%, 476 students, 45% FRL); Warwick Ms (math 23% / reading 57%, grade F, #257 of 512 statewide, top 52%, 578 students, 35% FRL); Warwick Shs (math 86% / reading 50%, grade B, #59 of 437 statewide, top 14%, 1,230 students, 28% FRL) — zoned schools average 36% FRL vs 20% district-wide (16 pts higher); higher-poverty schools than district average — tighter screening recommended.
- Market conditions: 218 active listings in the ZIP; solid renter incomes; 1,093 units permitted in Lancaster County in 2024 (201 in 5+ unit buildings).
Forward outlook
- Local home prices are declining (-3.0%/yr); year-one equity from $2k of loan paydown is wiped out by about $9k of value loss. Plan a longer hold.
- Lancaster County population projected at +5% by 2050 — modest demand growth; plan on rents tracking national, not racing it.
Negotiation context
- Only 5 days on market — expect competitive offers; lowballing is unlikely to land.
- 2 sale attempts since 18y ago with the ask held roughly flat each time — persistent listings suggest the price (not the market) is what's stuck; bring a comps-based counter.
- Current owner paid $150k; list at $286k implies a 91% gain — meaningful room to come down on a strong offer.
Risks & watch-outs
- Climate carrying-cost: extreme-heat days projected 7→15/yr by 2055 (HVAC capex compounding) — expect insurance premiums to compound above CPI over the hold.
Questions for the listing agent
- What do current leases actually rent for vs. the listed asking? Can we see a recent rent roll and the last 12 months of T-12 income?
- Is there a deadline driving the sale (1031 exchange, divorce, estate, relocation)? That informs how much negotiation room exists.
- The area grade is low — what's the realistic commute time and amenity access for the typical tenant pool here? Any planned neighborhood developments (good or bad) we should know about?
- What's the average days-on-market for RENTAL listings here right now (not sales)? A rising rental-DOM trend means longer vacancies and softer asking-rent achievability than the comps imply.
- What's the recent tenant-quality profile in this submarket — average credit score on applications, eviction rate, late-payment / NSF rate, and stable-employment percentage? A property-management company in the area should have these aggregated.
- How much new for-sale + rental construction is in the pipeline within 1–3 miles? Heavy new supply typically softens prices + rents 12–24 months out; constrained supply supports both.
Investment metrics
- 1% rule
- 0.77% ✗
- Cap rate
- 5.67%
- Cash-on-cash
- -2.24%
- DSCR
- 0.90
- GRM
- 10.8
CMA / ARV
- ARV (median comp)
- $339,524
- List price
- $285,900
- Delta
- -15.79%
- Verdict
- UNDERPRICED
- Comps
- 15 within 1.0 mi
Show comp detail 3 sales within ~0.75 mi
| Address | Dist | Beds/Ba | Sqft | Sold | Price | $/sf | Match |
|---|---|---|---|---|---|---|---|
| 12 Edgewood Dr | 0.15mi | 3/1.0 | 1,356 (+0%) | 21mo | $345,000 | $254 | 74 |
| 23 Wade Dr | 0.25mi | 3/1.5 | 1,406 (+4%) | 6mo | $305,000 | $217 | 74 |
| 15 Sunrise Dr | 0.70mi | 3/1.5 | 1,232 (-9%) | 9mo | $325,000 | $264 | 43 |
Match score weights: distance 35% · size 25% · config 20% · recency 20%. Top-matched comps best support the ARV.
Projected returns pro-forma
-3.0% appreciation · 3.0% rent growth · sell at horizon
- IRR
- -20.0%
- Equity multiple
- 0.30×
- Total profit
- $-55,851
- Equity at exit
- $42,629
- IRR
- -13.0%
- Equity multiple
- 0.24×
- Total profit
- $-60,948
- Equity at exit
- $24,719
Cash invested: $80,052 (down + closing). Projections, not guarantees.
Landlord ↔ Tenant lean methodology
- Overall (STATE)
- 62 Landlord-Friendly
- State Pennsylvania
- 62 Landlord-Friendly · EVEN
- County
- — inherits STATE
- City
- — inherits STATE
ZIP-level market 17543
- Active inventory
- 218
- Price-to-rent
- 10.8×
Monthly cashflow live
- Estimated rent
- $2,205 medium interval (Pro) →
- Mortgage (P&I)
- −$1,499
- Tax from tax record
- −$272 /mo · $3,269/yr
- Insurance
- −$119
- HOA
- −$0
- Vacancy / Maint / Mgmt
- −$463
- Net cashflow
- $-149
Break-even live
Sensitivity live
| Price | -10% $13 | -5% $-68 | +0% $-149 | +5% $-230 | +10% $-311 |
|---|---|---|---|---|---|
| Rent | -10% $-323 | -5% $-236 | +0% $-149 | +5% $-62 | +10% $25 |
| Rate | -1.0pp $-5 | -0.5pp $-76 | base $-149 | +0.5pp $-223 | +1.0pp $-299 |
UW: 25.0% down · 7.5% · 30yr · 1.5% tax · 5.0% vac · 8.0% maint · 8.0% mgmt
Financing live
Cash to close
- Down payment
- $71,475
- Closing costs
- $8,577
- Reserves months
- —
- Total cash needed
- —
Loan-product check · same deal, 3 products live
Conventional
25% down · 7.5% · 30yr
- Down + closing
- —
- Monthly P&I
- —
- Monthly cashflow
- —
- DSCR
- —
- Eligible?
- —
Personal DTI + credit; lowest rate.
DSCR
20% down · 8.5% · 30yr
- Down + closing
- —
- Monthly P&I
- —
- Monthly cashflow
- —
- DSCR
- —
- Eligible?
- —
No personal income docs; deal must DSCR.
Hard money
10% down · 12.0% · 12mo
- Down + closing
- —
- Monthly P&I
- —
- Monthly cashflow
- —
- DSCR
- —
- Eligible?
- —
Short-term bridge; refi at stabilization.
Listing history 10 events
-
2026-05-14status Pending 1348-char remark
-
2026-05-08$285,900 Active 1348-char remark
-
2026-05-07price $285,900 1348-char remark
-
2026-05-07price $284,900 1348-char remark
-
2026-05-07historical $285,900 1348-char remark
-
2009-04-28soldstatus $150,000
-
2009-04-24soldstatus $150,000 187-char remark
Show marketing remark (187 chars)
One owner, well-cared-for home, large lot, nice landscaping, daylight basement, quiet cul-de-sac. Home Warranty included. Water softener and wall-mounted air conditioner included in sale.
-
2009-02-25historical 187-char remark
Show marketing remark (187 chars)
One owner, well-cared-for home, large lot, nice landscaping, daylight basement, quiet cul-de-sac. Home Warranty included. Water softener and wall-mounted air conditioner included in sale.
-
2008-11-01$154,900 187-char remark
Show marketing remark (187 chars)
One owner, well-cared-for home, large lot, nice landscaping, daylight basement, quiet cul-de-sac. Home Warranty included. Water softener and wall-mounted air conditioner included in sale.
-
1993-06-01soldstatus $83,300
ⓘ Source: listings_history table (triggers on properties + properties_extension) + one-shot
backfill from property_details.listing_events for pre-trigger history.
Tax reassessment forecast PA · Partial reset (capped growth)
- Current annual tax
- $3,269 · $272/mo
- Projected year-2 tax
- $3,893 · $324/mo
- Expected delta
- +$624/yr (+$52/mo · 19.1%)
ⓘ Screening estimate from a state-policy table — verify with the county assessor before closing.
Climate risk First Street
- Flood 1/10 Low FEMA zone X (unshaded) · 0% chance over 30 yrs
- Wildfire 2/10 Low
- Heat 5/10 Major 7 d/yr ≥102°F today · 15 d/yr by 30 yrs out
- Wind 4/10 Moderate 18% chance of damaging wind over 30 yrs
- Air quality 4/10 Moderate 4 unhealthy d/yr today · 6 by 30 yrs out
Nearby sold comps map
Loading sold comps map…
Walkable amenities ~0.75 mi
Loading nearby amenities…
Taxation est. · year 1
- Rental income
- $26,455
- − Mortgage interest
- −$16,015
- − Property taxes
- −$3,269
- − Insurance
- −$1,430
- − Repairs & maintenance
- −$2,116
- − Management
- −$2,116
- − Depreciation
- −$8,317
- Taxable loss
- −$6,808
- Est. tax savings @ 24.0%
- +$1,634
- After-tax cash flow
- $-157/yr
For passive investors: Depreciation is non-cash, so a rental often shows a tax loss while cash-flowing — sheltering income. Rental losses are passive: they offset passive income freely, and up to $25,000/yr can offset ordinary (W-2) income if you actively participate and your MAGI is under $100k (phasing out to $0 by $150k); unused losses carry forward. On sale, claimed depreciation is recaptured at up to 25%, and gains may owe capital-gains tax (a 1031 exchange can defer both). Figures are a year-1 estimate at your 24.0% rate — not tax advice; consult a CPA.
Schools (NCES district)
- District
- Warwick SD
- NCES district ID
- 4224960
- Math proficiency
- 42% ▼ -6.00%
- Reading proficiency
- 58% ▼ -11.00%
- Median HH income
- $63,696
- Composite
- 44.03/100
- National rank
- #2884
- State rank
- #158 of 539 in PA
Livability — Warwick
No livability data for this city. (Only ~50 U.S. cities are tracked.)
Census & demographics
- Census place
- Rothsville, PA
- County
- Lancaster County · 390,309 people
- Metro
- Lancaster, PA
- Population (ZIP)
- 45,912
- Household income
- $97,435
- Rent vs Own
- Severe rent burden
- 1164.0
Population outlook (Lancaster County) Hauer SSP2
- Today (2025)
- 561,011 people
- By 2030
- 570,969 · +1.8%
- By 2040
- 585,929 · +4.4%
- By 2050
- 591,056 · +5.4%
- By 2075
- 594,747 · +6.0%
- By 2100
- 558,850 · -0.4%
Race, ethnicity, and origin ACS 2023
- Neighborhood character
- Predominantly White (86%)
- Race & ethnicity
- White 86% Hispanic / Latino 6% Two or more races 5% Asian 3% Black 2%
- Hispanic origin (detail)
- Mexican 1% Puerto Rican 3%
- Common ancestry
- Romanian 3% Lithuanian 2% Italian 2%
- Foreign-born
- 4% · Canada, India, Vietnam
- Languages at home
- 92% English-only · Spanish 3% German/W. Germanic 2% Other Indo-European 1%
Political lean MEDSL · Lancaster
- 2024 margin
- R (+15.9) · D 41.5% · R 57.5%
- 2008→2024 swing
- -4.1pp toward R · 2008: -11.8pp · 2024: -15.9pp
- All cycles
- 2024: R+15.9 2020: R+15.8 2016: R+19.7 2012: R+19.2 2008: R+11.8
Not yet ingested
- Civics
- —
Market trends
- HPI YoY
- ▼ -283.22%
- Current HPI
- 265.3653
- Rent YoY
- —
- Metro
- Lancaster, PA
- State GDP YoY
- ▲ 1.68%
- F500 in state
- 34
Industry mix (Fortune 500 HQ in PA)
| Industry | F500 HQs | Revenue |
|---|---|---|
| Healthcare | 2 | $309B |
|
||
| Insurance | 2 | $27B |
|
||
| Telecommunications / Media | 1 | $124B |
|
||
| Industrial Distribution | 1 | $22B |
|
||
| Financial Services | 1 | $20B |
|
||
| Chemicals / Materials | 1 | $18B |
|
||
Price history
+243.2% since first listed10 events — show timeline
- 2026-05-14 Pending — BRIGHT MLS
- 2026-05-08 Listed $285,900 BRIGHT MLS
- 2026-05-07 Price Changed $285,900 BRIGHT MLS
- 2026-05-07 Price Changed $284,900 BRIGHT MLS
- 2026-05-07 Coming Soon $285,900 BRIGHT MLS
- 2009-04-28 Sold (Public Records) $150,000 Public Records
- 2009-04-24 Sold (MLS) $150,000 BRIGHT MLS
- 2009-02-25 Listing Removed — BRIGHT MLS
- 2008-11-01 Listed $154,900 BRIGHT MLS
- 1993-06-01 Sold (Public Records) $83,300 Public Records
Property tax history
+1.6%/yrLatest (2026): $3,269 · +2.1% YoY. Source: county tax records.
Cash-flow waterfall
monthlySold comps — $/sqft
last 12 mo · ≤1 miLoading sold comps…