10386 Elk Creek Pkwy · Independence, VA
Flood risk 8/10 · Major
- FEMA flood zone
- X (unshaded)
- Chance of flooding over 30 yrs
- 0.99%
- Est. flood insurance / yr
- $507 – $1,088
Fire risk 5/10 · Moderate
- Est. fire insurance / yr
- $666 – $1,236
Heat risk 2/10 · Minimal
- Hot days now (above 90°F)
- 7 days/yr
- Hot days in 30 yrs
- 20 days/yr
Wind risk 2/10 · Minimal
- Chance of severe wind over 30 yrs
- 0.0%
Air-quality risk 1/10 · Minimal
- Unhealthy air days now
- 0 days/yr
- Unhealthy air days in 30 yrs
- 0 days/yr
Risk factors via First Street. Map © Google.
Why this score? — see what drove the B+ grade
The composite is a weighted blend of 9 inputs, each scored 0–100. Each bar is that input's sub-score; the figure is the points it added to the 100-point composite (weight × sub-score).
- Cash flow +30.0/30.0
- 1% rule +10.0/10.0
- DSCR +10.0/10.0
- ARV discount +7.5/15.0
- Appreciation +6.5/10.0
- Schools +5.9/10.0
- Livability +3.3/5.0
- Rent growth +2.5/5.0
- Condition / age +2.5/5.0
$44,900
🖨 Deal sheet 📄 Offer letter ✓ Due diligence
Listing remarks
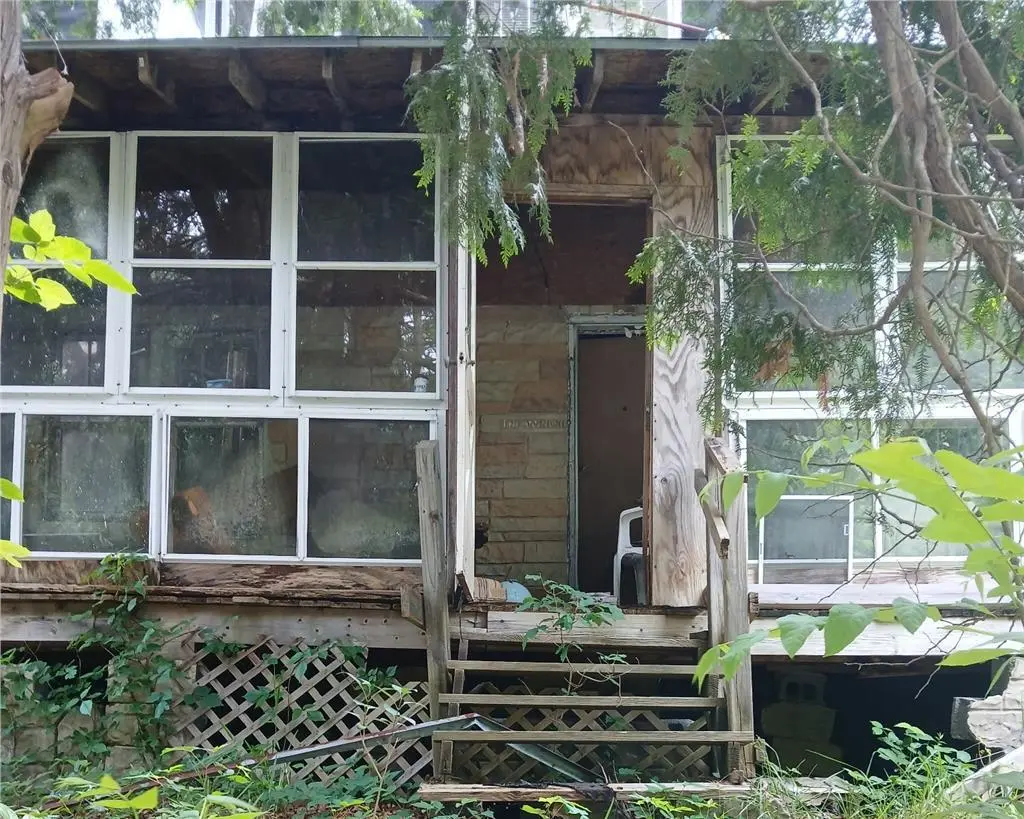
Exceptional Opportunity on a Generous . 33 Acre Lot! This 2 Level Home Offers Tremendous Potential for Investors, Builders, or Buyers Looking for their Next Project. Whether You Choose a Full Renovation or a Complete Teardown, the Property Provides a Fantastic Canvas to Create Something Special. Situated on a Spacious Lot with Room to Expand, Rebuild, or Reimagine, The Possibilities are Endless. Conveniently Located and Priced to Reflect its Condition, this is a Rare Chance to Unlock the Value and Potential of a Desirable Homesite. Property is Being Sold As-Is.
Key facts
- Generous acre lot
- Spacious lot
- Desirable homesite
Tags
Property features AI
Finance
- Other: Lot approximately 0.33 acres (100 x 145); Zoning: RES
Exterior
- Utilities: Private well water; Septic tank
- Home design: Two stories; Residential single-family home
- Construction: Wood siding construction
- Exterior features: Shingle roof
Interior
- Flooring: Other
- Bathrooms: 1 full bathroom
- Interior features: Other flooring
Neighborhood map
What this means for you Summary
Snapshot
- This is a 4-bed/1.0-bath single-family listed at $45k.
Deal economics
- At list price, monthly cash flow is $626 ($8k/yr) — positive.
- The deal already cash-flows at list — no discount required.
- Meets the 1% rule at list price ($1k rent vs $45k).
- Cap rate 24.8% vs local median 1.8% in Independence — top-decile yield for the area; either an underpriced asset or a hidden risk that comps aren't pricing in. Stress-test before assuming the spread holds.
Location & tenants
- Location reads 66/100 on livability (#320 in VA) — a middle-class / working-renter tenant base. Strengths: cost of living A+, housing A+, crime B; Watch: health & safety C-, amenities F, commute F.
- Grayson County Public School District (rural): math 68% / reading 76% proficiency, ranked #27 of 131 in VA (top 21%) — strong family-tenant draw, lease renewals of 3-5y typical.
- Zoned schools: Independence Elementary (math 62% / reading 77%, grade A-, #313 of 1,108 statewide, top 32%, 277 students, 89% FRL); Independence Middle (math 60% / reading 73%, grade A-, #107 of 342 statewide, top 33%, 262 students, 88% FRL); Grayson County High (math 82% / reading 82%, grade A, #40 of 319 statewide, top 15%, 465 students, 87% FRL) — zoned schools average 88% FRL vs 53% district-wide (35 pts higher); higher-poverty schools than district average — tighter screening recommended.
- Market conditions: 17 active listings in the ZIP; 38 units permitted in Grayson County in 2024 (0 in 5+ unit buildings).
Forward outlook
- In year one you build about $2k of equity ($310 loan paydown + $1k appreciation (3.0% local appreciation)).
- Grayson County population projected at -24% by 2050 — secular population decline; favor cash flow + early exit over multi-decade hold.
- At projected returns (3.0% appreciation + 3.0% rent growth), your $13k cash investment doubles in ~2 years — after that, you're playing with house money.
Negotiation context
- Only 12 days on market — expect competitive offers; lowballing is unlikely to land.
Risks & watch-outs
- Watch-outs: flood insurance adds $66/mo; built in 1940 — expect roof / HVAC / electrical / plumbing capex.
- Climate carrying-cost: severe flood risk; moderate wildfire risk — expect insurance premiums to compound above CPI over the hold.
Questions for the listing agent
- Built in 1940 — when were the roof, HVAC, electrical panel, plumbing, and water heater last replaced?
- What's the actual annual flood-insurance premium (NFIP or private), and is the property in a SFHA with mandatory coverage?
- Is there a deadline driving the sale (1031 exchange, divorce, estate, relocation)? That informs how much negotiation room exists.
- Schools are A-rated — typically a magnet for longer-tenancy family renters. What's the average tenant stay here, and is there a school-zone premium baked into asking?
- What's the average days-on-market for RENTAL listings here right now (not sales)? A rising rental-DOM trend means longer vacancies and softer asking-rent achievability than the comps imply.
- What's the recent tenant-quality profile in this submarket — average credit score on applications, eviction rate, late-payment / NSF rate, and stable-employment percentage? A property-management company in the area should have these aggregated.
- How much new for-sale + rental construction is in the pipeline within 1–3 miles? Heavy new supply typically softens prices + rents 12–24 months out; constrained supply supports both.
Investment metrics
- 1% rule
- 2.71% ✓
- Cap rate
- 24.81%
- Cash-on-cash
- 66.13%
- DSCR
- 3.94
- GRM
- 3.1
CMA / ARV
No comps found within radius.
Projected returns pro-forma
3.0% appreciation · 3.0% rent growth · sell at horizon
- IRR
- 64.7%
- Equity multiple
- 4.61×
- Total profit
- $45,340
- Equity at exit
- $20,193
- IRR
- 64.2%
- Equity multiple
- 9.40×
- Total profit
- $105,543
- Equity at exit
- $31,122
Cash invested: $12,572 (down + closing). Projections, not guarantees.
Landlord ↔ Tenant lean methodology
- Overall (STATE)
- 55 Moderately Landlord-Leaning
- State Virginia
- 55 Moderately Landlord-Leaning · D+2
- County
- — inherits STATE
- City
- — inherits STATE
ZIP-level market 24326
- Home prices YoY
- 1.6%
- Active inventory
- 17
- Price-to-rent
- 3.1×
Monthly cashflow live
- Estimated rent
- $1,215 medium interval (Pro) →
- Mortgage (P&I)
- −$235
- Tax from tax record
- −$13 /mo · $151/yr
- Insurance
- −$19
- Flood insurance flood zone
- −$66 /mo · $798/yr
- HOA
- −$0
- Vacancy / Maint / Mgmt
- −$255
- Net cashflow
- $626
Break-even live
UW: 25.0% down · 7.5% · 30yr · 1.5% tax · 5.0% vac · 8.0% maint · 8.0% mgmt
Financing live
Cash to close
- Down payment
- $11,225
- Closing costs
- $1,347
- Reserves months
- —
- Total cash needed
- —
Loan-product check · same deal, 3 products live
Conventional
25% down · 7.5% · 30yr
- Down + closing
- —
- Monthly P&I
- —
- Monthly cashflow
- —
- DSCR
- —
- Eligible?
- —
Personal DTI + credit; lowest rate.
DSCR
20% down · 8.5% · 30yr
- Down + closing
- —
- Monthly P&I
- —
- Monthly cashflow
- —
- DSCR
- —
- Eligible?
- —
No personal income docs; deal must DSCR.
Hard money
10% down · 12.0% · 12mo
- Down + closing
- —
- Monthly P&I
- —
- Monthly cashflow
- —
- DSCR
- —
- Eligible?
- —
Short-term bridge; refi at stabilization.
Listing history 12 events
-
2026-06-18days on market $44,900 Active 12 DOM
-
2026-06-17price $44,900 Active 11 DOM
-
2026-06-17days on market $49,900 Active 11 DOM
-
2026-06-16days on market $49,900 Active 10 DOM
-
2026-06-15days on market $49,900 Active 9 DOM
-
2026-06-15days on market $49,900 Active 8 DOM
-
2026-06-13days on market $49,900 Active 7 DOM
-
2026-06-12days on market $49,900 Active 6 DOM
-
2026-06-09days on market $49,900 Active 3 DOM
-
2026-06-08days on market $49,900 Active 2 DOM
-
2026-06-07remarks 567-char remark
-
2026-06-07$49,900 Active 1 DOM
ⓘ Source: listings_history table (triggers on properties + properties_extension) + one-shot
backfill from property_details.listing_events for pre-trigger history.
Tax reassessment forecast VA · Resets to sale price
- Current annual tax
- $151 · $13/mo
- Projected year-2 tax
- $368 · $31/mo
- Expected delta
- +$217/yr (+$18/mo · 143.5%)
ⓘ Screening estimate from a state-policy table — verify with the county assessor before closing.
Climate risk First Street
- Flood 8/10 Severe FEMA zone X (unshaded) · 99% chance over 30 yrs
- Wildfire 5/10 Major
- Heat 2/10 Low 7 d/yr ≥90°F today · 20 d/yr by 30 yrs out
- Wind 2/10 Low 0% chance of damaging wind over 30 yrs
- Air quality 1/10 Low 0 unhealthy d/yr today · 0 by 30 yrs out
Nearby sold comps map
Loading sold comps map…
Walkable amenities ~0.75 mi
Loading nearby amenities…
Taxation est. · year 1
- Rental income
- $14,577
- − Mortgage interest
- −$2,515
- − Property taxes
- −$151
- − Insurance
- −$1,022
- − Repairs & maintenance
- −$1,166
- − Management
- −$1,166
- − Depreciation
- −$1,306
- Taxable income
- $7,250
- Est. tax owed @ 24.0%
- −$1,740
- After-tax cash flow
- $5,777/yr
For passive investors: Depreciation is non-cash, so a rental often shows a tax loss while cash-flowing — sheltering income. Rental losses are passive: they offset passive income freely, and up to $25,000/yr can offset ordinary (W-2) income if you actively participate and your MAGI is under $100k (phasing out to $0 by $150k); unused losses carry forward. On sale, claimed depreciation is recaptured at up to 25%, and gains may owe capital-gains tax (a 1031 exchange can defer both). Figures are a year-1 estimate at your 24.0% rate — not tax advice; consult a CPA.
Schools (NCES district)
- District
- Grayson County Public School District
- NCES district ID
- 5101690
- Math proficiency
- 68% ▼ -20.00%
- Reading proficiency
- 76% ▼ -7.00%
- Median HH income
- $31,429
- Composite
- 59.22/100
- National rank
- #942
- State rank
- #27 of 131 in VA
Livability — Independence
- Score
- 66/100
- State rank
- #320
- US rank
- #11693
Category grades
Schools grade is shown separately in the Schools card above.
Census & demographics
- Population (ZIP)
- 642
Population outlook (Grayson County) Hauer SSP2
- Today (2025)
- 14,252 people
- By 2030
- 13,634 · -4.3%
- By 2040
- 12,202 · -14.4%
- By 2050
- 10,811 · -24.1%
- By 2075
- 8,069 · -43.4%
- By 2100
- 5,647 · -60.4%
Race, ethnicity, and origin ACS 2023
- Neighborhood character
- Predominantly White (98%)
- Race & ethnicity
- White 98% Black 2%
- Common ancestry
- Romanian 3% Slovak 3% Serbian 2%
Political lean MEDSL · Grayson
- 2024 margin
- Solid R (+62.2) · D 18.6% · R 80.8%
- 2008→2024 swing
- -33.7pp toward R · 2008: -28.5pp · 2024: -62.2pp
- All cycles
- 2024: R+62.2 2020: R+61.4 2016: R+57.7 2012: R+37.9 2008: R+28.5
Not yet ingested
- Civics
- —
Market trends
- HPI YoY
- ▲ 3.00%
- Current HPI
- 187.5487
- Rent YoY
- —
- Metro
- —
- State GDP YoY
- ▲ 2.40%
- F500 in state
- 50
Industry mix (Fortune 500 HQ in VA)
| Industry | F500 HQs | Revenue |
|---|---|---|
| Aerospace / Defense | 4 | $236B |
|
||
| Technology / Defense | 3 | $32B |
|
||
| Financial Services | 2 | $176B |
|
||
| Utilities | 2 | $27B |
|
||
| Insurance | 2 | $25B |
|
||
| Technology | 2 | $15B |
|
||
Price history
1 event — show timeline
- 2026-06-06 Listed $49,900 SWVAR
Property tax history
-3.5%/yrLatest (2025): $151 · -25.9% YoY. Source: county tax records.
Cash-flow waterfall
monthlySold comps — $/sqft
last 12 mo · ≤1 miLoading sold comps…