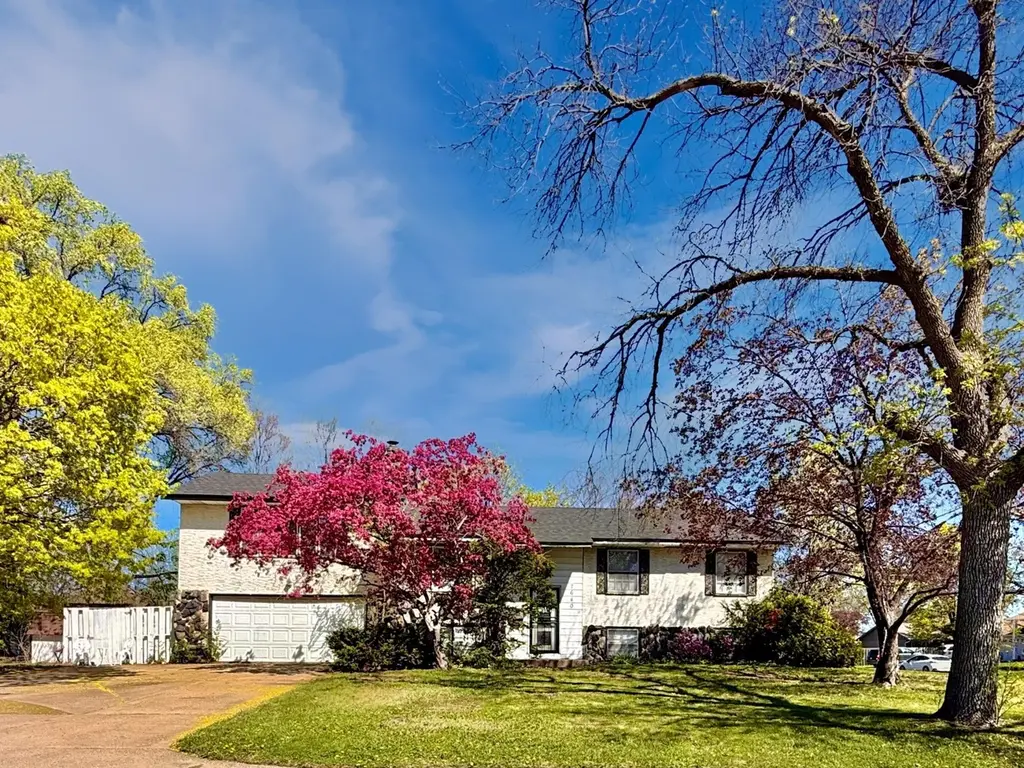
7640 Unity Ave N · Brooklyn Park, MN
Flood risk 3/10 · Minor
- FEMA flood zone
- X (unshaded)
- Chance of flooding over 30 yrs
- 0.2%
- Est. flood insurance / yr
- $473 – $860
Fire risk 1/10 · Minimal
- Est. fire insurance / yr
- $888 – $1,650
Heat risk 2/10 · Minimal
- Hot days now (above 99°F)
- 7 days/yr
- Hot days in 30 yrs
- 14 days/yr
Wind risk 2/10 · Minimal
- Chance of severe wind over 30 yrs
- —
Air-quality risk 2/10 · Minimal
- Unhealthy air days now
- 1 days/yr
- Unhealthy air days in 30 yrs
- 2 days/yr
Risk factors via First Street. Map © Google.
Why this score? — see what drove the D grade
The composite is a weighted blend of 9 inputs, each scored 0–100. Each bar is that input's sub-score; the figure is the points it added to the 100-point composite (weight × sub-score).
- ARV discount +15.0/15.0
- Cash flow +7.5/30.0
- Schools +4.2/10.0
- Rent growth +4.1/5.0
- Livability +4.0/5.0
- Condition / age +2.5/5.0
- 1% rule +2.2/10.0
- DSCR +1.6/10.0
- Appreciation +0.0/10.0
$290,000
🖨 Deal sheet 📄 Offer letter ✓ Due diligence
Listing remarks MLS
Completely updated interior. New Furnace, A/C Coil & H20 heater. New Kit Cabs & Appliances. New Carpet, Paint,Trim 6 panel doors, refinished h/w Floors. New tile & fixtures in bath & a new deck. 1 yr AON Warranty included. Agent is owner.
Key facts
- 0.28 acre lot
- 2 garage spots
- Built 1965
Property features AI
Exterior
- Parking: Attached insulated garage with 2 spaces (23x21)
- Utilities: City water connected; City sewer connected; Natural gas fuel; Electric service with circuit breakers
- Home design: Residential property; Three-level split floorplan; Deck entry/porch
- Construction: Block, concrete and frame construction; Asphalt roof (age 8 years or less); Block foundation
- Exterior features: Deck; Stone, stucco and vinyl exterior; Medium tree coverage; City street frontage (90x135 lot)
Interior
- Kitchen: Kitchen with window; Range; Microwave; Dishwasher; Refrigerator
- Bedrooms: 4 bedrooms total (3 on main level); Bedroom sizes include: 15x10, 15x10, 13x9, 11x9 (one bedroom 15x14 on lower level)
- Flooring: Hardwood floors
- Bathrooms: One full bathroom on the main floor
- Heating & cooling: Forced air heating; Central air conditioning
- Interior features: Separate formal dining room; Skylight; Paneled doors; Washer/dryer hookup; Water softener (owned); Full masonry wood-burning fireplace in living room; 3 bedrooms on one level
- Laundry & utility: Laundry located in basement; Dryer; Gas water heater
Neighborhood map
What this means for you Summary
Snapshot
- This is a 3-bed/1.0-bath single-family listed at $290k.
Deal economics
- At list price, monthly cash flow is $-360 ($-4k/yr) — negative.
- To cash-flow at today's rent, offer at most $226k (21.9% below list).
- To meet the 1% rule (rent ≥ 1% of price), the offer needs to be $208k (28.2% below list).
- Recommended offer: $208k (28.2% below list) — sets the bar for 1% rule.
- Cap rate 4.8% vs local median 3.3% in Brooklyn Park — top-decile yield for the area; either an underpriced asset or a hidden risk that comps aren't pricing in. Stress-test before assuming the spread holds.
Location & tenants
- Location reads 81/100 on livability (#50 in MN, #1,308 nationally) — a professional / high-income tenant draw. Strengths: commute A+, employment A+, housing A+; Watch: crime C-, schools D, amenities F.
- Osseo Public School District (suburban): math 42% / reading 51% proficiency, ranked #129 of 301 in MN (top 43%) — families likely to look elsewhere, expect single-tenant / working-renter base with shorter leases.
- Market conditions: Rents rising fast (+6.3%/yr); 169 active listings in the ZIP; 8 comparable units currently listed for rent nearby; rentals at typical pace (median 20d on market — plan ~3-4 weeks tenant-placement turnaround); solid renter incomes; 4,651 units permitted in Hennepin County in 2024 (2,443 in 5+ unit buildings).
Forward outlook
- Local home prices are declining (-3.0%/yr); year-one equity from $2k of loan paydown is wiped out by about $9k of value loss. Plan a longer hold.
- Hennepin County population projected at +30% by 2050 — long-run rental-demand tailwind backs the buy-and-hold thesis.
Negotiation context
- It's been on market 21 days — a 2% lower offer ($286k) is reasonable based on typical stale-listing flexibility.
- 6 sale attempts since 27y ago with the ask held roughly flat each time — persistent listings suggest the price (not the market) is what's stuck; bring a comps-based counter.
- Current owner paid $230k; 26% above their basis — modest negotiation headroom, anchor on the comps not their cost.
Questions for the listing agent
- What do current leases actually rent for vs. the listed asking? Can we see a recent rent roll and the last 12 months of T-12 income?
- Built in 1965 — when were the roof, HVAC, electrical panel, plumbing, and water heater last replaced?
- Is there a deadline driving the sale (1031 exchange, divorce, estate, relocation)? That informs how much negotiation room exists.
- Schools are D-rated, which usually means shorter tenancies and higher turnover. Who's the typical renter profile here, and what's been the actual vacancy rate?
- The area grade is low — what's the realistic commute time and amenity access for the typical tenant pool here? Any planned neighborhood developments (good or bad) we should know about?
- What's the average days-on-market for RENTAL listings here right now (not sales)? A rising rental-DOM trend means longer vacancies and softer asking-rent achievability than the comps imply.
- What's the recent tenant-quality profile in this submarket — average credit score on applications, eviction rate, late-payment / NSF rate, and stable-employment percentage? A property-management company in the area should have these aggregated.
- How much new for-sale + rental construction is in the pipeline within 1–3 miles? Heavy new supply typically softens prices + rents 12–24 months out; constrained supply supports both.
Investment metrics
- 1% rule
- 0.72% ✗
- Cap rate
- 4.80%
- Cash-on-cash
- -5.32%
- DSCR
- 0.76
- GRM
- 11.6
CMA / ARV
- ARV (median comp)
- $375,889
- List price
- $290,000
- Delta
- -22.85%
- Verdict
- UNDERPRICED
- Comps
- 2 within 1.0 mi
Projected returns pro-forma
-3.0% appreciation · 6.26% rent growth · sell at horizon
- IRR
- -21.8%
- Equity multiple
- 0.23×
- Total profit
- $-62,823
- Equity at exit
- $43,240
- IRR
- -9.3%
- Equity multiple
- 0.35×
- Total profit
- $-53,147
- Equity at exit
- $25,074
Cash invested: $81,200 (down + closing). Projections, not guarantees.
Landlord ↔ Tenant lean methodology
- Overall (STATE)
- 46 Balanced
- State Minnesota
- 46 Balanced · D+2
- County
- — inherits STATE
- City
- — inherits STATE
ZIP-level market 55443
- Rents YoY
- 6.3%
- Active inventory
- 169
- Price-to-rent
- 11.6×
Monthly cashflow live
- Estimated rent
- $2,081 high interval (Pro) →
- Mortgage (P&I)
- −$1,521
- Tax from tax record
- −$362 /mo · $4,346/yr
- Insurance
- −$121
- HOA
- −$0
- Vacancy / Maint / Mgmt
- −$437
- Net cashflow
- $-360
Break-even live
UW: 25.0% down · 7.5% · 30yr · 1.5% tax · 5.0% vac · 8.0% maint · 8.0% mgmt
Financing live
Cash to close
- Down payment
- $72,500
- Closing costs
- $8,700
- Reserves months
- —
- Total cash needed
- —
Loan-product check · same deal, 3 products live
Conventional
25% down · 7.5% · 30yr
- Down + closing
- —
- Monthly P&I
- —
- Monthly cashflow
- —
- DSCR
- —
- Eligible?
- —
Personal DTI + credit; lowest rate.
DSCR
20% down · 8.5% · 30yr
- Down + closing
- —
- Monthly P&I
- —
- Monthly cashflow
- —
- DSCR
- —
- Eligible?
- —
No personal income docs; deal must DSCR.
Hard money
10% down · 12.0% · 12mo
- Down + closing
- —
- Monthly P&I
- —
- Monthly cashflow
- —
- DSCR
- —
- Eligible?
- —
Short-term bridge; refi at stabilization.
Rent comps 8 comps
| Address | Beds | Baths | Sqft | Rent | $/sqft | DOM | Units | Dist |
|---|---|---|---|---|---|---|---|---|
| 5528 Brookdale Dr N Minneapolis, MN | 3.0 | 2.0 | 1400 | $2,195 | $1.57 | 43d | 1 | 0.18mi |
| 5840 73rd Ave N Minneapolis, MN | 1.0–2.0 | 1.0 | 1031 | $1,650 | $1.60 | 14d | 1 | 0.49mi |
| 7441 Major Ave N Minneapolis, MN | 3.0 | 2.0 | 1800 | $2,600 | $1.44 | 16d | 1 | 0.54mi |
| 8007 Colorado Ave N Brooklyn Park, MN | 4.0 | 2.0 | 2124 | $1,500 | $0.71 | 19d | 1 | 0.66mi |
| 7212 Kyle Ave N Minneapolis, MN | 3.0 | 2.0 | 1700 | $2,400 | $1.41 | 43d | 1 | 0.86mi |
| 8447 Regent Ave N Minneapolis, MN | 1.0–2.0 | 1.0–2.0 | 1000 | $1,555 | $1.55 | 2d | 5 | 0.87mi |
| 8316 Zane Ave N Unit NORTH-207 Brooklyn Park, MN | 3.0 | 1.5 | 1370 | $1,695 | $1.24 | 43d | 1 | 0.88mi |
| 3401 75th Ave N Minneapolis, MN | 4.0 | 2.0 | 2088 | $2,729 | $1.31 | 2d | 1 | 1.21mi |
Listing history 20 events
-
2026-06-03statusdays on market $290,000 Pending 21 DOM
-
2026-06-02days on market $290,000 Contingent - Inspection 20 DOM
-
2026-06-01days on market $290,000 Contingent - Inspection 19 DOM
-
2026-05-31days on market $290,000 Contingent - Inspection 18 DOM
-
2026-05-17status Active 967-char remark
-
2026-05-09status Pending 967-char remark
-
2026-05-05$290,000 Active 967-char remark
-
2005-09-29soldstatus $230,000
-
2005-08-16soldstatus $230,000 254-char remark
Show marketing remark (254 chars)
Completely updated interior. New Furnace, A/C Coil & H20 heater. New Kit Cabs & Appliances. New Carpet, Paint,Trim 6 panel doors, refinished h/w Floors. New tile & fixtures in bath & a new deck. 1 yr AON Warranty included. Agent is owner.
-
2005-07-27historical 254-char remark
Show marketing remark (254 chars)
Completely updated interior. New Furnace, A/C Coil & H20 heater. New Kit Cabs & Appliances. New Carpet, Paint,Trim 6 panel doors, refinished h/w Floors. New tile & fixtures in bath & a new deck. 1 yr AON Warranty included. Agent is owner.
-
2005-07-08$247,500 254-char remark
Show marketing remark (254 chars)
Completely updated interior. New Furnace, A/C Coil & H20 heater. New Kit Cabs & Appliances. New Carpet, Paint,Trim 6 panel doors, refinished h/w Floors. New tile & fixtures in bath & a new deck. 1 yr AON Warranty included. Agent is owner.
-
2005-03-09historical
Show marketing remark (156 chars)
4+ BR home on corner lot. Frplc,hardwood and tile . Huge living room. Needs TLC.Large deck. 'As Is' Sale. Great family home. AGENTS MUST READ AGENT REMARKS!
-
2005-03-01soldstatus $187,500
Show marketing remark (156 chars)
4+ BR home on corner lot. Frplc,hardwood and tile . Huge living room. Needs TLC.Large deck. 'As Is' Sale. Great family home. AGENTS MUST READ AGENT REMARKS!
-
2004-12-17$189,900
Show marketing remark (156 chars)
4+ BR home on corner lot. Frplc,hardwood and tile . Huge living room. Needs TLC.Large deck. 'As Is' Sale. Great family home. AGENTS MUST READ AGENT REMARKS!
-
2004-10-13historical
-
2004-05-10$199,900
-
1999-10-29soldstatus $133,000
-
1999-08-30soldstatus $133,000
-
1999-08-06historical
-
1999-08-04$134,900
ⓘ Source: listings_history table (triggers on properties + properties_extension) + one-shot
backfill from property_details.listing_events for pre-trigger history.
Tax reassessment forecast MN · Partial reset (capped growth)
- Current annual tax
- $4,346 · $362/mo
- Projected year-2 tax
- $4,346 · $362/mo
- Expected delta
- $0/yr ($0/mo · 0.0%)
ⓘ Screening estimate from a state-policy table — verify with the county assessor before closing.
Climate risk First Street
- Flood 3/10 Moderate FEMA zone X (unshaded) · 20% chance over 30 yrs
- Wildfire 1/10 Low
- Heat 2/10 Low 7 d/yr ≥99°F today · 14 d/yr by 30 yrs out
- Wind 2/10 Low
- Air quality 2/10 Low 1 unhealthy d/yr today · 2 by 30 yrs out
Nearby sold comps map
Loading sold comps map…
Walkable amenities ~0.75 mi
Loading nearby amenities…
Taxation est. · year 1
- Rental income
- $24,974
- − Mortgage interest
- −$16,245
- − Property taxes
- −$4,346
- − Insurance
- −$1,450
- − Repairs & maintenance
- −$1,998
- − Management
- −$1,998
- − Depreciation
- −$8,436
- Taxable loss
- −$9,499
- Est. tax savings @ 24.0%
- +$2,280
- After-tax cash flow
- $-2,037/yr
For passive investors: Depreciation is non-cash, so a rental often shows a tax loss while cash-flowing — sheltering income. Rental losses are passive: they offset passive income freely, and up to $25,000/yr can offset ordinary (W-2) income if you actively participate and your MAGI is under $100k (phasing out to $0 by $150k); unused losses carry forward. On sale, claimed depreciation is recaptured at up to 25%, and gains may owe capital-gains tax (a 1031 exchange can defer both). Figures are a year-1 estimate at your 24.0% rate — not tax advice; consult a CPA.
Schools (NCES district)
- District
- Osseo Public School District
- NCES district ID
- 2725200
- Math proficiency
- 42% ▼ -7.00%
- Reading proficiency
- 51% ▼ -4.00%
- Median HH income
- $76,168
- Composite
- 42.35/100
- National rank
- #3250
- State rank
- #129 of 301 in MN
Livability — Brooklyn Park
- Score
- 81/100
- State rank
- #50
- US rank
- #1308
Category grades
Schools grade is shown separately in the Schools card above.
Census & demographics
- Census place
- Brooklyn Park, MN
- County
- Hennepin County · 1,150,272 people
- City population
- 33,660
- Metro
- Minneapolis-St. Paul-Bloomington, MN-WI
- Population (ZIP)
- 33,660
- Household income
- $95,082
- Rent vs Own
- Severe rent burden
- 968.0
Population outlook (Hennepin County) Hauer SSP2
- Today (2025)
- 1,405,227 people
- By 2030
- 1,492,650 · +6.2%
- By 2040
- 1,660,157 · +18.1%
- By 2050
- 1,823,498 · +29.8%
- By 2075
- 2,221,283 · +58.1%
- By 2100
- 2,509,976 · +78.6%
Race, ethnicity, and origin ACS 2023
- Neighborhood character
- Highly diverse neighborhood (Simpson 0.71)
- Race & ethnicity
- White 40% Black 30% Asian 19% Two or more races 8% Hispanic / Latino 4%
- Common ancestry
- Portuguese 7% Swiss 4% Romanian 3%
- Foreign-born
- 25% · Vietnam, Canada, South Korea
- Languages at home
- 71% English-only · Other Asian/Pacific 10% Vietnamese 4% Spanish 2%
Political lean MEDSL · Hennepin
- 2024 margin
- Solid D (+42.6) · D 70.2% · R 27.5% · Other 2.3%
- 2008→2024 swing
- +14.0pp toward D · 2008: 28.6pp · 2024: 42.6pp
- All cycles
- 2024: D+42.6 2020: D+43.2 2016: D+35.3 2012: D+27.1 2008: D+28.6
Not yet ingested
- Civics
- —
Market trends
- HPI YoY
- ▼ -199.26%
- Current HPI
- 206.3855
- Rent YoY
- ▲ 6.26%
- Metro
- Minneapolis-St. Paul-Bloomington, MN-WI
- State GDP YoY
- ▲ 2.41%
- F500 in state
- 34
Industry mix (Fortune 500 HQ in MN)
| Industry | F500 HQs | Revenue |
|---|---|---|
| Healthcare | 2 | $407B |
|
||
| Retail | 2 | $150B |
|
||
| Consumer Goods | 2 | $32B |
|
||
| Industrial Machinery | 2 | $6B |
|
||
| Agriculture | 1 | $40B |
|
||
| Healthcare / Medical Devices | 1 | $32B |
|
||
Price history
+115.0% since first listed18 events — show timeline
- 2026-06-03 Pending — NORTHSTARMLS as Distributed by MLS Grid
- 2026-05-24 Contingent — NORTHSTARMLS as Distributed by MLS Grid
- 2026-05-17 Relisted — NORTHSTARMLS as Distributed by MLS Grid
- 2026-05-09 Pending — NORTHSTARMLS as Distributed by MLS Grid
- 2026-05-05 Listed $290,000 NORTHSTARMLS as Distributed by MLS Grid
- 2005-09-29 Sold (Public Records) $230,000 Public Records
- 2005-08-16 Sold (MLS) $230,000 NORTHSTARMLS as Distributed by MLS Grid
- 2005-07-27 Listing Removed — NORTHSTARMLS as Distributed by MLS Grid
- 2005-07-08 Listed $247,500 NORTHSTARMLS as Distributed by MLS Grid
- 2005-03-09 Listing Removed — NORTHSTARMLS as Distributed by MLS Grid
- 2005-03-01 Sold (MLS) $187,500 NORTHSTARMLS as Distributed by MLS Grid
- 2004-12-17 Listed $189,900 NORTHSTARMLS as Distributed by MLS Grid
- 2004-10-13 Listing Removed — NORTHSTARMLS as Distributed by MLS Grid
- 2004-05-10 Listed $199,900 NORTHSTARMLS as Distributed by MLS Grid
- 1999-10-29 Sold (Public Records) $133,000 Public Records
- 1999-08-30 Sold (MLS) $133,000 NORTHSTARMLS as Distributed by MLS Grid
- 1999-08-06 Listing Removed — NORTHSTARMLS as Distributed by MLS Grid
- 1999-08-04 Listed $134,900 NORTHSTARMLS as Distributed by MLS Grid
Property tax history
+4.7%/yrLatest (2025): $4,346 · +2.7% YoY. Source: county tax records.
Cash-flow waterfall
monthlySold comps — $/sqft
last 12 mo · ≤1 miLoading sold comps…